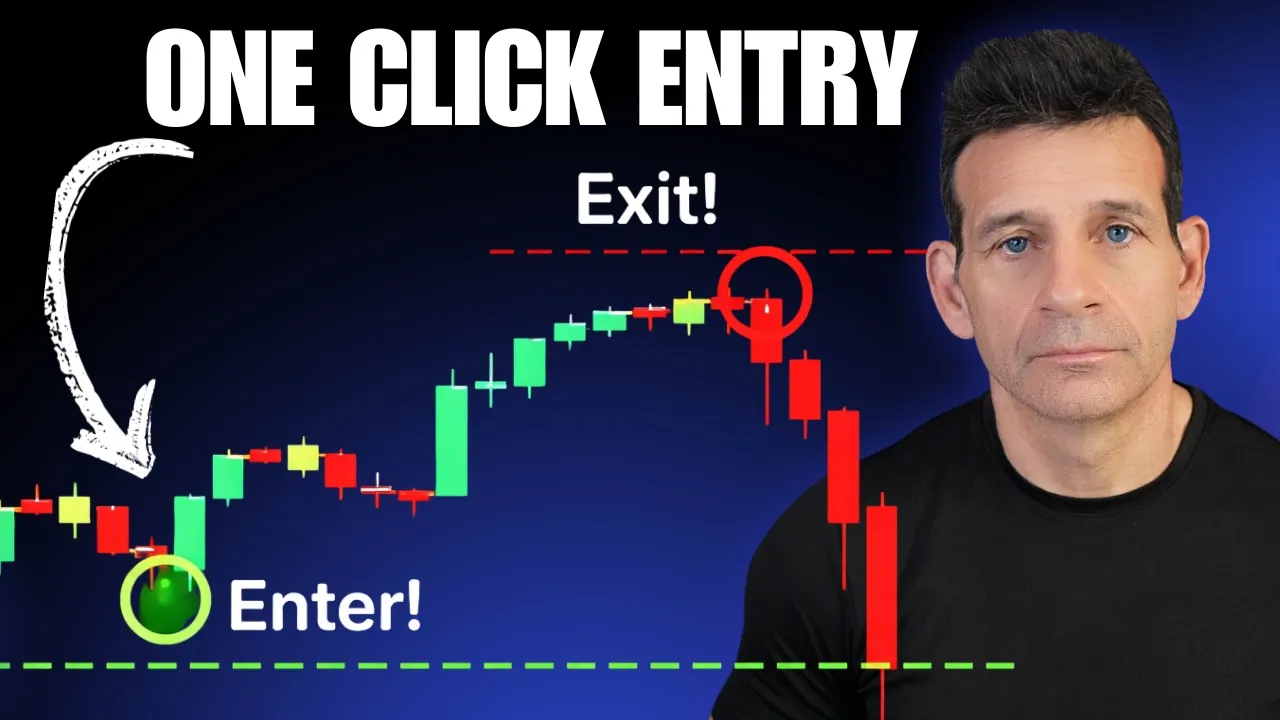
If I Wanted To Get Rich In 2026, I'd Use This Entry Strategy transcript
The Rumers · @the.rumers
Words
4,810
Runtime
26:15
Speaking pace
183wpm
Reading time
20min
183 words per minute, just over the 181 median of 349 measured videos. That distribution comes from the 349-video hook study.
Opening (first 30 seconds)
Today, we're going to be talking about entries. This is the biggest secret weapon used by all the top traders in the world. They are masters of this. And if you want your trades to start performing better, you've got to master your entries. Otherwise, everything you ever try to do just isn't going to work out the way that it should. You see, for every bad entry you take, you get two immediate problems that you don't need. Number one, you're increasing the risk on that trade. And number two, you're
92 words, the words spoken in the first 30 seconds at 183 words per minute.
Sentence shape
| Measure | This transcript |
|---|---|
| Sentences | 310 |
| Average words per sentence | 15.5 |
| Longest sentence | 55 words |
| Questions asked | 47 |
| Sentences containing a number | 17 |
Most used terms
- candle44
- chart27
- move26
- buyer25
- candles20
- show17
- entry16
- day12
- liquidity12
- market12
- stop12
- trading12
Filler phrases
44 in total: like 15 · kind of 9 · right? 9 · actually 5 · you know 4 · I mean 1 · sort of 1.
A literal whole-word count of the same phrase list the Prepublish browser extension uses, so a phrase inside another word is not counted and a phrase used in its ordinary sense still is. It is a count and not a judgement.
What this transcript is
Every word below is the caption track YouTube publishes for this video, pulled from the video itself and reproduced unchanged. It is not Prepublish's writing, not a summary, and not a re-transcription: it is the video's own published captions. English captions, generated automatically by YouTube, in the video’s original language. Source: the video on YouTube. A channel that would rather this page did not exist can ask for its removal through the contact page, and it is removed.
Transcript
Today, we're going to be talking about entries. This is the biggest secret weapon used by all the top traders in the world. They are masters of this. And if you want your trades to start performing better, you've got to master your entries. Otherwise, everything you ever try to do just isn't going to work out the way that it should. You see, for every bad entry you take, you get two immediate problems that you don't need.
Number one, you're increasing the risk on that trade. And number two, you're chewing into your available reward if that trade happens to work out. Now, just so we're all on the same page, trading doesn't really work that way and it's not going to be a lot of fun. So, if you're tired of getting stopped out too soon on all of your trades, you're tired of these little tiny wins followed by these enormously large losses, or you're just tired of hesitating and being frozen and not executing to perfection, well, this video is for you.
Now, my name is Doug and I've been a professional trader now for 26 years. And in today's video, I want to share with you my all-time favorite entry strategy called the Unsharp. This is hands-down the easiest and simplest way for any trader to ensure they are getting the very best entry possible on all of their trades. So, having said that, let's go ahead and get started with today's video. So, what exactly is the Unsharp method?
The Unsharp method is a way to accurately predict a future chart pattern long before that pattern has ever developed. And by doing this, you can always ensure you're getting the very best entry possible, but better than that, you're always putting yourself in the best risk versus reward scenarios possible. And you're going to see how valuable that is in just a second. Now, before I get into all this, I want to show you something here so you truly understand what I'm talking about, as well as show you some of the critical mistakes you're probably making right now, critical mistakes that I made for years and didn't even know about it.
So, on your screen, you're going to see your typical chart pattern cheat sheet that you can find anywhere on the internet. But, what I want to do in this section is highlight two major problems with these chart patterns right here using them in their standard way and how the Unsharp fixes these two problems. Number one, I just want you to pick any chart you see, any chart pattern you see, and I want you to just focus on the entries only.
And what I'm going to do is I'm just going to open up one of these so we can get a better look. Let's go with the ascending triangle over here and let's just take a better look at this, okay? So, let's first take a look at the entry. And you're going to see this with all of these patterns. Here's the problem. If you're a day trader that's using a small intraday timeframe, like a 1-minute, 5-minute, even a 1-hour, the price of the asset where this recommended entry is, the price of the asset in the not-too-distant past was trading all the way down here.
There's a substantial difference in price of where this thing was a few moments, minutes before to where the recommended entry is. And if you look at them, they're all the same. So, in short, they're recommending that you're chasing every single entry into momentum. But, there's another problem with this that's even worse. Every single bank, institution, high-frequency trading firm, algorithm program written in the market is specifically written to trade against this.
And it's specifically written that way because they know every rookie or inexperienced trader that comes into the market is going to trade this. It's almost like they're leading you into the lion's den. This is one of the reasons why a lot of these trades don't work. Now, here's where the Unsharp fixes this. What if I was to tell you that with 80% accuracy, at least, I can show you an entry model that can get you down here for your entry and then what you're going to do is you're going to sell into all the liquidity when the rest of the people decide to chase it.
That's the Unsharp. Now obviously the question now is how in the hell do we know a chart pattern's going to develop long before it actually has? It's not like you and I have a time machine, right? But the good news for us is we don't need a time machine. All we need is three candles to appear and we'll get all the answers to our question. Starting with candle number one which we will call for this video the elite candle.
Now a lead candle is a very fast, aggressive candle that is moving in one direction. Now for a lot of you out there that have been trading, I'm sure you've seen these candles. They're very fast, they're very strong and they look intimidating. And you're going to find out here in just a few moments they're actually designed to do just that, to intimidate the new trader. But the reason I like to call this a lead candle is because it draws our attention to the trade and it lets us know that this asset is currently say quote unquote in play.
And there's going to be a massive reversal on this move and we need to be ready for it. Now one more thing before I move on to step two, this lead candle has often been referred to as well as manipulation candles, liquidity grabs, stop hunts, liquidity sweeps and all those other types of names. But for today's video, we're going to stick with lead candle. Now candle number two could be a series of candles or just one singular candle.
What we're looking for here is a period of consolidation, but more than that, we're looking to verify the legitimacy of the buyer who steps in on those bold reds or we're looking to verify the legitimacy of the seller who's jumping in on those huge green bars. This is what we need to know to verify that whoever's stepping in there is serious and big money is being put to work. And the third and final piece of this puzzle is we just need one singular candle to reverse through that consolidation or confirmation area.
That right there becomes our entry. Our stop goes below the low of that candle, then we're targeting the entire move to come back up through those first initial candles. Now, some of that might sound confusing right there towards the end, but let me show you exactly what this looks like on a chart. So, on your screen you're going to see we have an intraday 5-minute chart on the E S E-mini futures. Now, one thing I want to do before I go further is let everyone know I am going to show you how this works on other assets.
I also want to take this moment to answer a question I always get when I do these videos. Does this work on foreign currency? Does this work on gold? Does this work on oil? Does this work on the other numerous instruments that are traded around the world? And the answer is always, yes. It doesn't matter what time frame, it doesn't matter what asset. I want everybody who's listening to remember these words. And that is the beautiful thing about being a market technician is technical analysis is universal.
A chart is simply a chart. And you can throw any name you want up in that corner and the same thing is going to apply when you see what you see. And we'll go through that here in just a second. But, the first thing I want to talk about right now is you can see right here this blue shaded area on my screen represents the pre-market going into the United States session. And the black shaded area is the official opening ceremonies of the US market.
But, notice the very first thing that happens is what? You get this aggressive candle formation, three straight violent candles down. Now, here's the thing we have to understand. When the newer trader or the rookie trader, inexperienced trader sees this type of move, the very first trigger we get in our brain is obviously, market correction. This is terrible because this is the exact frame of mind I was into and until someone shows you and teaches you what I'm about ready to teach you, you're always going to have those feelings.
So, that's a series of lead candles. Now, sometimes it could be represented by by one violent candle. It could be a multitude of candles, but this lets us know that a run, a liquidity run or a move is being made on the ESE mini futures, hence this violence of downward moving price action. But, just because something moves downward, none of us on this planet have any idea when that move might stop. It could stop quickly or it could just keep on going for several hours.
What we need to see is some buyers step in in this case and show their legitimacy. Now, I want to kind of highlight. I'm going to open this chart up just a little bit so we can really get a good look at these candles because this is what's important. Notice right here on this secondary candle, this wick that's on the very bottom of this candle. Let me get rid of that. Just take a look at this wick right here. This was the first time since the market had opened that a buyer showed up.
So, when you see that wick on the very bottom, just like you saw the wick at the very top meant the seller had shown up, the wick on the bottom represents that this is the first hand laid down by a real legitimate buyer. Now, just because one hand has been laid down on the table with a legitimate buyer doesn't mean, "Oh, that's the bottom." What we need to do when we move from the lead candles to the confirmation candles is monitor the price action of each individual candle to see if that buyer, number one, how many times that buyer has been tested and how serious is that buyer.
Now, here's what I mean by that. If we move to the secondary candle right here, this next one. While price did break the low of the day, we're going to talk so much about this concept here about allowing candlesticks to close, allowing these candlesticks to develop. Even though price had protruded through the low of the day, what is it that you see with your eyes? So, the second time around, the buyer is tested and again, what happens is they show back up.
So, now what you have is this massive buyer who's been tested two times in a period. These are 5-minute candles. two times in 10 minutes, showing that this person or in the entity, whatever it may be, is very serious about supporting this instrument. Now, if we move over to the third candle right here, notice that after a brief spike upwards, it starts to immediately press back down into this known buyer. And if I just kind of move one candle forward after that, I want to show you what the end result is.
Notice that the third time that you walked into that buyer, they bought yet again and you got this violent snapback. Now, I want to take a quick moment. Maybe it's just slightly off topic, but this is super valuable to everybody watching. I want to show you because I mentioned something in the introduction about, you know, sucker moves or getting stopped out all the time. I want to show you why this actually happens.
Notice on this candle right here, which is what I want to talk about. This wick right here on the top of that candle signifies that this once was a bold green candle and it looked like it was going to kind of reverse right there. But then it immediately pulls off the top. Well, what happens is that candle comes back down into the buyer and so many new traders are looking at this because they're thinking the structure of this chart, right?
We're all taught market structure. The chart The chart structure is going down. The bias is bearish because you were sucked into these lead candles. Look, I've done this before, too. And now this failed rally appears to be like, "Oh, that's that's the sign right there. They're going to sell the whole thing off." Except for there's one major problem. You're walking into the liquidity zone right next to this buyer. And until that big buyer can be completely dispatched of, you must respect the fact that they can come back in and buy into this, which is exactly what happened.
Now, I wanted to bring that up because the reason this type of strategy or entry model works is because this is a trap. This is designed to trap new traders. It's designed to get the inexperienced traders thinking this is a market crash, selling must take place, this thing is not going to rally, and then all of a sudden it does. Now, this bar right here, the first green, becomes what we call the execution candle. Now, in this case, we have what we need to make a solid trade because we have presence of the buyer not once, not twice, not three times, but four times over a in 20-minute span because these are 5-minute candles, the buyer has solidified their seriousness.
Now, because this bar is so green and so strong, it meant that so many traders walked into the lion's den here, got stopped out on those shorts, hence the violence that this thing come re- re- reverses. Now, I'm going to play this tape forward so you can see what the ultimate outcome is of this. And I kind of want to just move this chart down a little bit so everybody can see it. We're just going to kind of play a few bars and see the inverse relationship had had has happened here.
But it started this move right here, this rally, right? This rally that happened right here was originated or it came to be or it was possible because of the sweep or the lead candles or the manipulation, whatever you want to call it, because of this move right here. Now, what I want to do here is show you something else I think you're going to find interesting. If I come over here and I look at this candle to this candle.
What formation What formation, guys, is this? Is this exactly what I showed you on the chart pattern cheat sheet? To me, it looks like this is a flag pattern setup, right? This goes back to what I was talking about. Most strategies that are using those cheat sheets only is having you enter all the way up here. When just a few moments ago, the price was all the way down here. This is a hell of a big chase. So, now we can get into the last step of dialing in the unsharp method.
And what I want to do in this section is answer a question I think a lot of people have on the forefront of their mind right now. And that is, when I see those aggressive down moving bars, how do I develop the strength and cojones to step in there with both hands and buy? How do I know that I am not catching the falling knife? Cuz I know a lot of you've been taught since the day you started trading, one of the worst things you can do is catch a falling knife, right?
Trend is your friend. How do you know? What if I was to tell you that while those bars were aggressively going down, that you knew with a very high degree of probability exactly where this big buyer is going to step in? This is what I'm going to show you right now here on the chart. So, let's go back to our ESE mini chart. And what I want to focus on right now is just this confirmation action that we highlighted earlier.
Those wicks on the very bottom, where we noticed the presence of a large buyer was stepping in. What we want to do here is when we see this, we want to grab some sort of line, just any basic line from our trading software, and I just want to lay it somewhere down towards the bottom. Doesn't have to be perfect. And I'm going to drag that out to the left. So, I'm going to kind of minimize this chart a bit. And I'm going to bring it right out here to the left.
And I want you to tell me, what is it that you see? Notice that the buyer was tested back here, which led to a rally. The instrument drops aggressively, but the buyer re-shows back up, leads to another rally. Now, as this is starting to become aggressive and building downward momentum while most of the people are thinking this is the next market crash, this thing is going to go lower, experienced traders know what? That if this starts moving lower, it's going to go right back in to this buyer here.
It is going to challenge them for another time. So, when you look back at this, what I want everyone to understand here is this is one, two, three, four, five, six. Six shots over a couple of hours where this instrument went right into that buyer. Now, I want to ask you a very common sense question that will take your trading to another level. If whoever that is or whatever that is down there, if they come in there six straight freaking times, how you going to get through this person?
That is your guardian angel. That is not going to go lower because someone is defending that. Now, let's talk about right now, how do you pull the trigger on this and enter? What I look for is a green candle closure, just like this one. That's all you need. You don't even need to complicate it. We need the green candle closure cuz notice the candle before started green, but couldn't finish green. Now, when I see this, what I'm going to do, let's just put the buy sell button on here.
And let's just do a sample buy for this one. We're just going to buy that candle right there. That's going to be the entry. As soon as it closes, you just push the button. Now, to make this simple, what we're going to do is drag the stop loss underneath the low of the day. Now, that puts your risk in order. So, the low And here's what I want you to understand about that, too. Think about this. Our stop loss in this case isn't some random number we picked out of the air.
We are slightly below the large buyer. How much more confident you can be? Now, let's talk about the target. This is not a targeting video, but just think about where would you put the target? Well, if it's swept the liquidity at the bottom of the chart, it most likely is going to attack the liquidity at the top of the chart, right? So, the target price comes all the way up here to this area. And that creates your trade.
So, just kind of play this one through. This again, this is just an example. You'll see that's exactly where it goes. Now, as we get back up here, most of you have already seen this. I want to stop this chart right here, and I want to move back to this bar cuz I want to show you something else. Because we talked a little bit before about, you know, this secondary run right here was in fact like a run on the upper liquidity.
So, if I were to move this chart down and I'm to grab a line, for example, and just tap this If I move this over here to the left side of the screen, do you think there's something over there? Like once this started running, did you think there might be something over there? And the fact is, there is. There is this known resisted area from the day prior. So, as this is moving, it would either get halted here, not halted as in stop, but you know, the seller would show back up here, or the seller would show back up here.
Now, just kind of smooth through most of this, you now have a red bar take out. Let me open this up so I don't confuse everybody. Notice down here, you had presence of a buyer, one green candle close, presence of a seller, one, two, three, and a red bar close. So, could we sell that? Right? Like, could we do that inverse? Let me get rid of all my mess. Couldn't we just sell that? Stop loss goes right up over the top, and couldn't we move back down into this area?
This That makes sense, right? That that should sweep it right back to the low. And if I just keep playing it through, you're going to see this is exactly what happens. It finds its way all the way back down into the buyer a seventh time, and here it it starts to bounce. So, you can see that once you combine these aggressive moving candles downward along with the levels, this this setup takes on a whole new meaning. Now, I want to show you a few trades here that were done in our live trading community using this Unchart formula.
Okay, so the first trade example for today is going to be on the stock AVGO. For the rest of the video, I will remain in the intraday 5-minute chart. These are trades that were taken in our live trading community, but this is a playback. So, one thing I want to mention here, as you see AVGO does what? It gets extremely aggressive at the open. Most of you by this time in the video should realize that when you see these aggressive candles, whether they're up or down, instead of wanting to participate and chase into the momentum, we actually should be looking to reverse.
But on candle number two on this 5-minute chart, take a good look at the wick. You get an immediate drawdown of that wick, a very nice pullback. So, what we want to do is when we see that very first wick appear, we want to mark that level and match it with something in the past by moving to the left. So, I move over here to the left and you'll see this area was in fact a previous day's resistance. Now, here's why we really have to have this candle closure.
Because the previous day's high was little is a little bit higher. So, it's not like this can't move up towards that 327. So, we do have to get this candle closure to make sure what? That this seller is in fact serious. So, if I move the next candle through, what do we have here? Note that we have yet again another attempt to try to break that range and make that run to 327, but the seller is now present. So, this is two back-to-back 5-minute candles, seller is present.
We know they are serious. But still, for us to pull the trigger, we must be below these two candles right here. Let me put a line on this. Just right there, because this would be the entry, the stop would go over the top. But we have to have that because it can still go higher. Next candle, what is it that we do here? Nothing at all. It's Now, this is a third confirmation. Look, 1 2 3, three confirmations. This seller is extremely serious.
All you need to do is wait for the confirmation. We'll move to the next candle forward here. And what happens? There. Right there, you get the break, just barely. So, we will put a sell order. Again, this is a playback. The stop loss goes above the high of the day. Now, what are we looking for? If you swept the liquidity to the top, you're going to sweep the liquidity back down to the bottom. So, I kind of move this through here a little bit, and what happens is that's exactly where it goes.
It takes it out completely. Next up is the stock Apple, still on an intraday 5-minute chart. This one should be real easy, much like AVGO. Three straight candles up, your very first wick. Now, you don't have to go too far back to see this one. All you need to do is go right back into the pre-market, and you'll see this is a extended double top. So, I'm going to open this up. What is it we need, guys? We need a break of this candle.
We see the presence of the seller. We need to confirm their strength by breaking the lows. Next candle comes through, right there is the entry. We hit the sell button, stop loss goes above the high of the day, target price, sweep liquidity back to the low. We move this forward, what do you get yet again? Another drop in the stock, right? And it comes all the way back down to the low. Took a little while, but it got there.
Next one, here is the ES E-mini futures on a 5-minute chart. Now, I chose to show you this one because it doesn't always have to be the very first two to three bars out of the open. Notice that this one is dragging itself down, but it's not doing it all in one bar. There's actually quite a few of them here, but the feeling and the meaning is still the same. It's drawing down, but it's drawing down a little slower. Now, if you take a look at this area, I'm going to move through this one quicker.
You got a wick right here, right off of the 6785, excuse me, 6765. Next red candle revisits it, and then the third candle holds it. See it? 1 2 3. Now, all we had to do is just take a peek right over there to the left. There is your culprit. This is a long. All we need is a bar to take out this high right here. And if I move forward, what do we got here on the next candle? Right there it is. The entry would be right here.
Now, I'm not going to hit the actual button in this case because when you do this playback, it only does candle closure. So, I would have entered right there on the break since this candle had closed green. I would enter right there. Target would take you all the way back up to the high of day, back to the origination of the opening sell-side liquidity. And what do you get here? You getting another move back up. That is the power of the unsharp.
You're always getting the best risk versus reward scenarios, as well as the best entries possible on your trades. Now, on that note, guys, again, thank you for watching today's video. If you're looking to take your trading to the next level every single day the market is open. My wife and I are trading live on a broadcasted Zoom screen, going through every single thing that we trade, everything that we're looking about and we're talking about every trade that we do take, walking everybody through it, helping people come together and start making quality trades and building really strong trading careers.
Now, if that's something you're interested in, the link is down in the description. And on that note, let me again say thank you. Take care. Trade well. Until next time. Cheers.
The words are the caption track's own and nothing is reworded or re-transcribed. Paragraph breaks are placed between sentences so the text reads as prose.
Use this transcript
Three free tools that work on the material around a video like this one. No signup, no login.
Hook Analyzer
Paste the first 30 seconds of your own draft for a hook score and rewrites.
Policy Pre-Flight
Check your draft against YouTube's advertiser-friendly guidelines before you record it.
Channel Skill Generator
Read this channel's public videos and transcripts, and download a writing brief for it.