Getting the transcript
Reading the captions from YouTube. A video nobody has opened here before takes 10 to 30 seconds; this page fills in on its own.
Getting the transcript
Reading the captions from YouTube. A video nobody has opened here before takes 10 to 30 seconds; this page fills in on its own.
The Simplified Trader · @thesimplifiedtrader
Words
3,505
Runtime
23:04
Speaking pace
152wpm
Reading time
15min
152 words per minute, below the 160 25th percentile of 349 measured videos. That distribution comes from the 349-video hook study.
Opening (first 30 seconds)
If I could go back five years and change one thing about the way I learned to trade, I wouldn't search for a better strategy, I would stop trying to make every time frame tell me everything because this is where trading becomes unnecessarily complicated. I'd look at the 4hour chart for direction. I would drop to the 1 hour chart and find something that made me question it. Then I would move on to the
76 words, the words spoken in the first 30 seconds at 152 words per minute.
Free, no signup. See how the first 30 seconds hold attention, with rewrites.
Sentence shape
| Measure | This transcript |
|---|---|
| Sentences | 250 |
| Average words per sentence | 14.0 |
| Longest sentence | 55 words |
| Questions asked | 3 |
| Sentences containing a number | 54 |
Most used terms
Filler phrases
19 in total: actually 9 · you know 6 · like 4.
A literal whole-word count of the same phrase list the Prepublish browser extension uses, so a phrase inside another word is not counted and a phrase used in its ordinary sense still is. It is a count and not a judgement.
What this transcript is
Every word below is the caption track YouTube publishes for this video, pulled from the video itself and reproduced unchanged. It is not Prepublish's writing, not a summary, and not a re-transcription: it is the video's own published captions. English captions, generated automatically by YouTube, in the video’s original language. Source: the video on YouTube. A channel that would rather this page did not exist can ask for its removal through the contact page, and it is removed.
No Script X-ray for this video: YouTube shows a Most replayed graph only once a video has enough views.
If I could go back five years and change one thing about the way I learned to trade, I wouldn't search for a better strategy, I would stop trying to make every time frame tell me everything because this is where trading becomes unnecessarily complicated. I'd look at the 4hour chart for direction. I would drop to the 1 hour chart and find something that made me question it. Then I would move on to the five minute and find an entry that made me change my mind again.
The more I learned, the more convincing I became at arguing both sides of the same market. What eventually simplified everything for me wasn't another indicator or another entry model. It was giving every time frame one specific job. In this video, I'm going to show you how I use one completed 4hour candle to tell me where price becomes interesting, the 1 hour chart to tell me where I can actually have a condition worth trading, and only then on the five minute time frame to tell me when I'm allowed to execute.
But the entry isn't the most important part because once you understand the sequence, you'll also know exactly when not to trade. And that's the part I want you to see on the real charts later on. First, I need to show you why the way most traders use multiple time frames creates the problem in the first place. Look at what happens when every time frame is allowed to answer every question. I open the 4hour chart and ask it for direction, confirmation, and execution.
Then I move on to the 1 hour time frame and ask the same three questions again. Then I reach the 5 minute and effectively start the entire analysis again. The problem isn't that any of those time frames are useless. The problem is that none of them has a clearly defined responsibility. So instead of the lower time frame making the decision more precise, every new time frame introduces another opportunity to contradict the decision I have already made.
I want to reverse that. I want every move down in time frame to leave me with fewer decisions, not more. So for this strategy, the 4hour time frame has one job, location. The 1 hour chart has one job, condition, and the five minute chart has one job, execution. That's the hierarchy we're going to build everything around. And notice that I still haven't told you where to enter a trade. That's deliberate because before an entry matters, price needs to reach somewhere worth trading from.
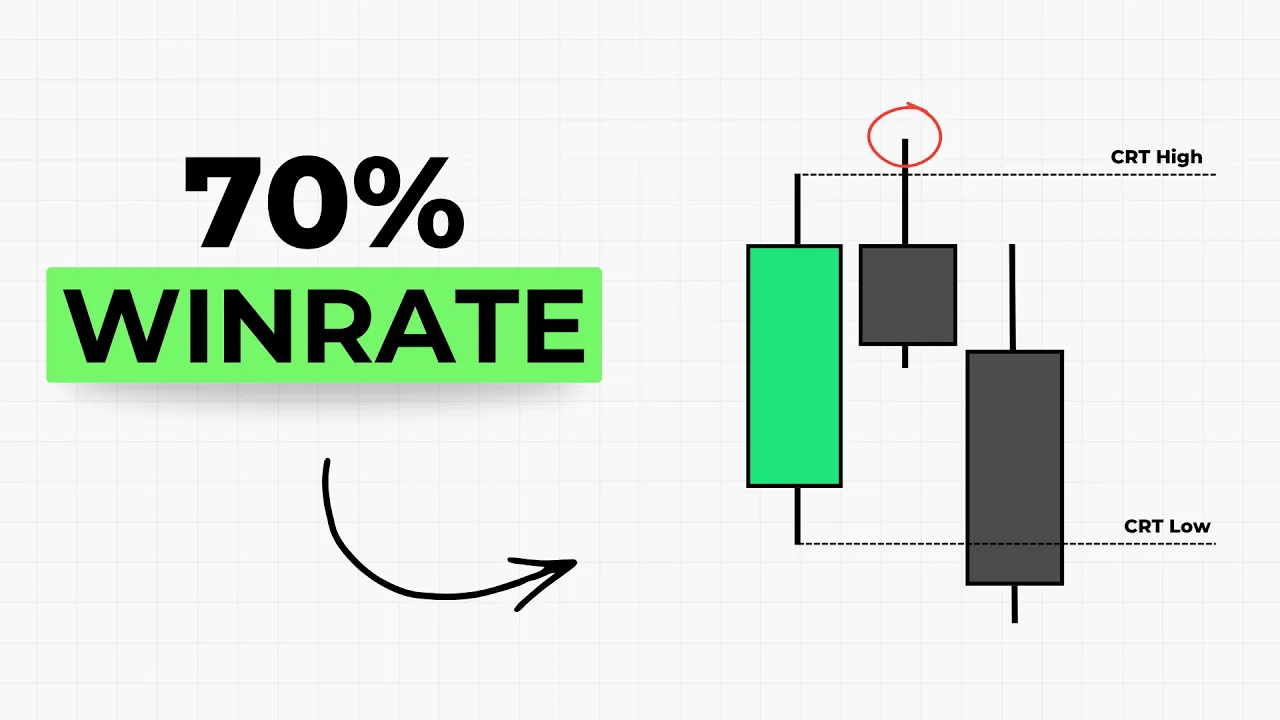
So the first question we need to answer is simply where does price become interesting. This is where the model begins. I am using the previous completed 4hour candle which is for the setup we're looking at here is the 1:00 a.m. to 5:00 a.m. Eastern Standard Time candle. Once that candle completely closed, I mark two prices. It becomes my CRT high and its low becomes my CRT low. And those two prices define the range I am now interested in.
That immediately changes the way I look at the chart because I no longer need to treat every movement as a potential trading opportunity. If price is moving around without interacting with either CRT boundary, the first stage of my model hasn't happened. I'm waiting for price to run one side of this range. If price trades through the CRT low with the possibility of a bullish setup begins to form. If price trades through the CRT high, the possibility of a bearish setup begins to develop.
But be careful here because this is where it's very easy to learn half of CRT and start taking trades too early. A run of the boundary is not my confirmation. All it does is get my attention. And that's the difference between those two things. Attention and confirmation is what the 1 hour time frame is going to solve. Let's start with the bullish side. Exactly as you can see it here. Price trades below our CRT low. That manipulation tells me that price has reached the location I was waiting for.
But I am not simply buying because the low has been taken. This is where a 1 hour time frame takes over. What I need now is a 1-hour candle to close back inside that CRT range. So the sequence is very specific. price runs the CRT low and then the 1 hour time frame closes back above that boundary and inside the range. Only now does that bullish condition exist. And this sentence on the slide is probably the easiest way to remember the distinction.
The run gets my attention. The close gives me the condition. For the bearish model, I simply invert the logic. Price needs to run the CRT high and then I require the one hour time frame to close back below that boundary and inside the range. Run the high, close back inside. Now the bearish condition exists and this is where the structure starts doing something very useful for us. If the CRT low gets run, but I never receive the qualifying one-hour close, I don't need to spend the next hour staring at five minute time frames and bullish setups trying to decide which one looks best.
I haven't earned the right to look for an entry yet. The same applies if the CRT high is taken and the one hour condition never occurs. That means the lower time frame is no longer there to create trade ideas. It only becomes relevant after the higher time frames have already done their jobs. And once the location has been found and the condition has been confirmed, look at how little is actually left for us to decide.
By the time I reach the 5-minute chart, two major decisions have already been made. The 4hour time frame has given me the location. The 1 hour time frame has confirmed the condition. So I'm not dropping onto the 5 minutes and starting my analysis again. I'm arriving there with one decision left. Execution. Let's continue with the bullish model. We've run the CRT low and received the 1 hour close back inside the range.
Now I move on to the five minute time frame and wait for a bullish change in the state of delivery or a CISD. Once I receive that bullish CISD, the sequence is complete and I can execute. My stop goes beyond the relevant CISD low and my primary target is 2 R. The opposing CRT boundary remains the broader structural objective for the bearish model. Nothing about the decision process changes. Price runs the CRT high. The 1-hour candle closes back inside.
I move onto the five minutes and wait for a bearish CISD. Once that occurs, I can execute with my stop beyond the relevant CISD high. And again, my primary target is 2 R. Now, think about what we've actually done here because this is more important than memorizing another entry pattern. We've started with an entire chart full of information. The 4hour time frame reduced that down to where I care. The 1 hour time frame reduced it even further to where I have a condition.
And by the time I arrive on the five minutes, I'm not analyzing the market from scratch anymore. I'm waiting for one specific execution. That's why this becomes simpler as we move down through the time frames rather than more complicated. But there is one final missing piece I need to show you before the real trades. Because a complete trading strategy cannot only tell you when to enter. It needs to make it equally obvious when the trade doesn't exist at all.
There are three places where this sequence can break. The first is simple. No CRT boundary run. If price hasn't run either side of the range, then the 4hour location hasn't produced what I'm waiting for. I don't skip ahead. The second is no qualifying 1hour condition. Price can run the CRT low or the CRT high, but if I don't receive the required 1 hour close back inside the range, manipulation alone isn't enough. Again, I don't skip ahead.
And the third is no aligned 5 minute CISD. I can have the 4hour location. I can have the one hour condition, but if the five minute execution never confirms, there is no entry. This is the rule I want you to carry onto the live charts. If the sequence breaks, the trade does not exist. And that doesn't does something important for your decision-m. It means patience is no longer this vague instruction to sit on your hands and somehow be disciplined.
You know exactly what you are waiting for. If I only have location, I know I need condition. If I have location and condition, I know I need execution. But if I have all three, I know exactly how the trade is structured. There is no need to compensate for a missing part because the se of the sequence by adding another indicator, another confirmation, another reason to convince myself that I should be in the market. Now, if I stop the video here, this would still just be a clean framework on five perfectly designed slides.
And that's not enough. Almost every trading strategy looks convincing when somebody can choose the candles, draw the arrows, and show you the outcomes afterwards. And now we're going to remove the diagrams completely. And I'm going to go to the real chart. I'm going to hide as much of future price action as possible, and we're going to make these decisions in the order they would have actually happened when they were traded.
We'll start with a valid setup and I'll show you exactly the same framework once we get to a bearish setup. And finally, I'll show you a setup that looks tempting but never earns the trade. That's where we'll find out whether this framework actually makes the chart simpler. But before I show you this framework on the real charts, I want you to think about something. If this already feels simpler than the way you've been trading, imagine what your trading could look like if your entire process was built this way, not another strategy saved in a folder that you're all the place next month.
One methodology that you can understand deeply enough to open your charts and know where you're interested, what you're waiting for, and when you're allowed to execute, and when you should do absolutely nothing. That is what I've built the mentorship to teach. Because the goal isn't for you to spend the next five years doing what so many traders do, learning another strategy, changing your model after a losing week, adding another confirmation, watching another 100 videos, and constantly feeling as though the answer is still one concept away.
I want you to get to the point where trading feels structured. You open the chart with a process. You know what matters. You know what doesn't you understand why you're taking the trade before you take it. You know exactly what to do when you're wrong. You know exactly what to do when you're right. You know what to do when your conditions are met. That level of clarity is what I am teaching in the program. And this is where the mentorship goes so much further than I can realistically take you in one YouTube video.
You get the complete methodology and structured education. But more importantly, you get to trade live with me every single day during London and New York sessions, both CFDs and futures. So, you're not only studying setups after the outcome is known. You're watching the methodology being applied while the candles are actually forming. What I'm looking at, what I'm waiting for, why I'm interested in one opportunity, and why I'm completely ignoring another.
But their objective is not to make you dependent on me. It's quite the opposite. I want you to build a trading process that eventually becomes your own where you can sit down at your charts, follow your methodology, and make your own decisions with structure and defined risk. So, if you are tired of constantly searching for the next strategy and you're ready to put that energy into actually mastering one methodology, join us inside of the mentorship.
That link is in the description box below. Go through the training, bring what you've learned into the live sessions, ask questions, review your execution, and start building the process you actually want to be trading a year from now. Here we are on our first example and this will be on gold. Again, we start on the 4hour time frame and we look at that 1 to 5:00 candle or 2 to 6:00 candle depending on daylight savings time.
What do we do? We go ahead and we mark out that candle low and we mark out the candle high. Now, in this example, we can clearly see this market is bearish and we have a bearish candle closure at 2:00. So, we can anticipate 6:00 to trade lower, but we stick to the rules and we follow the system. Now, that is everything I need you to do on the 4hour time frame. Now, we go to the 1 hour time frame and we wait for a run of that high or a run of that low.
Just going to drag these levels across and we can see we have our CRT. Now, we are waiting for the low of the high to get taken. And as soon as that happens, we run the low. But what's important here, we don't close outside of this range low. We actually close back inside the range. And that is exactly what I want. So again, we are waiting for that hourly candle to run the low and close back inside. So we're not trading this candle.
We are trading the following candle. And that is where I go to my fiveminut time frame. And this is where I'm waiting for a change in the state of delivery. It is just an order block being formed. And we can see here we run liquidity, we run a swing low plus we run a small fair value gap. So as soon as I get a closure above this down close candle, that becomes my autoblock formation and that is where I will take my entry.
So as soon as we get that closure above that confirms my order block and this is where I can market execute. You can also take a retest of that CISD or that order block level. For me I prefer market executions but both will be fine. Stop loss covering that order block low. And again what's my first target? It's going to be 2 R. So here we have the trade. We can then extend this out to that range high because we have very nice equal highs for a 2.4R.
And then we can also go ahead and take an entry on the retest. And we can see how very quickly a 2 trade becomes a 4R position. And this is realistically how you can improve your reward to risk ratio. We can see we then expand higher and we hit that range high for a 4hour takeprofit or if you took a market execution it's a 2.41 take profit. If I go back to my 1 hour time frame we can beautifully see how that range was manipulated and we expand to the high.
And again, if you look at this on the 4hour time frame, we can just see that beautiful candle range theory playing out. Here we have a bearish example on GBPUSD. Again, we are starting on the 4hour time frame and we have that 1:00 till 5:00 4hour candle. Now, I want you to go ahead and mark out that candle low and I want you to mark out that candle high. that becomes my CRT high and my CRT low. If we look at this market, it is very clearly busy in an uptrend.
So we will we are taught to trade with the trend but you will very quickly find markets and trends being manipulated and trading reversals often give better entries. So again we are sticking to our process. We are sticking to our rules. We go ahead on the 1 hour time frame. Here we have that high and that low and we are just going to be waiting for price to run either side of this range. Looking at this, we can see that we run the high, we close back inside that range high.
So from 6:00 onwards, I am looking for a bearish change in the state of delivery on the fiveminut time frame. So here on the 5m minute what I'm waiting for now is very specific. I'm waiting for a bearish order block to form. So I want to see price close below bullish candles. At the moment that happens when I close below these two up close candles that becomes my order block and that is what I will be waiting for. So, I'm just waiting for price action to go ahead and close below those two up close candles.
What happens here? We do get that run through. As a bonus, we run into fair value gaps on the way up. This becomes my entry. My stop loss covers the order block high. And in this case, we can see that targeting the range low gives me a not so favorable reward to risk ratio. So in a case like this, I would just extend it till 2 R and leave it fixed at 2 R. So this would then become my trade. Remember we have manipulated that London kill zone high that is at 1:00 till 5:00 4hour candle that is London kill zone.
That is why this model is so powerful because we are trading reversals off of timebased liquidity and we just let this market do its thing. We do experience a deep draw down but we place our stop in a way that we can stay safe if the market tries to run against us and then eventually we do go down and we do hit full take profit. For our final example, we are here on ENQ and I want to show you an example of where a trade would not be valid.
So again, like we do always, we have that 1:00 4hour candle. Don't mind if this is 2:00. It's just daylight savings time. So 2:00, 1:00, 4hour candle. I want you to go then mark out that candle low and mark out that candle high. There's nothing complicated about this. Now we go to the 1 hour time frame. And again nothing complicated. We are just waiting for price to run the high or run the low and close back inside. That is all that we are waiting for.
And we can see we do run the low. We never get that close inside. And then price just starts running away. Now before you leave, forget the individual trades for a moment. And remember the hierarchy. The 4hour tells me where the previous completed 4hour candle gives me the CRT range. And I'm waiting for the one of those boundaries to get manipulated. The one hour tells me when the condition exists. Run the CRT low, close back inside.
I have a bullish condition. Run the high, close back inside. I have a bearish condition. And the five minute tells me when to execute. I wait for an aligned CISD. My stop goes beyond that relevant CISD high or low. and my primary target is tor while the opposing CRT boundary remains the broader structural objective. That is the model. But the bigger lesson is the one I wish I'd understood much earlier. When I'm on the 4hour time frame, I am not worrying about my entry.
When I'm on the 1 hour condition, I am not searching for a five-minute chart trying to anticipate it. And when I finally reach the five minutes, I'm not trying to decide whether I should be bullish or bearish, that work has already been done. That's what makes this framework so simple. Not fewer rules for the sake of having fewer rules, fewer decisions at each stage. And if this video changed the way you think about multiple time frames, subscribe because this is exactly what we're going to keep building on.
Taking trading concepts that are usually made unnecessarily complicated and turning them into structured decision-making frameworks that you can apply. As always, I hope you enjoyed the video. If you did, leave a like, leave a comment, and I will see you in the next one.
The words are the caption track's own and nothing is reworded or re-transcribed. Paragraph breaks are placed between sentences so the text reads as prose.
Free tools for your own script. No signup, no login.
Paste your draft and see where viewers are likely to drop off, with a rewrite for each weak line.
Paste the first 30 seconds of your own draft for a hook score and rewrites.
Check your draft against YouTube's advertiser-friendly guidelines before you record it.
Read this channel's public videos and transcripts, and download a writing brief for it.