Getting the transcript
Reading the captions from YouTube. A video nobody has opened here before takes 10 to 30 seconds; this page fills in on its own.
Getting the transcript
Reading the captions from YouTube. A video nobody has opened here before takes 10 to 30 seconds; this page fills in on its own.
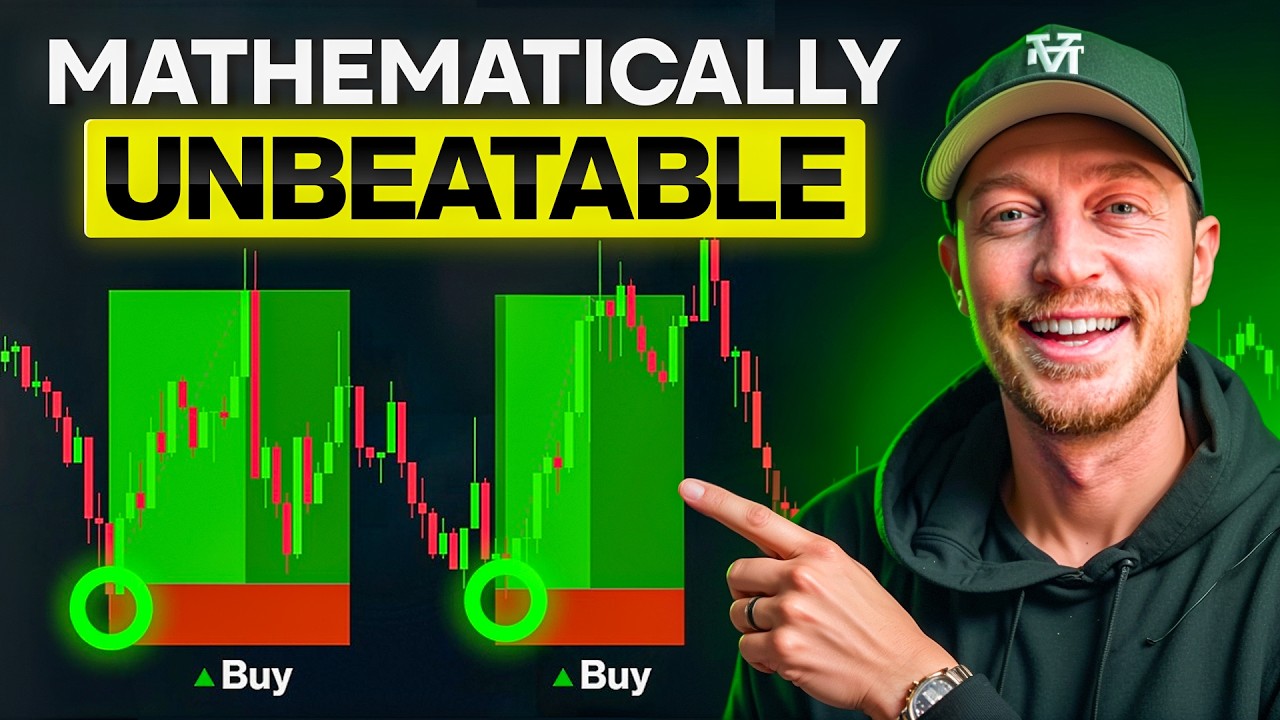
Trade with Pat · @TradewithPat
Words
3,011
Runtime
15:57
Speaking pace
189wpm
Reading time
13min
189 words per minute, between the 181 median and the 201 75th percentile of 349 measured videos. That distribution comes from the 349-video hook study.
Opening (first 30 seconds)
Once you understand what price is actually telling you, [music] trading becomes almost too easy. Most struggling traders think they need to add another indicator, another strategy, or more analysis. But after 18 years of trading, my biggest breakthrough came when I stopped trying to predict the market and started reading what the price was actually showing me. I trade live in front of a 100,000 traders each week. [music] And right now we're sitting at 36 wins and just five losses. Those results come from understanding market structure, trend, momentum, and the key levels
95 words, the words spoken in the first 30 seconds at 189 words per minute.
Free, no signup. See how the first 30 seconds hold attention, with rewrites.
Sentence shape
| Measure | This transcript |
|---|---|
| Sentences | 248 |
| Average words per sentence | 12.1 |
| Longest sentence | 62 words |
| Questions asked | 29 |
| Sentences containing a number | 14 |
Most used terms
Filler phrases
36 in total: right? 13 · like 8 · actually 7 · kind of 5 · you know 2 · basically 1.
A literal whole-word count of the same phrase list the Prepublish browser extension uses, so a phrase inside another word is not counted and a phrase used in its ordinary sense still is. It is a count and not a judgement.
What this transcript is
Every word below is the caption track YouTube publishes for this video, pulled from the video itself and reproduced unchanged. It is not Prepublish's writing, not a summary, and not a re-transcription: it is the video's own published captions. English captions, generated automatically by YouTube, in the video’s original language. Source: the video on YouTube. A channel that would rather this page did not exist can ask for its removal through the contact page, and it is removed.
No Script X-ray for this video: YouTube shows a Most replayed graph only once a video has enough views.
Once you understand what price is actually telling you, [music] trading becomes almost too easy. Most struggling traders think they need to add another indicator, another strategy, or more analysis. But after 18 years of trading, my biggest breakthrough came when I stopped trying to predict the market and started reading what the price was actually showing me. I trade live in front of a 100,000 traders each week. [music] And right now we're sitting at 36 wins and just five losses.
Those results come from understanding market structure, trend, momentum, and the key levels where buyers and sellers step in. In this video, I'll teach you exactly how I read price action, and later I'll show you some live trades. So, smash that like button, subscribe to the channel, watch the disclaimer, and let's jump right into trading results. This is a member's live trading account using my trading system. It started on July 1st and it just broke 1,000% with the entire result being verified live on my FXbook.
And here is one of my own live accounts from this past week. These performance numbers are verified, but past performance does not guarantee future results. Now that you've seen these concepts applied to real verified accounts, let me teach you price action from the perspective of an 18-year trader. And later in the video, I'll show you some live trades. But first, if we want to read price action, we need to identify the trend.
Now, before we hit the charts, know that I'm using my price action trading concepts on all of these assets, gold, Bitcoin, oil, forex, futures, everything. And I'm trading them predominantly in the London and New York sessions. Every day before I take a trade, the first thing I look for is an obvious trend because I always want to trade in the direction the market is already moving. I establish the trend by spotting a 1 2 3 move in the markets.
An impulse, a pullback, and another impulse that breaks previous structure. This one, two, three move establishes that the buyers are in control of the market. So, what should I be doing next? Well, I should be looking for buy trades. I can set up a level of demand down here. And I can set up a flip zone right here, right at the previous high that was just taken out by this price move. Then I simply wait for the next pullback to come to either of my levels where I could consider getting into a buy trading position.
Now, before I get ahead of myself, don't worry. I will teach you all about these points of interests, where I get into a trading position in step three further in detail. So now we can see price push up and smash our takerit right there because we traded with the trend. Now what do we do if price pulls back to this level again? Well, you can see we had another break of structure right here. So we are still in that uptrend.
So we can actually take another buy position right here. And if you come to the left side of your screen here and you take the Fibonacci retracement tool and measure it from the bottom of the recent move up to the top, you can see that this recent retracement right here is a very deep pullback almost to 100% and anything that is below 50% is considered a discount in price. Obviously, we always want to enter our trades when price is discounted.
Now, this time it's a little bit different because you can see price pushed up and it didn't actually hit our takerit and we didn't get a break of structure either. So, what are we doing here? Should we panic? Should we close out the trade? No. As long as price doesn't close beneath this level right here, right? As long as this price doesn't close beneath this level right here, then we should stay in the uptrend and not have price go against us here.
So, we hold strong. We let the position play out. And inevitably here it smashes our takerit. So even though our first move up here didn't hit our takerit, as long as it didn't close beneath this level right here, it's actually just an extended pullback. So instead of the pullback just being kind of this short little move we see here, the pullback is actually all of this right here. By now, you could see how trading with the trend helps me consistently win trades like these.
But before I jump into the sell example, I want you to tell me something you're working on with your trading right now in the comments for your chance of winning one of six free spots in my VIP trading room. Now, let's get into the sell example. We have our 1, two, three move right there, establishing the downtrend. Maybe we mark out this swing low right here, this level of support, flipped resistance, and pull that across and we consider getting into a sell trade at that level right there. smash our takerit.
Now, as we continue this trend along, you can see we make a low here, we make a new high here, and then look, the swing low right here doesn't get taken out, and then price pushes all the way up here. And this is now step two, trend reversals. It's important to understand when the trend is reversing. So, I'll explain it very simply. We've got a swing low, a swing high, a swing low, a swing high, a swing low. We make our new swing high.
We come down here and we don't take out the previous swing low right here. Right? We don't take it out, right? Price does not come below that level and take it out. Instead, price reversed up here. And when it reversed up there, what happened? We took out the previous high. We took out the high. And as soon as that level is taken out right here, some people would say this level right here. Either way, the downtrend is now over.
We are reversing. We are now in the uptrend. And if you want, you could swing this zone all the way across right here. This level that was used as resistance here can now be flipped back to support and used for buy trade opportunities because the trend has reversed. It is no longer in the downtrend. It is now in the uptrend because we took out this high when this candle right here closed above it. And so now we know we want to buy in the uptrend, we want to sell in the downtrend, and we want to keep our eye out for these reversals so that we're always on the right side of the market.
But where are we placing our trade? What's the point of interest? Where do I draw these boxes to take buys and sells from? Well, that's step three, and let's get into it right now. Now, I'm going to show you the main areas I enter trades every single day with three trending examples and one reversal example. So, first let's take a look at our 1 2 3 move right here. This establishes our uptrend. And then we're looking for our point of interest.
So, my first point of interest would be a level of demand. Okay, a level of demand, institutional demand is when I see a bunch of huge green candles in a row pushing the price up because only institutions can push the price up this aggressively. I want to see the creation of fair value gaps. These are candles with huge imbalance. There's no wick coming down on this candle. There's no wick coming up on this candle creating a huge imbalance here.
That tells me we have institutional demand. That means smart money likes this level. I also need to see the break of structure. So this move up needs to continue with the trend. Then I will wait for price to come back to that level of demand because the smart money pushed the price up. they should like that price again. That's where I'll take the position from. I'll put my stop loss below the level of demand. Generally, I will target either this level or the highest level and then smash my takeprofit.
Now, I need additional confirmations when we get to the zone and that's what will be covered in step four. So, that's demand. Let's go through supply. Same thing, right? Push down, pull up, push down. What's that? That's our one two three move and then price pulls up to our level right here. Now we get this big push down right there. 1 2 3 four five red candles in a row. That creates a level of institutional supply. Same thing as demand.
This is not a perfect example. I don't have a fair value gap. Ideally, we want to see a fair value gap, but it's the same concept. We're in the downtrend. Price pulls back to our level of supply. We get into a sell position here. We target recent price action right here and smash the takerit. So, we've got demand, we've got supply, and we have the same thing here, right? Push up, pull back, push up, right? That's our 1 2 3 move, right?
Impulse, pull back, impulse. Now, on this position, we have a very clear level of resistance. Price comes up to the level here and here and here. And each time price pushes down, pushes down, and then a weak push down right here, telling us this level's likely to break. And when that level does break right here, this level of resistance now becomes a level of support. I like to enter here on a level I call a flip zone.
We are in the uptrend. We face resistance. We break through the resistance and then we retest the level right here. Just like that, a easy flip zone. We get into the trade. That is another point of interest I use on stream every single week. Price is in an uptrend. We make a low. We make a new high. We come back to that low. We fail to make a new high. And then we break through that level aggressively. What do we have right here?
We've got a level of support and then it flips to resistance. So, this is my reversal flip zone. And I can get short from this area right here. Target a big chunk stop loss above maybe a recent wick, something like this. And we're getting that trend reversal. Basically, we're in the uptrend and then what happens? Price can't make it any higher. It comes below, comes back to that level. That's the flip zone right there and I go short.
Okay, those are the main levels I'm taking trades from every single day. But what do I do when price comes to this level? What do I want to see to actually execute the trade? I'm going to show you right now in step four. Now, before we get into the live trades, I'm going to show you just two confirmations, things that I look for when price comes to my level of interest. So, right here, we have our one, two, three move establishing our downtrend and we have a flip zone as our point of interest.
So, we want to go short here, right? We're in a downtrend. We've got a nice looking flip zone. Price is approaching it. What am I looking for? I'm looking for this exact scenario. I'm going to show you right here. You see price wicks into the level and then that candle closes. That's what I want to see. Okay, price wick into the level and then closed beneath the level. Right, the wick came in and it closed beneath. That is confirmation that my level is good.
Okay, that is enough for me to enter the position at the closed candle or sometimes after the candle closes, I'll wait for price to tap the level one more time. Once I get that tap, I'll be into my trading position right there. Then price can start to push down and smash my takerit. Now, let me show you my second confirmation. This time, we've got a level of demand, right? It's not a flip zone. Price pushed up aggressively here, telling me that the smart money's at this level right here.
But we've had these huge red candles come down. So, I've got to be really careful with what I do. So, I need to see a good reaction at this level. What I want to see is a bullish engulfing candle pattern. So, we have the first bearish candle, that's the red candle, and then the next candle right here engulfs it. So, we've got the smaller candle and then the bigger candle right there engulfs it. This is a bullish engulfing candle pattern.
And what I'll do is I'll either enter here as that's the confirmation that I want to get into a buy trade or I will enter still in my zone waiting for that retest. And so price can come back to that level, tap me into the trading position, push up and smash my takerit. Now, sometimes if you watch me on stream, I will just take the trade. I use my gut. I believe in my level, and that's something that comes with 18 years of trading experience.
So, I don't expect you to be able to do that. But I want to show you some of those live trades right now to prove that I'm using these price action concepts in my streams every single day with an over 80% win rate. But before I do, if you're looking for a place to trade, check out Risen FX. They're my favorite broker right now. I have multiple withdrawals already. I've got another huge withdrawal coming. The spreads are low, the commissions are low, the executions are great, and it's the best platform to trade.
So, click the link in the description. Registration is free and let's get into some live trading. Now, let's do a live trade example from my stream. Obviously, I have tons of VIP trades I could show you as well. Links in the video description if you want to join VIP. But, I'm going to show you a trade that didn't even go that well because I don't want to cherrypick the trades, right? So, you can see we have our 1 2 3 move right here.
That's establishing the downtrend, right? We've got the impulse, we've got the pullback, and then we have the next impulse that is breaking structure. So obviously I'm looking for sell positions on this one. I was looking at this level right here. Okay, this is a bit of a supply zone. That was our swing high here. And I also marked up another level of supply up here just in case I was going to look at that level later in case this level didn't work out and price came up here.
Maybe I would re-enter. You'll have to check out the live streams to learn a little bit more about my management. So, as I zoom in a little bit here, you can see we had the bearish engulfing candle pattern right here off of my zone. And I like that, but the candle came too far. So, I still waited for a retracement. I decided to put that kind of right in the middle of the supply. So, I was entering the trading position right there.
Okay. My hope is obviously that price would come to this level and slam down immediately, but in live trading that doesn't always happen as I'm sure you know if you watch my live streams. So you could see here price pushed up and I tapped into the trade and it started to go against me a little bit here which was a bit concerning especially when we had kind of this break of structure right here with these candles closing above.
But at this point you know I'm into the position. I'm not just going to bail out. I don't bail out on my trades. I believe in the process. And so I continued on with the trading position and then price pushed down and did smash my takeprofit here inevitably. And you can see I was targeting this recent level right here. Be a small level of demand and I expected maybe a reaction off of that level. And you can see we did react off of that level and came up.
So it was a good idea to target that area. And if we scroll out like there's a bunch of trades. Maybe I could show you kind of a flip zone trade. Very very similar. Right? You can see we're kind of we're in that downtrend. Right? We've got our one two three move. We have the level of support. Okay? We broke through the level of support. Then we use it as resistance. I entered the position right there at the top of that level.
Price pushed down, smashed my takerit. Honestly, there's too many trades for me to show you. So, that's my price action trading strategy. I use price action every single day. I hope that you use price action in your trading now, too. Understand the trend. Watch out for reversals, get a point of interest, get the confirmation, and hopefully win your trades. If you want to trade with me, the links are in the video description to my VIP room, to my trading robot, to the broker where I trade.
And I'll be back next week. Much love. Oh.
The words are the caption track's own and nothing is reworded or re-transcribed. Paragraph breaks are placed between sentences so the text reads as prose.
Free tools for your own script. No signup, no login.
Paste your draft and see where viewers are likely to drop off, with a rewrite for each weak line.
Paste the first 30 seconds of your own draft for a hook score and rewrites.
Check your draft against YouTube's advertiser-friendly guidelines before you record it.
Read this channel's public videos and transcripts, and download a writing brief for it.