Getting the transcript
Reading the captions from YouTube. A video nobody has opened here before takes 10 to 30 seconds; this page fills in on its own.
Getting the transcript
Reading the captions from YouTube. A video nobody has opened here before takes 10 to 30 seconds; this page fills in on its own.
The Inner Circle Trader · @InnerCircleTrader
Where viewers went back to watch this video again, from YouTube's public Most replayed graph, lined up with what was said at that moment.
Most replayed moment #1
51:503.7x the video's typical replay level
Okay? So, now we have two points of reference. Now, when I have this like that, I have two little sweet spots in the previous day's range and to the left of that, why? Cuz we're going to go back 3 days.
Said at 51:44
Most replayed moment #2
54:493.4x the video's typical replay level
Okay, this is a high probability draw. So, the bulk of the the consolidations or bodies will probably respect something like this. Or it could be just the very extreme, okay? And
Said at 54:43
Most replayed moment #3
57:123.3x the video's typical replay level
information here. Now I know some of you are like, "I'm not going to do all this. I have I have no con- I have no interest, no concern for it, none of it. I'm not going to do it." And there that's that. We can take the full range from that candlestick away and there's there's our
Said at 57:06
The graph counts replays. It does not show where viewers stopped watching.
Words
9,251
Runtime
59:34
Speaking pace
155wpm
Reading time
39min
155 words per minute, below the 160 25th percentile of 349 measured videos. That distribution comes from the 349-video hook study.
Opening (first 30 seconds)
Good morning folks. Happy Saturday morning. All right, so the market is closed as you can see. 8 hours before we open up again. So, hope you're doing well. Hope you're in good health and good spirits. Hope you had a wonderful week and you learned something and I'm going to explain a little bit further. Um, before I get into it, just give me a moment to explain something. Uh, yesterday I was waiting for my wife
78 words, the words spoken in the first 30 seconds at 155 words per minute.
Free, no signup. See how the first 30 seconds hold attention, with rewrites.
Sentence shape
| Measure | This transcript |
|---|---|
| Sentences | 849 |
| Average words per sentence | 10.9 |
| Longest sentence | 88 words |
| Questions asked | 143 |
| Sentences containing a number | 85 |
Most used terms
Filler phrases
114 in total: like 42 · you know 21 · uh 12 · right? 11 · kind of 8 · um 8 · I mean 5 · basically 4 · actually 2 · literally 1.
A literal whole-word count of the same phrase list the Prepublish browser extension uses, so a phrase inside another word is not counted and a phrase used in its ordinary sense still is. It is a count and not a judgement.
What this transcript is
Every word below is the caption track YouTube publishes for this video, pulled from the video itself and reproduced unchanged. It is not Prepublish's writing, not a summary, and not a re-transcription: it is the video's own published captions. English captions, generated automatically by YouTube, in the video’s original language. Source: the video on YouTube. A channel that would rather this page did not exist can ask for its removal through the contact page, and it is removed.
Good morning folks. Happy Saturday morning. All right, so the market is closed as you can see. 8 hours before we open up again. So, hope you're doing well. Hope you're in good health and good spirits. Hope you had a wonderful week and you learned something and I'm going to explain a little bit further. Um, before I get into it, just give me a moment to explain something. Uh, yesterday I was waiting for my wife to come home and she was out and about.
And rushed to get through the review yesterday. And I had a distraction during the recording. And then I lost my train of thought. >> [laughter] >> So, I've done this before in live streams, but um it's it was a rarer thing for it to occur in a recording. So, anyway, my wife stopped and visited our new nephew and failed to send a text message let me know what was going on. And for whatever reason her phone service doesn't pick up well in hospitals.
So, even if she would have text me, I don't think I would have gotten it. So, anyway, I hung out with the traders round up. Got a little bit of the the things off my chest that I planned on doing today as a shotgun Saturday. So, I appreciate all of y'all let me voice my concerns and and and emotions basically about uh managing students and the things they go through. It it weighs on you after a while, you know, even if you are callous in the beginning, you know, if you if you keep hearing about it, you know, people struggling in the world and and things that go awry when even when success enters, it's just it's it's hard.
It's hard to pretend that doesn't exist or ignore it. So, anyway, anyway, >> [laughter] >> the the one minute chart here, we're going to go right into that. And I want to kind of like go through a certain number of points I made in yesterday's review that I didn't really efficiently explain or adequately explain. I got a few questions. People were posting some things about the certain characteristics saying that you didn't know the low was going to be there and how would you know this.
I stated a very specific reference in time. Okay, so I'm going to make it very plain and simple for you because we're dealing with time-based ranges where it begins at a specific time, it ends at a specific time, just like a session, just like a trading day, like regular trading hours. It has a beginning time and it has an ending time. It's very specific. It's finite. It's I mean it's ambiguous. It's not ambiguous, rather.
It's very specific. So, if there is an algorithm, okay, now I'm going to speak in those terms cuz I know some of my audience just can't subscribe to that idea. If there were an algorithm, wouldn't it operate under the framework upon which it collects its data from a defined range? And where would that data come from? A beginning point and an ending point during market hours. Since 9:30 opening Eastern time is the regular trading hours opening range, beginning of that new regular trading hours session, we have to pay attention to what's going on just before that 9:30.
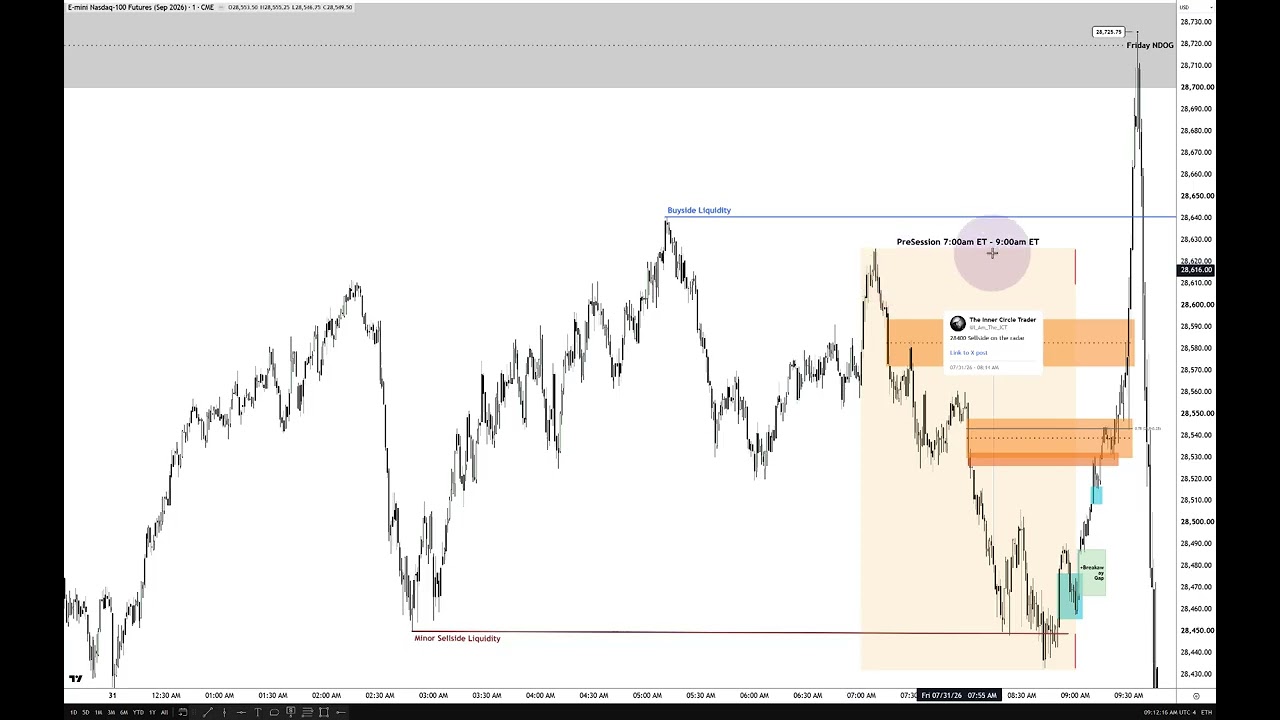
And I've been teaching for decades about the 2-hour window right before 9:30 opening. Specifically, the pre-session, 7:00 a.m. Eastern to 9:00 a.m. Eastern. You can make the entirety of your career just focus on that little time window of 2 hours. You don't need to do anything else. No other sessions. You don't even need to trade 9:30 opening or the a.m. session. You don't need to do the p.m. session, London, Asia. You don't need You don't need to do any of that.
If those 2 hours are hours of the day that you can operate under as a trader. But, I'll leave that up for you to determine, okay? I'm not trying to push it or sell it too hard. There are times when that 2-hour window is advantageous to be a participant in, and then there's others where based on what it's showing you, it's going to lead to a very wonderful, eventful driven morning session. Okay, so I've talked in at nauseam all those specific characteristics, but I want to kind of clear up the confusion that some of you experienced in yesterday's review.
So, let's let's begin with uh We'll add the level here. That's an old low. You can see it. Look back there. That's those relative equal lows I talked about yesterday. Even though that low was there, my eye originally jumped right to this. I wasn't planning on doing anything on Friday. I didn't want to trade. I was going to just do a 3-day weekend, and that was it. But, uh I was inspired. >> [laughter] >> Let's say it that way.
And I decided I was going to go out and, you know, short the daily high. So, if we go and look at this tweet right here, That was posted at 8:14 a.m. Friday. The 31st of July 2026. And it was me. Recognizing at that moment. Still laying in bed. Thinking to myself, you know, let's take a look at the market and. That's what I was looking for. There's relative equal lows that I just noted. And if we add. This. Buy side imbalance sell side inefficiency.
I'm going to add the lipstick. This is what you usually see me doing. Okay, as as prices meander around. Uh. The sequence of me deleting things and coming back with control D to bring it up. So I see myself some time here and not draw them out in front of you. I forgot to add. Or delete this one. I deleted the uh. Inversion fair value gap. You'll see it in a moment, but right now we'll just leave it there. Okay. I was trying to figure out how I can get around that and I'll just leave this as an unedited area.
Buy side imbalance sell side inefficiency here. Trades down here and it rallies up. And. Right here we have a breakaway gap. And we have a small little buy side imbalance sell side inefficiency in here. Trades to it there. Rallies up. We have a inversion fair value gap. Trades to it there. Straps to the upside. Then we have another inversion fair value gap. Right here. And look how it's gyrating around its midpoint and finally it goes to the upside.
Comes back down. Buyers are not allowed to go in the lower half now. Rally one more time. Trades into it there and it explodes to the upside. And we have another inversion fair value gap here. Builds up momentum right there on that candlestick low. And it rips up above the buy side liquidity. And after taking the minor sell side liquidity here. Okay. So, right away, you got to take your attention back to that little area right there.
Pre-session, 7:00 a.m. Eastern time, 9:00 a.m. Eastern time. It's a time-based range right for the regular trading hour session opens up. When we include that detail, and these two little red lines delineate upon which the very moment the very moment that the algorithm will refer back to this range where it will collect its data. So, buying and selling pressure is a myth. Okay? I have all kinds of people around the world.
Okay, some of them work in the financial industry. Some of them claim to be market makers. Some of them claim to be, you know, big wigs in the industry. Some of them are talking to you from the TV, right on the stock market floor. And they'll say these things are not really there. You're welcome to their opinion, and you can subscribe to that all you want. I'm not going to change the the tune I'm singing. Okay? I'm out here proving it.
So, it's not imperative that you view it my way. It's not imperative that you believe there's an algorithm. If you just look at this and say, "Okay, I'm just going to use this as a technical approach to doing it, and I'm not going to get out there and get in the argument and get caught up in the minutia of defending or arguing against the idea of an algorithm." That's the least important factor. The main thing is is I'm trying to teach you how to use these tools.
So, if you if it makes you feel more comfortable never referring to an algorithm that's controlling price, look at it as this is where the buying and selling pressure is going to end and start. >> [laughter] >> Okay? That way we can put this to bed and I don't have to beat up on everybody else's approach to trading. So, when we have this like this and we don't have a time based range that defines a specific dealing range, okay?
Any old range is is in and of itself not important. But, when we look at very specific time-sensitive ranges, then it means a whole lot. So, as I mentioned in yesterday's video, why didn't I talk back to this high? Why wasn't that important? Because it's not the time range I taught you between 7:00 and 9:00 in the morning. Inside this little shaded area, you went on the highest highest high and the lowest the low. And the the comments were saying, "You didn't know that low was there yet and it was going to not go any lower.
You didn't know that." What are you talking about? What's this little red line indicate right there? Right there. That's 9:00 a.m. That's the end of the 2-hour session of 7:00 a.m. to 9:00 a.m. What are you What are you talking about? You didn't know. You didn't know that range was there. What are you talking about? Everything shaded in that at box here, it's finite. Now we can start using this range and derive specific price points.
Okay? So, this is the multiplication table. Okay? The canvas at which we want to start looking for the horizontal price axis. Where the price is going to be. This is the time aspect. Okay? So, we have time. We're We're We're a sample set of all the data out of a particular trading day. Only 2 hours are here. Okay? And I'm not cherry-picking this. Students have been with me for a long time known for a long time that I've told you to focus between 7:00 and 8:00 and and 9:00.
So, 7:00, 8:00, 9:00, those 2 hours of trading it's a wonderful opportunity just for you to be a trader and be done, or you use it for key information that will warrant more attention on very price levels when time agrees with it. Now, I'll get into that, okay? So, if we then add the fib to that range. What I've done was I've taken the fib, I've anchored it to that low, and I've dragged it all the way up to that high.
That's the highest high. That's the lowest low between 7:00 a.m. Eastern time and 9:00 a.m. Eastern time. Not complicated at all, okay? Because I expected price to rally higher because it drifted lower all during the 7:00 a.m. the 9:00 uh session. And because I felt that 28,400 was going to get tagged, we've traveled a lot on the upside since FOMC. And it's Friday. They're going to do a deep retracement against that.
And it makes sense for it to rally up and take out that buy side here. And if you look at this high at 7:00 a.m.'s range to 9:00 a.m. range that's shaded in here, that high is slightly lower than that one. So, doesn't that make this relatively equal highs? Sure, it does. So, if we can go down and take out this minor sell side here, and then close the 7:00 to 9:00 a.m. time-based range. So now we have a very specific range upon which we can grade it.
Okay? So I'm going to show you I'm going to take the fib. Again, there is we're going to anchor right to the low and we're going to draw up to the high right there and drop it. Go into your fib settings. You should have a negative five. I'm sorry negative 0.5 right there. Watch right up here. Okay? See that? That price comes in at 28,723 even. I'll make the the text a little bit bigger you can see it. See it? Right there. 28,723.
That's a projected daily high. I did these things in forex when everybody claimed I was using a a rented white label broker where it's not even a real broker. You get to type in what your executions were. >> [laughter] >> You don't see me typing in new executions. You see me pressing the button and putting trades down on live data. Okay? So we're going to leave it like that. Okay, so now the Actually, I didn't include the other my levels today.
So now you want to leave azure lower quadrant upper quadrant octant octant octant and final octant. So now we have those those levels here. Okay, and I don't have the half level. There we are. >> Now it's complete. Okay? So now I walked you through the entire process so that way you can replicate this on your own chart. Okay? And now because of this, we can go and scrub on over to make the chart a little bit more friendly on the eye.
Now at this moment right here at the end of this Okay? At 9:01 any PD array that forms and anchored to Let me add the high and low. I'm sorry. I forgot that. There you go. It forms at one of these levels here the candlestick has to touch it. Lay across it or touch it. Okay? It has to have some reference point where it's tethered to these specific key levels. I don't care what you subscribe to or believe in. When you start looking at the market like this, when I give you very specific levels, when I give you very specific ranges to operate in you're going to find that there's Swiss timepiece precision there.
Now you watched me execute this short up here. You watched it. That can't be done with retail stuff. Okay? It can't be done. Nobody else's methodology expected a run starting here up to there and then aim for 28,400. It just It doesn't exist anywhere else. I know because I've studied everything else extensively. Everything else. You know, does that mean you should abandon what you're using and making money? No, no, no, no, absolutely not.
If you have something that makes money, wonderful. God bless you, and I'm thankful that you have that. I want all of you to be profitable, even if you don't use my stuff, but I just want you to to to explore some of the things I'm teaching because it may help you ferret out better trades that maybe your system might not do very very well with. And you'll get caught off side. Okay? So, again, I'm I'm not trying to be anybody's adversary here.
I want to encourage you to do well, and some of these things might be the very catalyst that turns it up a notch where maybe you've been just a break even trader using whatever you do, and then now, because what I'm teaching, it helps you frame a better bias, a better draw on where the market's likely to go, and it may filter out what you think you see in your chart saying it may go lower when it's likely to go higher, or vice versa.
So, all right, let's go through all this business. So, all right, 9:00, at 9:01, we have this candlestick right there. Okay? We are inside of this buy side imbalance sell side inefficiency. Okay? Remember, everything after 9:00, refer back to these quadrants, octants, and the high and the low of the 7:00 to 9:00 a.m. That's what I'm using. Okay? So, doesn't this form a buy side imbalance sell side inefficiency after 9:00?
Sure, it does. But now we have to look at where it is in deference to these levels. So, what I'm going to do is I'm going to take this and I'll extend it over a little bit so you can see how they overlap with those very levels. See the wrong wrong one. >> All right, I think this will accomplish the method. I'm just going to bring it past the the move to back back lower. All right. So, we're here. Price is anchored and tethered to the lower quadrant level of this range from low to high.
So, we've carried and brought these levels into the future. Okay, like an algorithm, like a computer program program, it'll use information of go back and cull information from a predetermined range of data. Okay? So, the array that it's referring back to is this particular price at 28,400.75. And its range will be defined by that candlestick that's tethered to that very one. And there's a volume imbalance. There's a volume imbalance.
So, that's the suspension block. Price can then be expected to rally higher. Why? Because we've already used this buy side imbalance sell side inefficiency and used it to start running here at 9:01. Inside this buy side imbalance sell side inefficiency, the price run begins 1 minute after close of that time-based range at 9:00 a.m. ending time. You think that's random? >> [laughter] >> It rallies higher, creates another buy side imbalance sell side inefficiency, which is a suspension block.
Now, we want to see this operate as a breakaway gap. We want to see it really rip higher and take out that short-term high. Does it? Yep, sure does. Now, we have this fair value gap. What is that anchored to? Where is it tethered? It's just out there in the middle of nowhere. Well, look at this candlestick's close. 28,508.50. So, this thing 8.5. The open on this candlestick is 509. So, it's two ticks higher. So, there is a volume imbalance there.
Whenever there's a volume imbalance, you have to include the volume imbalance candle where it has to be tethered to it. Very simple rule. Very, very simple. There's nothing complicated about that. It's very easy. The market trades down into it here, hits it, rallies higher. Now, we get to this level. See how we're anticipating? We're anticipating. We're not reacting. We're not hoping and praying. We're not shaking our head and our fists at the screen saying, "Why are you doing this to me, Nasdaq?
Why is the chop so real?" >> [laughter] >> Halfway point. Okay, so that's consequent encroachment of the range high and low between 7:00 a.m. and 9:00 a.m. Eastern time. We have this inefficiency in here. At midpoint, it was sell-side delivery. In other words, it was a down close candle and the way it was formed. So, that should act as an inversion fair value gap. And lo and behold, we get it. Then, right to the left of that, we have another one.
This is a inversion fair value gap. And originally, it was sell-side delivery. That means it was produced by down movement and a down close. This becomes the low of that candlestick, which is the open on this. Watch. Look at the open on this candlestick, right there. 28,530.00. Okay? This candlestick's low 28,000 529 even. So, it's only one point tapping into that on a wick and then we rally higher. And then we come back one more time, touch consequent encroachment of this inversion fair value gap.
And it leaves the body outside of it. Is that bullish or bearish? It's bullish. We rally up, come back up into this area here where it's first uh first utilization when it was printed, it was sell-side delivery. That means if we were bearish, this would cause the market to go down. But, it's a little hiccup here, falls short right at the consequent encroachment, and then the next candle we open trade right back down into Now, you're going to see what that level was that I was telling you I was trying to hide it cuz I I did a series of deletion.
I put all my annotations on and then delete, delete, delete, delete, delete. That way all I have to do is hold down control and tap Z, and it'll populate the charts way quicker. But, I'm really eating up all the time I save by explaining it. Now, all right. So, here's the upper quadrant of this inversion fair value gap. Okay? So, you can see that this fib the only thing it's showing is that right there. That's why I have a highlighted right there.
But, when I was deleting then preparing for the presentation, I wanted this to appear after this would have came back on by hitting control Z. And I just simply messed it up in the sequence, but it is what it is, right? So, we get we trade right down to that there, the upper quadrant, which would be part of being bullish order flow as it relates to the visual representation of this sell-side imbalance, buy-side inefficiency.
When price is bullish and goes above it, we want to see the bodies avoid getting in the lower half, and now can't even touch consequent encroachment. See that? It went just to the upper quadrant. Specific levels, not zones. Okay? Not Oh, I hope it does something. No, we're looking very very specific things. And we rally right back up. Now, we're on the other side closing north of the high of this sell side imbalance by side inefficiency while being bullish that becomes an inversion fair value gap.
We open on this candlestick and we come down and where does it go? It goes just shy of the halfway point or consequent encouragement and then rallies up. Is it bullish or bearish? It's bullish. Okay? So we start running higher. We took out the buy side over there. And then we go all the way up into the projected high using the low to high. Hammers it beautifully. So we're only off by 2.7 handles. So two and three quarters of of a handle.
And then and you watch me do the execution and you can see it clearly is not market replay by the way. There I am. Slamming it. I get one in there here cuz I'm I'm watching go right close to that new day opening gap from last Friday. Which is also the same volume of balance on the daily chart. I told you that we would trade up to last Sunday before the week even started trading that we would go up there and they would sell off.
Well, here it is. Same thing happening. Price is going right up into that area. One more spike into consequent encouragement of Friday's new day opening gap of last week, not yesterday's. Okay? So what I What I tell you? What I tell you about the rules as it relates to new day opening gaps, opening range gaps? You got to have Monday and Friday. Hello. Hit munch and smile and she's like, he did say that. My notes at this minute marker shall tell you. >> [laughter] >> I love that.
I I students that can tell you exactly what video and what minute marker I say certain things. That's how you study. That's exactly how you study. That's how you hold my feet to the fire and you can see that the logic is not changing. It's just there's a lot of information here. And if you view that rich deep detail so that way you know, okay? Permit me to say something for a moment, okay? >> [sighs] >> Imagine imagine raising a child in your home and you live in the same home their entire childhood life and then they move away.
They've been gone for 5 years living their own life and you went out and you did an entire overhaul on refurnishing your home. Okay? Then you're on the phone with them and you're describing, "Hey, I just got all all the furniture changed in the house. Now it's this, that, and the other thing." You could describe the details of certain walls of the home, how far one wall goes to the next. So, when you describe a new layout of your furniture, those details are not burdensome things to the child that you're telling that story of how you refurnished your home.
They're intimate details that helps them understand so that way it's a much richer experience so they can see exactly in their mind without even being shown a picture. You're giving the detail that helps you communicate in a level of understanding that the average person would not know. So, when I see people say, "This is too complicated." No, this is going to require you to use that little gray matter between your brains, okay?
Some of you think that that brain is there just to hold your ears apart. And you have to use that little muscle in there sometimes and with what I'm teaching, you have to use it a lot. You got to be responsible with this information. You got to care about the information. Okay? And obviously, as I'm showing here, there is a PhD level of information that's available in the marketplace that would literally place you in the upper 1%.
I'll say it again. Upper 1%. These guys on the stock market floor that you see on CNBC when they're trading during their hours, none of those guys know what I'm showing you. Cuz if they did, they wouldn't be on the floor up there doing that working. I'm just going to say it. You just You know, you take it for what you want from it. But it's not a knock against them. I'm just telling you just because you see them there at that local area where business is being transacted does not in any way, shape, or form indicate that they understand how these markets book because they clearly don't.
Okay? I promise you that. So, selling short here. And what were we aiming for? Here's your tweet. Okay? If I click on that, it'll take you right to the tweet where I posted it. Can't get better than that accountability, right? And there it is. Okay? So, it's not hindsight. Oh, it's only hindsight. It's only hindsight for you because you can't copy me. Look how much my stuff's been bastardized and prostituted all over the internet.
And you want me to come out here and hand-deliver, spoon-fed delivered trades like that. And all the scammers in the world would be out there scamming even more. And where what would you be able to differentiate them from me? They can't do what I'm doing. So, that's that's the difference. That's the part I I guard. Okay? I There's only going to be one Inner Circle Trader. And you can learn to do these things, but you're not going to get an overnight success like that because everybody wants to be able to say, "Oh, I've been doing that." And if they copy what I'm doing, if I give you those setups and I give them to you live and you can trade for trade what I'm doing with my stop loss, where I'm taking partials, where I'm taking profit, a person that doesn't know who I am that follows that person copying me, they could really do amazing scams and look superior to everyone else while they hide who I am in their country or wherever they're at.
I'm not known by everyone, okay? But I'm I'm a virus that's it's spreading fast. So, that's the reason why I behave the way I do. And I'm not going to jump through hoops for you because some of these people think I'm stupid. They want to think that I'm going to be guilted into doing that. I'm not here doing what nobody else can do. And if you can, just do it. Call it. Execute on it. Prove it's not fake in market replay.
And there it is. You don't have to show me what your broker is. You don't need to do that. But nobody Nobody does it. Apparently, I'm I've copied some other methodology that nobody else can do. Out of the entire world, it's always been in existence. I apparently rebranded something that's always been around, but nobody else has the trades like mine. At some point, you got to call okay? So, that's that. All right, [snorts] we're going to go over to the back into the chart again.
All right, so we have the short in here and I took a partial there. And it ripped all the way down into this short-term low, which was important. Why? Because it's part of the 7:00 to 9:00 a.m. Eastern time time-based range. Getting close to it here and then right underneath that that low, watch. Right there and at 28,400, which was the target I told you it was going to go to when in a tweet there, okay? Now, I know that people saw this tweet, and they watched it rally up like this.
And they were posting all kinds of fun little things knocking and mocking me. They can haha, he thought it was going to go right from there down to 28,400. That's not That's right there telling me that you have no idea what you're talking about. That's what I'm aiming for during the opening range and morning session. I'm looking for that. So, if we're drifting lower, okay? What are you going to do? That's the minimum you should if if you're a casual reader, you should at least expect that these relative equal highs to get traded to before it goes down here, right?
Because we're before 9:30 opening. 9:30 is here. So, minimum it's going to have a run at least to get to these highs, and maybe try to bump that high. But, they don't even have that much understanding. They just want to go out there and be able to say something funny because they are thinking to themselves, I'm so thankful I don't get the kind of flak and trolling that this guy I see ICT gets, cuz they don't have the skin to do it.
But, I invite these types of things because if I get you talking about how negative or impossible or fake or fraudulent or rebranded my stuff is, you're bringing attention to people that maybe never have heard about me. And I'm sticking that virus into their brain when they see what I'm teaching works every day. Same thing all the time. Precision. Precision. Anticipated, not reacted. Not surprised. You see that? So, I'm I'm basically tying strings to all these people like marionette puppets, and I pull the strings, and they bring me more people.
I never had to advertise. I've never had to do it. Because I understand human psychology, I understand how the brain works, and I know how to make you feel like you're superior for a moment, and then I dash your head on a rock in front of everybody. That's what I do, and I've been doing it all the time, the same year every I mean, same thing every year, all the time, all the time. Usually there's some kind of joker that comes forward, and they never do They don't do anything.
So, and nobody's ever come out and said this stuff doesn't work. Nobody's ever come out and said it's rebranded to this. They say things, but they can't even show you where the information supposedly came from before me. So, I tell you these things because there are new students that come here. Okay? And the old heads that's been here, and they don't need to hear that kind of stuff. It's tiresome. I understand. But you're not the only audience member here.
And when you came, you you probably had some doubts, too, and they were completely destroyed. But some of these people that coming here have very short attention spans, and the teacher in me wants them to remind I want to remind them basically, "Listen, before you subscribe to somebody else's opinion about me or anyone else, spend some time, do your own investigation. Is there anything that's noteworthy here? Am I teaching anything and then executing on it?
Am I telling you what's going to happen in the marketplace before it happens? Because if it's happening like that, that's not hindsight. That's foresight. And I'm light-years ahead by using these concepts, and I want you to just take a little bit of your time, and just look into it. You may never be this good at doing it. But what happens if it just helps you keep yourself out of bad trades? You don't have to like me.
It that's not It's not about that. But I want you to understand that this is superiority to everything else. And it's unrivaled. It's completely not challenged by anything else. So, the market trades below that low and gets into my target 20,400. Much like every other week, you know, you see something that's been called out explained in advance. And basically did a a clinic this week. And there there's this looming cloud of doubt that's always around me or these concepts or the ability for them to stay relevant in the future.
And you read these people that want these things to fail. They want them to not be so popular. So, they they create these little bots and they go around and they leave comments and saying smart money concepts or ICT concepts are the new retail. And I want to know what trader wouldn't want to do that? And then cover down here and anticipate it, make it public known. There. So, an hour and 45 minutes later, it goes where it was called to go.
But none of this here had an impact on stopping it getting to where I anticipated it. At a level that you knew about. >> [laughter] >> It's fun, isn't it? So, now the transition once we get to here, now we're part of the sell side of the curve. So, this is a market maker buy model. You can see all the little parts here that are joined and tethered to the 7:00 to 9:00 a.m. Eastern time time based range, which is the pre-session 7:00 a.m. to 9:00 a.m.
Eastern time. Every fluctuation here has a rhyme and reason. And that's another thing I want to I want to tag in here. You see these guys out there and they say, "Yeah, this guy's always got an excuse for why price did something." Yes. You know what that means? That's a depth of understanding that you can't even comprehend. You see it happening, but still you find fault in that. That's a superiority complex. And online, social media has allowed people to show their superiority complex.
It's It's a wonderful um medium to measure someone's psyche, their mental health, their ability to endure, their stamina, mental stamina. And when I did the space yesterday with the Traders Round Up crowd, um some of my students when they when they hear me talk like I was talking yesterday, it sounds defeated like, you know, "I'm discouraged because people don't believe in me." No. That's exactly how I grow. That's the That's the plan of campaigning and advertising.
It's cerebral marketing. I get in people's heads that I know are going to be triggered by what I say and show. And they're going to talk about me. And that talking gets other people looking, just like an accident when you see an accident on the side of the road. You're not going to hurry past it. You're going to slow down and look. You become a looky-loo. And you want to see what's going on. And that slows everybody else down.
And that's what I do. I slow everybody else's attention around anything else and bring it right here. And when they come here, they're met with shock and awe, like, "Damn, I didn't expect this guy to be able to do that." And then let me see what he's done the previous weeks. Oh, he called that and it did this. He traded that. He did that. Exactly. And now they're here secretly learning. Again, they don't have to glad-hand with me.
They don't have to cheerlead. I don't need all that. But what I'm concerned about is because I know social media has cultivated a new generation of very short attention span. It's easy for someone to project their insecurities onto their online participation. So, they'll support toxic people because they're hoping that they don't fall victim to people like that. And that's really become the big circle jerk. If you look around at these there's these personalities that are just absolutely worthless.
They're just completely toxic. And just like in wrestling, you know, you have the heel and you have the face. And when it comes to people that talk smack about me, I'll put the heel face on because I know it's going to rev it up. But generally, I'm the face. Like I'm the I'm the I'm the good guy, okay? But I'm not the perfect good guy. I I keep that line blurred a little bit because if I want to be the anti-hero, it's real easy for me to do that, which is why I like that bully is my spirit animal.
So, you're probably saying get on with this, man. Get on with this. Okay, if you think that, don't bother leaving that kind of comment in there because what I do is I boot you from being able to be seen by me. And if I can't see you, the other people can't see you. So, you you can say what you want to say on your last day posting, okay? But when I see people post that kind of stuff, you're not trying to understand me.
And it's important for you to understand what I do and how I behave as an educator and an online persona. Because if you don't understand the person that I'm being as the teacher, I keep the audience engaged. The fact that you get annoyed means I'm effective because I'm causing an emotional stimuli to rise up in you. And the other side of that is I try to do these things to encourage the people that maybe have doubts.
Oh, well, he said that, you know, this stuff doesn't work, so I better believe him because this guy I see he's clearly a fraud because he said it's clearly a fraud. If this is what fraudulent trading and teaching does, >> [laughter] >> sign me up. I want to be a part of that, okay? So, eventually it broke lower, and I didn't have much time my son had to take care of something, and I had to take my youngest somewhere.
He doesn't have a driver's license yet, so um I couldn't stay with it for the rest of the day, but I want to show you over here how we used that 28,400 level after clearing it. There's the relative equal lows. And then there's relative equal lows, and there you go, okay? So, when we get into that bit of business here, I want you to think about the daily chart, okay? Um when we're looking at like, for instance, let let me get all this stuff out of here.
Let me look at this out of here. Well, I'm going to take the fib off just for a moment cuz I'm going to show you the opening range gap now. When you see this and strip it down to what I teach with very specific key PD arrays, okay? And you see it trade up into it, and I told you I was looking for that price there at 8:14 a.m., and right here at this time we're there. If you don't have this on your chart, you ain't going to know how high can it go above that buy side?
How high can it go? You see how keeping reference points that are specific to days of the week, times of the day, new day opening gaps from last week allow me to pinpoint the high of the day and short it right there. But if you don't have that information, how's it useful to you? It's not. Because you're not looking. Because no one's told you to look at those things in all of your 20-year-old mentors. No one's ever told you in those books prior to me.
No one's ever brought that information to you. No one said, "Look at this." You don't see the guys on the on the floor doing those things, either. It's not something they ever were prompted to pay attention to. So, when I teach it to you, it's important for you to hold me responsible. If I say something's going to be important, then you should say, "Okay, I'm not going to take his word for that." I want you to not trust me.
I want you to go into my information and see if you can say it's not there. That's what I want. Because when you go in with the motivation to prove it's going to be a waste of your time if you spend you know, years with it, go in and try to tear it apart. And you're going to find that it is absolutely impervious. It's perfect. But if you got motivated either that you subscribe to it right away because you believe what I showed it and and it and you accept it for what it is at face value at first time, wonderful.
You're a wonderful wonderful student. You're you're already in the right mindset. You're easily taught. You can learn how to do this because you're not going to wrestle with, "Is this a fraud? Is this a scam? Is he doing this? Is he doing that?" Like, how can I how can I fake these things? I'm telling you before it happens. Nobody else is doing that. And I'm doing it for free. So, where's the motivation for me to scam you?
I'm on X majority of the time. I'm not even monetized. If you don't believe me, I can go on here and screenshot and do a whole recording where you can see I'm not getting any revenue off of X. Not one bit. So, I'm doing the best I can to show you there's nothing in it for me except for just a passion and teaching it. But, why did it go down here? Well, I was looking at the likelihood of it trying to get there, but I wasn't going to be a part of the afternoon session.
And I thought we would have it trade here, come bang around inside of here for a little while, and then wipe out this area down here. And I'm going to show you why that's the case, okay? But, eventually in the afternoon we did get a little bit of a a drop down, but it went to where the daily low would have went to. And I know that probably sounds cherry-picked, right? It sounds like, oh, anybody can say this after the fact.
But, now let's go out to a daily chart and I'll explain why I said what I just did. Um let's go to daily. And I'll remove all of the lipstick here and I'll frame this out for you so you can see it. All right. So, if we take away all of the drawings, okay? We have nothing here. Zero information. Zoom in. We'll scout. She's over here in the morning room snoring like a lumberjack. >> [laughter] >> All right. So, we had traded all the way back up into that little inefficiency.
So, I'm going to put a little bit of lipstick on. I got to be be got to remain mindful of making sure I undo this cuz I don't want this thing to auto save and then I'll lose my annotations and I'll have to go through all that again. So, there's that level I told you we would open and trade up into and sell off. Not for a day trade. Swing trade for several days. So, here's Monday, Tuesday, Wednesday FOMC. In post FOMC we opened and then straight on up.
Then we followed through by opening here and then trade up into the volume imbalance and then trade lower, okay? Where can we recently anticipate if it did this and started selling off, where would price likely go down to? Like where could you project a reasonable low of day? Now, this is the part where you pause the video. And if you're smart and you know where other approaches to trading would have called where the low is going to form, this is where you say it in the comment section, okay?
Now, I'm going to show you the algorithmic approach to it what these markets are using, all right? From up here, where could we project the daily low? I mean, you seen me short the daily high. So, there's no no doubt about that. But on the flip side of it, if I was going to spend the rest of the afternoon and it was not going to do the single straight run down to it, this is what I would have used, okay? We're here. We're in this general proximity of uh Let's go to 20,400.
That was the level I told you I was going to trade to. That was the the sell side I was interested in. You having fun? You enjoy these types of things? I'd love teaching this. Like I absolutely love teaching it. I can see it like this. And we'll make it uh red. And then the coordinates will be That was the level I told you, okay? Obviously, it you know it was a very specific level with those relatively equal lows, but that was the level I called, okay?
So, as soon as we went below it intraday on Friday, we can then look at what we could potentially trade to as a daily low. So, the first point of reference is what was yesterday's range. That. Okay, so now watch. And low all the way up to the high. And we'll shoot this over a little bit. Okay. So, now we have a reasonable objective to try to get back to 28,111.5. Okay? Not bad. Now, because that level's there, I'm going to create another fib, and we're going to measure this wick.
Why not picking that wick? Because we're above it and trading down into that wick. Okay, it's going to be a range like a gap. Okay, so you want to you want to measure that. So, from the low up to the high. Same bit of business. But, we're going to change the colors a little bit so that way there's a little bit of a contrast. See, these are grayed out. And we want to see maybe a Let's do purple. And I think that'll be Yeah, that'll be good.
We'll just do the purple one. And I'll take all the other ones off. So, that way it's real easy to see it by contrast. And I'll take the quarter one off. Okay? And now we can do this. Okay? So, now we have two points of reference. Now, when I have this like that, I have two little sweet spots in the previous day's range and to the left of that, why? Cuz we're going to go back 3 days. Here's this thing. So we're trading this as day one, day two, day three.
So day three, we have a wick we have to contend with because it's below where well, we're up here and below it, it could trade down into that cuz it's looking back 3 days, your entire universe of liquidity and inefficiencies can can be summed up in the last 3 days. Once you breach the last 3 days range, then you got to look back further. Okay, got to go beyond 3 days. But as a day trader or intraday scalper, you only need 3 days worth of data.
I used to train people in the Forex market and I'd say, "Tell me what you think the market's going to do." And I would give them a small little sample set of intraday price action. And I get it's not enough data. Fail, flunk, get out, F. You failed. You don't need a lot of information. Look what I've shown you just with 2 hours of data between 7:00 a.m. and 9:00 a.m. Eastern time. It's the quality of the source of information.
If you go in there and you try to do something like, uh tell me the range between um you know, 12:45 and 1:15 p.m. That's not going to be as useful There's There's nothing there. I mean, you have a macro period in there, but other than that, there's nothing significantly you know, salient to why markets should do something or another thing. But here, we have two points of reference in here. Now watch, I'm going to show you.
You zoom this in. I know this is already I mean, there ain't no way I'm doing all this stuff. Right, keep working at Burger King. The bottom line is this, if you want to see the precision that I'm share sharing and showcasing, you got to do things a little different. You got to do things a a different. And we're going to expound on this now. All right? So, there's two points of reference in here that you need to be aware of.
You have that and that. If you measure that, so we got 28,097.25. It's only math, folks. That's all these markets do. They work on math. But, it's got to be important that it's it's anchored to time. So, I need to go to 20,111 half. I'll anchor there and then I'll change it to 50. And then I'm taking these numbers and I'm verifying that they agree. 111.50, 111.50 97 quarter 97 quarter. Now, I want this to be the midpoint.
So, I want it at midpoint right there. That's a consequent encroachment level of two projections for a daily low. Okay, this is a high probability draw. So, the bulk of the the consolidations or bodies will probably respect something like this. Or it could be just the very extreme, okay? And I can go one more day forward with this so it appears without me having to go searching for it. All right? And then the other bit of business is we have the low of that wick 3 days ago to here.
All right, so now we have 28,000 70.25. You always asking me, you know, show me what you have on your little notepad. It's things like this. 70.25. We'll anchor that back in a second so that I get here. All right, so 70 and 25. All right, do they agree? 28,070.25, yes. And that's accurate to the high. So now we have this level here. So 28,124.25. All right? So we're going to project that over to the right a little bit.
All right? So and now we're going to make that a little beefier. Make it bolder so it stands out and then we're going to put a dash line to kind of like delineate that from the other things. All right? So there's that. So now the chart is completely clean except for these annotations. We don't need this, Sean. Actually, let me double check what I got here. Scrunch this down. So everything in this area here, they're all projections on what you can anticipate the uh Got that.
So what we're looking in the this small little area here and now I'm going to put a a rectangle just to highlight this little space. Wait, there. Okay? So inside of the intraday price action for Friday, we're going to explore what price did with all this information here. Now I know some of you are like, "I'm not going to do all this. I have I have no con- I have no interest, no concern for it, none of it. I'm not going to do it." And there that's that.
We can take the full range from that candlestick away and there's there's our data. Okay? So now watch this. You ready? 1 minute. Boom. >> Market replay, right? Come on, man. Nobody's Mr. Wizard but me, okay? Jack Swagger, you might as well just clean your slate. The next market wizard book is just me, okay? You're just going to have to come out here to Maryland and hang out with the old man, and I will give you a story will blow the socks off everybody. >> [snorts] >> So, where's the market go to?
Where's it go? There's our range of key specific levels for projections. We mapped it out. We had the highest highest point and the lowest lowest point, and we have very specific levels. It trades down into it, and look at the Look at this level right here that I shaded out. Isn't that interesting? Isn't that interesting? In in that vicinity, we're getting this type of thing. Now, we're going to take that box off because we're highlighting that.
Now, look what it's done. We trade down into those levels, and we wick down through, then we rally up. Smooth highs, come right back down into that level again. What is that? It's the wicks on the daily chart that we're treating as a gap, and we're choosing to use the very specific gradient octant or quadrants or consequent encroachment. What's the lowest low it could reach for? What's the highest high it could reach for in that vicinity, okay?
So, when you're looking at daily highs and lows, you're going to get a rough idea. It's going to be inside of a clustering of PD arrays, not just a single PD array. You have to blend some things, okay? And 34 years this November, okay, I've been looking at the market with these types of interests. Like, I want to see how does it form the high? How does it form the low?
The words are the caption track's own and nothing is reworded or re-transcribed. Paragraph breaks are placed between sentences so the text reads as prose.
Free tools for your own script. No signup, no login.
Paste your draft and see where viewers are likely to drop off, with a rewrite for each weak line.
Paste the first 30 seconds of your own draft for a hook score and rewrites.
Check your draft against YouTube's advertiser-friendly guidelines before you record it.
Read this channel's public videos and transcripts, and download a writing brief for it.