Getting the transcript
Reading the captions from YouTube. A video nobody has opened here before takes 10 to 30 seconds; this page fills in on its own.
Getting the transcript
Reading the captions from YouTube. A video nobody has opened here before takes 10 to 30 seconds; this page fills in on its own.
The Inner Circle Trader · @InnerCircleTrader
Words
4,845
Runtime
30:23
Speaking pace
159wpm
Reading time
20min
159 words per minute, below the 160 25th percentile of 349 measured videos. That distribution comes from the 349-video hook study.
Opening (first 30 seconds)
Welcome back folks. Hope you're doing well. All right, we are in part four of the series for this particular week. How new students should start and we're dealing with logging key phenomenon daily. Now, if you look at my channel on YouTube and you consider how many videos I have and you think to yourself, there is no way I'm going to be going through all those videos anytime soon. In fact, I'm probably never going to try to
80 words, the words spoken in the first 30 seconds at 159 words per minute.
Free, no signup. See how the first 30 seconds hold attention, with rewrites.
Sentence shape
| Measure | This transcript |
|---|---|
| Sentences | 341 |
| Average words per sentence | 14.2 |
| Longest sentence | 79 words |
| Questions asked | 26 |
| Sentences containing a number | 40 |
What this transcript is
Every word below is the caption track YouTube publishes for this video, pulled from the video itself and reproduced unchanged. It is not Prepublish's writing, not a summary, and not a re-transcription: it is the video's own published captions. English captions, generated automatically by YouTube, in the video’s original language. Source: the video on YouTube. A channel that would rather this page did not exist can ask for its removal through the contact page, and it is removed.
No Script X-ray for this video: YouTube shows a Most replayed graph only once a video has enough views.
Welcome back folks. Hope you're doing well. All right, we are in part four of the series for this particular week. How new students should start and we're dealing with logging key phenomenon daily. Now, if you look at my channel on YouTube and you consider how many videos I have and you think to yourself, there is no way I'm going to be going through all those videos anytime soon. In fact, I'm probably never going to try to do it.
It's too much. And I I get it. It's a little intimidating. Okay. So, one of the things I wanted to kind of like bridge the gap for brand new or students that are contemplating beginning with me as a as a mentor. I use the futures market. Now, the things I teach work in all markets, but I use this particular market because it allows me to show lots of examples. It is a regulated market and it is not a CFD. Now, there's things that I'm going to show you here that will work in the CFD market as well.
You're just going to have to match the things up. As I get to specific details, I'll mention what that is. Okay? But if you're a forex trader or if you're outside the United States and you're studying price action through that medium and not the US futures market, just know that the things I'm teaching here work in those markets as well. So the first primary thing I want you to understand is you don't have to have everything I teach.
In fact, the worst thing I see happen is new students come and they try to learn as much as they can as fast as they can and they try to get through everything in a short span of time only to find out they haven't learned anything. They've wasted time trying to rush. So, I'm going to give you three things to start with. That does not mean go in every single day looking for all three. For the first one or two weeks, just pick one of these.
After two weeks, add another. Do that for two weeks in addition to one of the phenomena I'm going to teach. And on your fifth and sixth week, add the final third one. And then make it a steady diet of looking for these things, logging them every single day because it's a phenomenon that repeats every single day by doing something like recording price action, annotating your chart in a way where you'll see these things tend to repeat.
They tend to repeat around a specific time. they tend to repeat in a specific fashion and you'll you'll begin to develop a a pattern recognition mindset. You'll also be conditioning yourself to look for these things which is the end result by studying it in the past. So having an understanding of what it did for many days in the past and also then studying it going forward, you have the best of the best in terms of training your eye, learning to seek the pattern, learning to seek the regime behind every one of these characteristics I'm going to cover.
There's a method that's being employed all the time, but you're not going to fully understand it until you see it multiple times. If you don't want to do these things, I'm going to promise you this. You will not be consistent. You'll jump from one thing to the next, you'll almost guarantee you'll be better doing something else within my library. And that's not true. Start with something simple. And in my opinion, these are the three pillars to start with as a smart money concept student using my concepts.
You're going to look at these things and say, "Okay, I'm not going to stare at the chart blankly anymore. I'm going to go in every single day and I'm going to study these three primary pillars. They're very simple things. They're not complex. They're not going to be able to hide it from you. And that's the power, okay? That's the power of this. It's not complicated. If you came into this hearing other people say it's complication, over complication, or just, you know, things of that nature, it's meant to disourage you and kind of like direct you away from it.
Give this six weeks, okay? Two weeks for each one. Now, if you're a little bit more advanced and you've been under my tutelage for a little while, but you still can't find your groove, then you don't have to spend six weeks doing one for each two weeks interval. You can go in and do all three because you you know exactly what it is you're trying to do, but you probably never did this part of the growth process, which is essential.
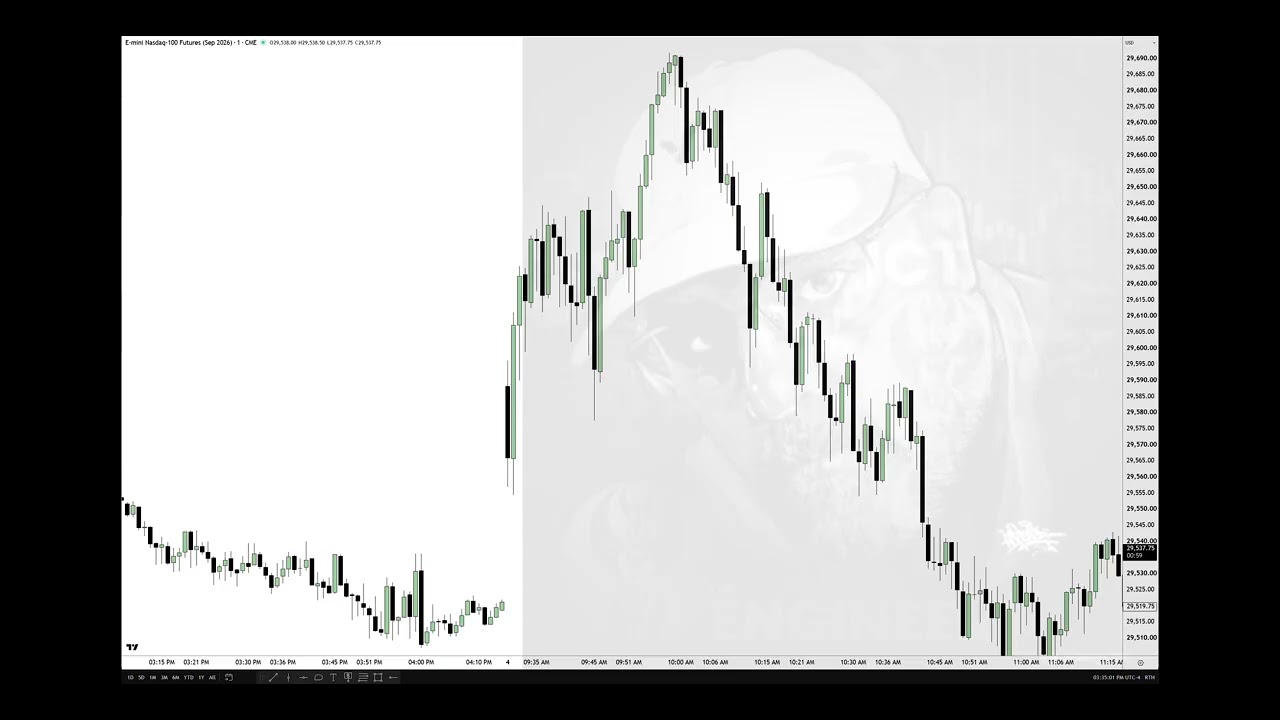
So, the first one I want to talk about is the pre-market hours phase. and it's relative equal lows and relative equal highs. So, by having a very specific focus on a specific time of day, every single day, every single trading day, every single trading day, with the exception of Sundays, every single trading day has a pre-market session time between 7:00 a.m. Eastern time and 9:00 a.m. Eastern time. So by looking at that little window time, the way you want to annotate your chart is take a vertical line and annotate 7 a.m. and 9:00 a.m.
Not hard at all, is it? Then inside of those two vertical lines, you want to study what the highest high and the lowest low is in between those two hours. by having that drawn out like this and encapsulating it. You want to highlight that as well. So that way when you do screenshots, and this is the whole premise of what we're teaching here, you want screenshots of everything that I'm going to cover today. It's very simple.
Three screenshots per day. It's not hard. It doesn't take very much time. And if you can't do that, I promise you, you can't stick to trading rules to follow a model at all. Because this is simple and this is how you get better at reading price action, anticipating, not reacting to specific things is going to lead to high degree of precision in reading the tape. Meaning, where's the market going to go next? How will it go there next?
So, inside these two vertical lines, you're going to be studying whether or not the market is trending, consolidating, or reversing. Okay? So, we can look at that through the lens of two options. Is it trending or is it not trending? to make it very simple for you. If you're brand brand new, okay, never been around me at all, you can strip it down to is it trending or is it consolidating? Now, an example of what consolidation would look like is what the price is doing here.
See how it's just going sideways like that. Here, we started at a low and we moved all the way up here to a high. That's trending. Okay? Or if you study the very first video in my paid mentorship 2016 playlist, I teach the four phases or conditions of what the market can do and its expansion, its reversal, its consolidation. This principle is a little bit more advanced and it's not necessary here. So, what I want you to do is just think in terms of is it going in a small little range or is it moving in a trend?
Now, it can trend higher like it does here or it can trend lower. Either one, it's a trend. If it's consolidating, that's important because that means you're likely to see at 9:30 the market provide this type of behavior after 9:30 Eastern time when regular trading hours opens up. And you're going to record how that market looks. You also want to include any relative equal lows like we see here. This low is relatively equal to that one.
And you want to record the highest high and the lowest low by having these two types of pools of liquidity annotated. and you find them in between 7:00 a.m. and 9:00 a.m. How hard is that? It's not complex, is it? You're finding the very specific pools of liquidity and you're trying to determine if inside these two vertical lines if price action is consolidating rangebound or is it expanding or trending. If it's doing those types of things, then you're going to expect consolidation.
Well, here we have it. It trended between 7 and 9. At 9:30, we had a little bit of an expansion, but then what happened the rest of the day? Consolidation. So, it's a precursor. It's like a It's like a a crystal ball, if you will. The proverbial crystal ball determining what's the strong likelihood of how the market's going to book after 9:30 Eastern time. Is it going to be expansion? Is it going to trend? or is it going to chop around and go sideways for a while?
You find that out with the clues that the market gives you between seven and nine. It's not a panacea. It's not going to work all the time. But it's important for you to log it every single day and annotate what you observe here. Any relative equal lows and then how did those relative equal lows get traded to if at all. Here you can see it used it there. It swept below it and then we rallied higher. If you looked at the market just trading below here and then aimed for the opposite end of the range between 7 a.m. and 9 a.m.
Eastern time and just aimed for that high from there to there, that's a breadandbut setup. Very, very easy. Once you hit that, it would hit it right here. You're done for the day. Go and do something else. Then come back when the market closes and study and look at past price moves. This is the first pillar. It's not complex. I do this every single day myself and I've been trading this November 34 years. I do it all the time.
All the time. Now, while I don't do screenshots because I don't I don't journal by electronic means. I write down the actual numbers of the high and the low and I write the the condition or phase that the market was in. What type of state the market was in. Was it in trending expansion or was it in consolidation? And then I record the actual raw numbers where there's relative equal lows, the highest high, the lowest low, and where that market was referred to back to those specific price points.
And then I write the time it did that and that in this case would be here. So you would annotate that time. How much time did it take before starting at at 9:30 before it reacted off of a key level that's determined by the liquidity pools which are relative equal lows or relative equal highs and the highest high or the lowest low. Very very simple, very simple process. You're not left looking at all of this price action and trying to determine what's the most important high, what liquidity pool am I looking for.
You see how it completely strips away all that ambiguity. The second pillar in understanding what a new student should be doing with logging. This is not back testing, okay? This is just simply screenshotting things that you want to study. By getting a large sample set of these types of things, the next video I'll do will show you how to back test and work with the information and get a a better understanding what you're supposed to be seeing, not just taking pictures of it.
The second one is we're going to be looking at regular trading hours opening range gap and its consequent encroachment delivery. Now, if you're brand new, it sounds like a whole lot of mumbo jumbo. I understand. But here, what we're doing is we're looking down in the right hand corner of your chart on Trading View. When you load up your one minute chart, it has to be one minute by the way, you want to toggle. It may say ETH, which is electronic trading hours.
If it says that, click it and then you'll see an option that says RTH or regular trading hours. You want to make sure you're highlighting that. And you'll find that in the lower right hand corner of your chart. Once you're toggled to regular trading hours, you're going to see if it exists between the previous day at 4:14 p.m. Eastern time, the final print. That's the closing price on that very one minute candle. And then you'll see if it's 9:30 or after Eastern time A.M. that opening price there is the regular trading hours opening price or the beginning of regular trading hours for the new trading day.
Now when you have that, all you have to do is simply draw a rectangle out on your chart like I'm doing here. Okay. When you do a rectangle on Trading View, and I have my little favorites down here, I have it set to always include this little mid level. It's an option when you draw the rectangle out. You'll see it's there. It's very simple. It's in the options portion of it. Always include that. So that way you'll know where the middle of that range is.
What range? The regular trading hours, opening range gap. the difference between where we stopped at 4:14 p.m. Eastern time to where we start trading 9:00 a.m. the following day Eastern time. That difference is your regular trading hours opening range gap. By having the rectangle split its range in half, which is in the options on of using this little tool down here, it may appear over on the left hand side. Highlight it here. regular trading hours, opening range gap, C period, E period.
It means this is a fancy name for middle of the range or inefficiency. You want to look at this segment of price action and how does price pull back to half the range. It does it immediately here on the second minute after 9:30. And at 9:31, we open, we trade right down to it immediately. I want you to keep track of how often it takes the market to get back down into half of its gap. And you're going to find that there's a 70% likelihood that it gets to it by 10:00 a.m.
Don't hold me to that number. Don't hold me to that. I want you to follow along every single day and you keep record of that. and then at the end of the year do a number on the statistical uh probability of that having happened for the year previous and you'll see there's a reoccurring phenomenon that you could take advantage of. What is that? Well, if you're looking for lower prices here, you can just simply anchor a target to that and take any old fair value gap or bearish order block once you learn what they are and just target that.
And you don't have to do anything else. You don't have to look for an entire closure of the registrating hours open range gap. It's just you're logging screenshots and then don't just take pictures like I'm showing you here. You want to fill in all the empty spaces that you allow for by zooming and centering the chart. So that way you can write in information that's important to you, observations that you're you're seeing. over here you might include that this is like the third time this week that it went right to reg trading hours open range got consequent encroachment by 10 o'clock and it afforded me an opportunity to see a short from you know something up here that may be a bearish idea you know using an inversion fair value gap up here and selling off down to consequent encroachment of the opening range gap seen by regular trading hours.
All right, the final and third one. See how painless this is? Very, very simple. Don't over complicated by overthinking what I'm explaining is to start doing it and you'll see on a Saturday or Sunday while the market's not trading. Go through your screenshots. You may miss something when you were doing the screenshot and annotations and and writing down the observations you made. Give yourself time away from the market's booking price real time.
When the markets are static and not moving, it's real important for you to look for things that are details that you may have missed. And over time, you'll start seeing a little bit more detail that you didn't pick up the first few months. And then you'll get a pattern recognition mindset where you see real-time price action and you can almost see what it's trying to do before it does it. The third one is the silver bullet first presented fair value gap after 10:00 a.m.
Eastern time. Now, if you don't know what that is, it's very simple. What we're looking for is 10:00 a.m. Eastern time. You're going to look at 10:00 a.m. Eastern time and beginning at that minute marker 10:00 a.m. that candlestick can be a fair value. Very simple rules. I'm making it streamlined for you. So, as soon as that candlestick closes at 10:00 a.m. Eastern time on a one minute chart up here, one minute chart.
Once that forms, you can see if there's a fair value gap on that particular candle or immediately after that. And the first fair value that forms inside of that 10:00 hour, that's the one you're going to look for. Here you can see that we have 10:00 a.m. and the very next candle, 10:01, we have a sell sign and bounce by sign deficiency. So there's a little bit of a gap there by having this little volume imbalance. You have to know what that is.
So when the bodies don't meet on candles that are considered a potential fair value gap, you have to include that. So draw that down like that and extend that to the right. Now you can do the setting on your rectangle which is down here. You can set it to extend to the right or you can just drag it out a little while. In the beginning, I want you to click to extend to the right, but then when you do your annotation, turn it off, and then drag it to the first time it returns back up into it like it does here.
So, the market creates the fair value gap, drops lower again after 10:00 a.m., and it creates a short-term low here. You see that? Then it rallies back up to it there. And then it goes from this point of the fair value gap down below that low where a sellside would exist. So a setup that you're training your eye to see a very small simple little fluctuation in price action that tends to repeat every single day. Now when you get real comfortable with seeing things that repeat every single day, you're not going to be more prone to chase things that you don't understand.
You're going to stick to the things you understand. And by looking at this, it gives you a complete model. It tells you what time it's going to form, how it's going to form, and then all you have to do is determine where the high and the low is that it may aim for. In this case, we see the market came far from this high down here, rallied up. We broke these lows and these lows here, and then we traded right back up. You're not trying to determine if you're right. about picking the direction of here to here.
You're recording it after the fact. You'll get to the point where you'll be able to see these form and then you'll know where it's going to go, the sell side or the buy side. But in the beginning for at least the a pattern of four to six weeks, submit to that. Do it every single day. And then by recording what's already happened, what you're doing is is you're recording subconsciously a a picture of something that you've never seen before.
And if you've seen something every single day in various formats, slight little subtleties that are are just a little bit different, but they generally look the same all the time. Your understanding about this principle will be greatly enhanced. And that experience is something I can't give you as a student. You have to earn that. And by going through price action, looking for things like this that repeat on a day-by-day basis, you will see why there is no reason for you to chase price action.
There's no reason for you to system hop, jump around. You don't need to consume every one of my videos right away. You can take your time and grow in an understanding of three primary pillars in smart money concepts. It's very visual. It isn't going to hide from you. Everything is timebased. So that way you're not looking at, you know, in the afternoon looking at something. You're not looking at Asia. You're not looking at London.
If you're brand new, I don't care if that's the time you intend to trade. Do this because everything that you do here can be transposed to any time frame or any session you're trading. I promise you. But do the work like this. Spend time doing this very thing every single day. Record the time the fair bag got formed. In this case, it would be 10:01 Eastern time. And then how long it took, how many minutes, okay, did it take before it came back up and offered the setup to sell off to take out the short-term low between where it returned to the fair value gap and where the fair gap formed?
How much of a range did it form from this return back up into it down to here? How many handles is that? You determine that over here. Okay. So, whatever the highest high is on that, whatever the lowest low is, that's your total range. That's how many handles over here the movement was. And you want to see this every single day. Condition yourself to do this. It's almost like a a ritual. Okay, it's an exercise and meditation.
You're going through price action. Put yourself some really nice calming music on and just go through the process. You're doing this every single day. And what you're doing is you're teaching yourself to see something you never paid attention to or would have recognized. No one else is going to show you these things outside of our community. I mean, well, that's that's not entirely true. There's a lot of mentors out there that copy me, but doing this will be better than paying for a mentor.
I promise you, you don't have to pay me. I just gave it to you for free. But doing these things over and over again, every single day, going back through what we just created today. But you need to go back six weeks worth of old data and do the same thing, but you have to walk forward every single day for the next six weeks. So, at the end, what you're going to have is you're going to have 12 weeks of data. You're going to go through at your leisure. as far back as six weeks in the past with one market, NASDAQ.
Just one market. I don't care if you don't want to trade NASDAQ when you get to be trading, just do it with NASDAQ because it'll be easy for me to refer to certain things. And then what will happen is when I talk about NASDAQ, things will start resonating with you more because you're in tune with this market. You've seen it doing certain things. And then what you what you've accomplished is a measure of understanding and experience that you can't purchase.
You can't buy it. And it'll prove to you that these things absolutely work. They repeat. And just because you can't recognize it real time, it doesn't mean you can't recognize it 6 weeks from now. That's going to be it for this one. Short and sweet. Hopefully you found it insightful. Don't discount it thinking it's too easy. The work of actually doing these things is what you get the benefit from. Not just simply Netflix and chill watch ICT videos.
This is not one of those videos. This is all you rolling up your sleeves spending about 20 minutes a day. That's all it's going to take. 20 minutes to do all three. But how much time you devote to it going back six weeks for every single trading day, that's up to you. But every day going forward, starting next Tuesday, because we have a holiday in the States on Monday, Labor Day, starting on Tuesday, that'll be day one that you do these little routines where you you log the screenshots of what it is that you're observing here.
And try to take your time making sure everything is really, you know, centered, everything from this highest high to that lowest low. And you're really able to see everything. It's all center stage. So that way it allows you all the maximum amount of information space that you can annotate and record your observations and take it serious pretend if if you will that I'm your professor and I judge on neatness and organization because I would the more dutiful you are about being organized and neat and concise about your observations and your and your logging how you screenshot and what you screenshot.
It's important. It's a It's a sign of character. And if you take this serious as your business that you're building, you you'll you'll spend a little bit more time with it. These journal entries that you're creating, you'll be able to look at these things 10 years from now as a trader that's been doing for a long time, and you'll be able to appreciate what you were doing when you first started, how you were being diligent about being neat and concise about your observations.
And you'll remember the day because you'll read the little annotations and it's like a little time machine. You'll be able to say, "I remember that day I did that. I remember I learned the understanding of the fair value that forms in 10:00 hours and and how to run to the short-term high or the short-term low for sellite. I knew how to figure it out on this particular day." And you get to relive that moment just by reading your annotations.
Now, how you store all this stuff, that is left up to you. And for all of you that are already back testing and journaling, um, and you're doing it electronically, which I kind of advise you to do it because I don't have that benefit. I can't go back through the hundreds of leather journals I have and know what page and how many times I talked about something. I don't I don't have that ability. And I I kind of I kind of envy all of you in that regard.
So there are electronic formats for journaling that you can put keywords to certain things and then you can do a search on by date and the topic and you simply want to journal this like silver bullet log 10 a.m. The previous ones you can do the pre-market session condition or phase and pre-market liquidity pools. And then the second one was the regular trading hours, opening range gap, consequent encroachment, uh, delivery.
I promise you, by doing this simple little exercise, you are going to learn more about price action than you will if you just drone on going through videos and videos and videos and trying to learn new things that I teach. Just pick one of these and start, but work towards doing all of them and make this a primary function of you every single day. I promise you, I absolutely guarantee you, you will be able to read price so much better without that fear of missing an understanding or not knowing what you're looking for.
You'll know what it is you're doing. And it's simple, but you have to put the time into doing it. Hopefully, you found this insightful. Until I talk to you next time, be safe.
The words are the caption track's own and nothing is reworded or re-transcribed. Paragraph breaks are placed between sentences so the text reads as prose.
Free tools for your own script. No signup, no login.
Paste your draft and see where viewers are likely to drop off, with a rewrite for each weak line.
Paste the first 30 seconds of your own draft for a hook score and rewrites.
Check your draft against YouTube's advertiser-friendly guidelines before you record it.
Read this channel's public videos and transcripts, and download a writing brief for it.
Most used terms
Filler phrases
37 in total: like 21 · you know 6 · kind of 5 · uh 2 · I mean 1 · actually 1 · um 1.
A literal whole-word count of the same phrase list the Prepublish browser extension uses, so a phrase inside another word is not counted and a phrase used in its ordinary sense still is. It is a count and not a judgement.