Getting the transcript
Reading the captions from YouTube. A video nobody has opened here before takes 10 to 30 seconds; this page fills in on its own.
Getting the transcript
Reading the captions from YouTube. A video nobody has opened here before takes 10 to 30 seconds; this page fills in on its own.
AI Engineer · @aiDotEngineer
This video has no Most replayed graph yet: YouTube shows one only once a video has enough views. These are the moments viewers replayed most in AI Engineer's most watched videos.
Most replayed moment at 18:45
4.8x that video's typical replay level
that they're they're changing they're changing things in the database not yet. You want to run them through the ontology first and make sure that works. Okay. I only got an I've got I've got another I've just a short time. I'm going to try to show you some of the things that um that you can
Said at 18:37
Most replayed moment at 16:13
3.6x that video's typical replay level
method signatures, the program layout and the call stacks. So here's some examples. I don't think you'll be able to read this one, but this is like the level of abstraction we're at. It's how we're actually going to lay this stuff out and how these systems are going to interact. Dylan Mulroy from Cloudflare talks a
Said at 16:06
Most replayed moment at 13:49
2.3x that video's typical replay level
Fable uh and it runs into an unknown, ask it to log it, right? So that um you uh you can see where the deviations happened and then you can sort of figure out why as well, you know? It will usually give you some context about what happened.
Said at 13:43
The graph counts replays. It does not show where viewers stopped watching.
Words
3,878
Runtime
23:34
Speaking pace
165wpm
Reading time
16min
165 words per minute, between the 160 25th percentile and the 181 median of 349 measured videos. That distribution comes from the 349-video hook study.
Opening (first 30 seconds)
Hi everyone. I'm Alejandro Vidal, the founder of Mind Makers. And my background is psychology and computer science, which is kind of weird, but for today it's going to be extremely helpful because I'm going to show you how you can borrow ideas from psychology and psychometrics to improve the way that you are evaluating models right now. Because at this moment the state in the industry is counting the number of right answers. That actually has a name. It's classical test theory.
83 words, the words spoken in the first 30 seconds at 165 words per minute.
Free, no signup. See how the first 30 seconds hold attention, with rewrites.
Sentence shape
| Measure | This transcript |
|---|---|
| Sentences | 242 |
| Average words per sentence | 16.0 |
| Longest sentence | 55 words |
| Questions asked | 36 |
| Sentences containing a number | 17 |
Most used terms
Filler phrases
98 in total: actually 36 · uh 35 · kind of 11 · like 10 · um 6.
A literal whole-word count of the same phrase list the Prepublish browser extension uses, so a phrase inside another word is not counted and a phrase used in its ordinary sense still is. It is a count and not a judgement.
What this transcript is
Every word below is the caption track YouTube publishes for this video, pulled from the video itself and reproduced unchanged. It is not Prepublish's writing, not a summary, and not a re-transcription: it is the video's own published captions. English captions, generated automatically by YouTube, in the video’s original language. Source: the video on YouTube. A channel that would rather this page did not exist can ask for its removal through the contact page, and it is removed.
Hi everyone. I'm Alejandro Vidal, the founder of Mind Makers. And my background is psychology and computer science, which is kind of weird, but for today it's going to be extremely helpful because I'm going to show you how you can borrow ideas from psychology and psychometrics to improve the way that you are evaluating models right now. Because at this moment the state in the industry is counting the number of right answers.
That actually has a name. It's classical test theory. And we have by far better tools to do that. So makes sense to borrow ideas from IQ tests and related stuff. So we can apply them to LLMs. Let me start with a very simple example here. Um we are using real data from epoch.ai. If you don't know them, their project is amazing and they have quite open data sets so you can actually use them. And here we have random selection of models with a real benchmark.
As you can see here, we have an accuracy for each one of them. That's the current state of the art. So if we split each bar into different questions, each one of them is going to be a different question or a different item. I'm going to use item for um uh for for the same idea of question. In psychometrics we use item instead of question. Um if you sum all together, we are using a very strong assumption. We are saying that every question is equally important.
They should weigh the same, which is kind of insane if you think about that. We have better questions, more complicated questions that may maybe we should pay more attention to. And also we we can have questions that are mislabeled or something like that. So we are going to improve this. Well, uh what we're going to do is we are going to use each item, each column here is going to be one item. And we're going to treat them as individual variables, okay?
So, we are going to have this matrix here. As you can see here, uh on the top right corner, we have difficult questions for weaker models, and on the other side, we have very easy questions for strong models. So, makes sense that we observe this pattern, okay? But, we are going to estimate for each question, for each item, a difficulty level. That is going to be called B. The B parameter is going to be the difficulty of each one of them, and we're going to create a function for each question.
That function maps the LLM intelligence, okay? To the probability of getting that answer right, okay? So, very easy items are going to be here, and extremely complicated items are going to be there. As you can see here, B is the point that uh crosses 50% chance in that curve, okay? Which is going to be useful later. Also, B is going to be distributed by a normal distribution, which is going to be also helpful to use that for interpretation, okay?
So, with that in mind, we can actually estimate also theta. Theta is going to be the level of intelligence for each model. That's going to be that dot, that black dot. So, as you can see on the right side of each dot, mostly uh all of questions are going to be read, which makes sense if they they are extremely complicated or more complicated than the level of intelligence of that model, the model is going to fail them, okay?
So, we are going to model that way. So, for example here, if I click on this button, I'm going to see that uh GPT 5.5 here is going to be able to answer that questions because GPT 5 has a theta value of 1.2, and the difficulty of that item is minus 1.2. So, the probability of the right answer is 99. Okay? So, with that in mind, what are we doing right here is actually calibrating each question, each item. So, we are going to improve a lot our estimations.
We're going to improve also our confident intervals and many other properties. This The other thing that I want to explain here is theta and B is going to be a a pair of numbers that are distributed with normal distributions. So, we can actually interpret of them. For example, item of B equal zero means that is going to be average. Half of the um models in my data set are going to be able to answer that question 50% of the time.
So, that's going to be extremely helpful because right now to evaluate benchmarks, we need that reference compared with other models. So, it's better to have one uh by default with this methodology. Actually, this model is called item response theory, which is the evolution of classical test theory. Okay? So, on top of that, I'm going to have another parameter. It's going to be the a slope, that discrimination of that item.
So, high discrimination are going to have steeper functions. Also, we can have random functions, items that are not related with intelligence, which I don't want. But, something happens and even worse, we're going to have items that have negative correlation with the actual intelligence of the model. But, that keep that in mind because each item is going to be a difficulty level, B, and it's going to have a discrimination parameter here, A.
So, last thing that you need to understand is how can we estimate the intelligence level of a given model if we have IRT modeling item response theory. We're going to actually um go by one by one for each uh question here. So, I'm going to plot here on top its item curve and below you are going to see the relative likelihood of theta. That's the estimation of the intelligence. So, as you can see here we are going to use all curves to combine them in one distribution.
Over time, obviously with more questions we're going to have have a very better estimation. So, if we add all of them at the end, I'm going to have my final final estimation that is extremely nice to have a distribution here because I'm can have a likelihood interval. With with classical test theory is more complicated to be have. Okay? So, even with that with a sir scale with B and theta, even with the likelihood interval, if you think that this not this is not useful at all, let me show you one last example, okay?
Again, this is real data. So, I'm going to compare two models. Here is going to be on the left side Cloud Opus 4.1, yeah? That has 245 right answers. On the other side we are going to have Gemini 3 Pro, which has 247, okay? So, as you can see the difference here is quite small for 337 questions. But if you use item response theory, you can see that the difference between all of them is almost one standard deviation. That means Gemini 3 Pro is by far more intelligent.
Okay? Which makes sense because it's a uh later model, okay? So, as you can see, counting the number of right answers is is not a good approach because I can create benchmarks that are not calibrated and even if I get a lot of right answers, I'm not more intelligent than other models. That could happen, for example, if Gemini is able to answer by far harder questions uh if uh Claude is able to answer more of them, maybe Claude was able to answer only the easiest one.
So, the theta levels should be different. Okay, that's the that's actually what happens with IRT. You have better estimations, you have more parameters to define each item, which is going to be helpful later, and also you have, as you can see here, likelihood intervals. So, on top of everything, I'm going to show you a few applications that you can use with IRT. And I hope that you find them interesting. Okay, so the first application is going to be one of my favorite ones, actually, because you can apply this with one of the skills that I'm going to show.
It's going to take a few minutes if you have the data. And [clears throat] you can actually uh pick the best items, the best questions on your benchmark, and remove the other ones that aren't working or even fix them. Okay, so we can audit our benchmark. So, remember that we have two numbers that represents each item, each question. We have B, difficulty, and A, which is the slope or the discrimination of the item. On the right side here, we have very good items, very informative ones.
Here, close to zero, we have kind of noisy with little signal. And on the other side, we have items that we don't like at all, negative items. Here, for example, you can see that we have items that correlates uh the other way around, that better models are actually getting that answer wrong, which makes no sense. So, we can use this to actually find items that are significantly below zero, and we can actually flag them.
With that, I'm going to use another LLM to actually evaluate them. So, here you can see two items that I detect with that technique. The first one is actually I don't I don't know the answer. I ask ChatGPT. And apparently the gold answer, the answer that is on the benchmark, is not right one. Okay? So, this is okay. But the next example is by far more interesting for me because the answer is kind of right. So, it's something that a lot of people can miss.
So, here he's asking, "What is the total number of passengers?" The gold answer, the answer that is on the benchmark, is 583, which is the total people killed passengers plus crew. But the right answer, if you pay attention, I'm asking only about passengers, which is another number. So, again, with a very little effort, if you have the data set, you can actually find items that are mislabeled. This is the most common thing.
But sometimes they are not mislabeled, they are like bad items. So, you should remove them or even improve them. This second application for me is amazing. It saves a lot of time, a lot of tokens, and therefore a lot of money. Okay? So, um it's quite common for organizations to have their own benchmarks to evaluate which model is better for them. Especially with open source models. With that in mind, it's quite important to reduce the size of the benchmark to find the optimal size of the benchmark.
Before we couldn't do that because we didn't have any property of the item. But right now, with item response theory, we can actually pick the best items. Okay? So, this is a simplification, but we're going to say that items with high levels of discrimination are going to be the best ones. Okay? With that in mind, I can do this. So, again, real benchmarks with real data. Uh for for this benchmark, I'm going to target a 99% correlation with the original ranking.
So, it's going to be like almost perfect for many use cases. And what are we going to do speak one by one starting with the best item, the item with the highest A. So, with that methodology in mind, we're going to get that around 97 items compared with 484. That's almost 5x. We are going to have the same ranking than before or almost the same ranking as before. To be fair, I tried to do the same thing but randomly. So, if you pick items by random, you're going to observe uh by far worse performance.
So, it's extremely helpful. Maybe this is kind of uh weird for you because uh if we can evaluate items with by far less questions, why are actually using all the benchmark? So, and the answer for that is that we are not used to calibrate benchmarks. We are like assuming that more questions uh means better estimation, which is not true. For example, I can have two questions that kind of overlap. Their curves are are more or less the same.
So, even if I ask two of them, I'm going to get more or less the same information about your intelligence, okay? And also, there are a few items that you can notice that they are not extremely informative. They don't correlate with actual intelligence. So, you can reduce them or use them less. I'm not saying that you should remove uh like the the the rest of the data set, but you can use this for another application that we are going to talk that you can use a subset of items each time that you apply the benchmark, which is going to be extremely useful.
But uh be careful because that uh this does not happen on every benchmark, okay? So, for example, GPQA, which is a extremely well-designed uh data set, the benchmark here, as you can see, even if you pick at random, you're going to get more or less the same result. And the reason for that is that every item here is extremely discrim- discriminative and also they don't overlap. So, they are all of them are useful at every time along the benchmark, okay?
So, now given that we have for each item one function, we can also calculate the error, the unexpected behavior, the outliers for each question, which is going to be amazing for many applications. We can actually find out if we are leaking information, if we are overfitting with the benchmark, and other kinds of contaminations. So, let me go back to the matrix that we started with. >> [clears throat] >> And as you can see, every question is going to have the estimation and the actual answer.
And that's good because we can observe a few outliers here. For example, the minute three pro should be able to answer that question. Actually, our model says that 80 size 86% of the times Gemini should be able to answer that. But even with that, uh that question is wrong. I cannot say why, but I can actually detect those outliers, those weird patterns, okay? And with that in mind, we can actually calculate the residuals, the error for that specific question, which is going to be a useful for different applications that I'm going to explain later.
The other way around, we can actually see here that for example, deep seek R1 is having here a right answer even if it's not expected, okay? Again, that does not mean that uh we are overfitting or anything. Actually, we can sample the same question more than once, so we can average them together and maybe with that we can like resolve that outlier. But in any case, we have a new tool that we can use to analyze the data.
On top of that, actually in psychometrics, we have a few techniques to see if the behavior is consistent, if that makes sense, okay? So, for example, here, I can observe that O4Minnie is the less consistent one. You can see that has a lot of red uh a lot of green questions here in the middle, which makes no sense. So, you should be able to use that that to, for example, detect if your inference platform is not working well.
Because uh if your for whatever reason your inference platform is not actually running the models or the quantization is actually wrong, you're going to observe things like that, behaviors that are not expected, okay? Should be consistent. It's this matrix is not perfect, it's going to have noise, but we should be able to more or less estimate a level of intelligence given that we can predict more or less what questions are you going to get right at what question are you getting it are you going to get it wrong.
Okay? Again, residuals are going to be extremely helpful for the next application. But only with this, I think you can actually look at the data in other [clears throat] way. Okay. So, let's say that you are building a benchmark, a very complicated one, very expensive one. So, you don't want that benchmark to be leaked on the internet. Neither you want other organizations to train their models with that benchmark, okay?
Because it's extremely valuable and if you can't protect that benchmark over time, it's going to be more valuable. So, with that in mind, we can actually use what we call adaptive testing, okay? What is that? I'm going to pick a random set uh of items that are going to be representative of my benchmark, and I'm going to call that an anchor set. An anchor set should be representative of my entire benchmark, and I'm going to use those items with every applicant, with every model from any organization that I'm working with.
But for every organization, I'm going to pick uh one individual set. I'm going to call that fingerprint set that I'm going to show only to that specific organization. And I can do also the same thing with another one. Pay attention to this because it's important that I pick extremely complicated items from my benchmark for those fingerprint sets. Over time, let's say a few months later, uh every organization is releasing their new models, and I'm going to observe I'm going to like run the benchmarks again, and I'm going to use residuals to uh see if those models are extremely good at those specific questions.
So here, this is a synthetic data set. You can see that the average residual for that organization for that a specific fingerprint set is extremely unlikely. So this is not bulletproof, but this is a extremely good technique that you can use to protect your benchmarks. As you can see here, the average residuals for one organization is by far bigger than the other one. In psychology, it's really important to find out if one of our items are actually biased against one specific group.
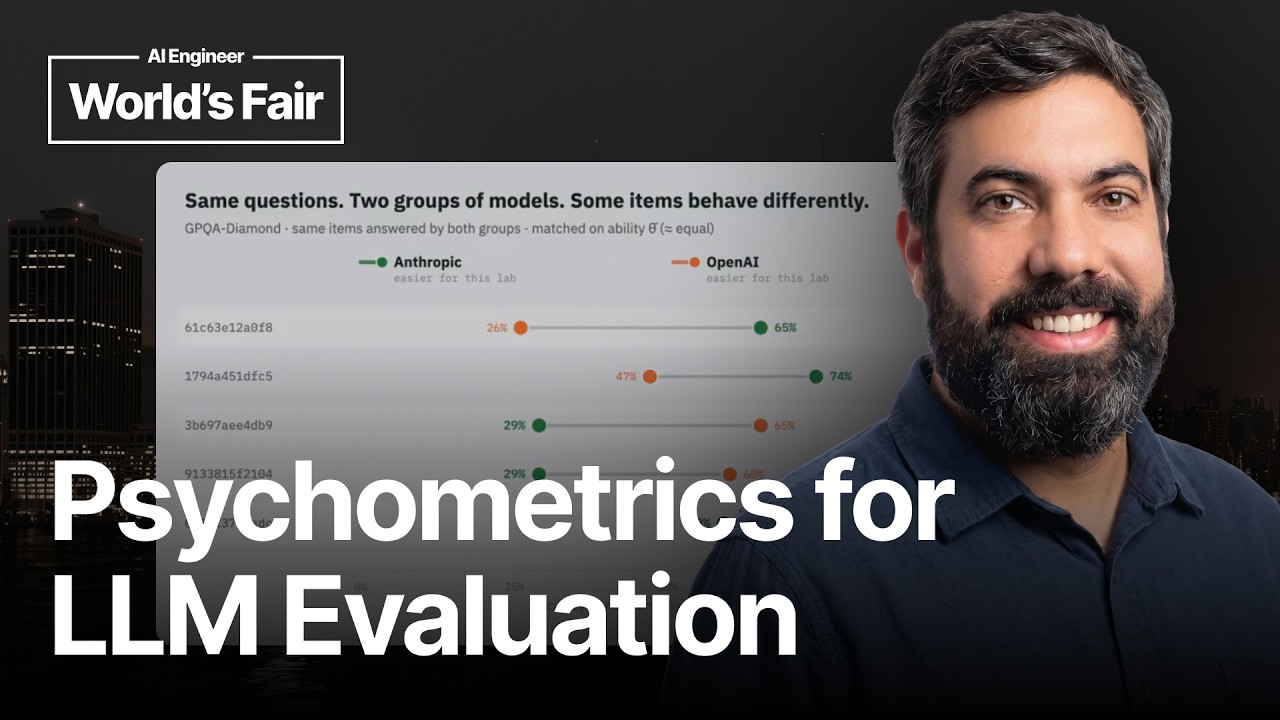
We can use the same techniques to research how models behave with items. So I'm going to show you that with one example. I'm going to split the data set in two groups. In this case, I'm going to use open weights and closed weights. You can use whatever variable that is interesting for you, and even you can create more than one group. After that, I'm going to for each item create two different curves for each group. And what we expect if the item is unbiased is that both lines are kind of overlapping.
If not, we are going to calculate this difference, the gap between those ones, and that difference should be zero or close to zero. In this case, we can detect we can apply that technique to all items on my benchmark, and actually we can find out that there are few items that are better for closed weight of models and better for open weights models. I'm not going to show the items because I don't want to leak them on the internet, but if you apply this technique to a real benchmark, you can actually notice a few patterns there.
There are a set of questions that have something in common that are better for open weight models. I cannot pinpoint the real reason for that, but I can say that this technique could be used to understand how they train their models. The last application that I'm going to show you is kind of interesting. It's the most complicated one, but in a way is the most interesting one. So, I'm going to use the residuals to actually have a DNA, a fingerprint for models, and the idea is that we can actually look at them and see if two different models are related somehow, okay?
So, I'm going to make a correlation matrix here, and also I'm going to make a super simple projection. So, the first thing that you can notice is that there are a few models that are extremely close here, that they are from the same lab, and also they have the same history there. Like different versions for the same model. Also here, you can observe we have Deep Seek, different distillation of Deep Six. We have also Queen.
So, we can observe some kind of patterns there. It makes sense because if a model has a similar history with other model, we can expect the same kind kind of errors, okay? And let Let you a few examples. The first one is going to be this one. Uh if we have two models that have the same base, we expect high correlations between them. In this case, we have .38, okay? Also, we can observe that between distillations and its base model, which could be extremely interesting if you want to detect distillation of your model uh without consent.
Also, we can detect detect the same model with different effort levels, which makes sense because it's almost the same thing. And also, we can say uh we can actually detect if we have different versions or evolution of the same model. Here, we have Llama, but also work with Gemini here, okay? So, again, this is not as useful as others for day-to-day, but I think this opens an area of research to understand how models are related with each other and even detect distillations.
I really hope that you find inspiring this talk. My goal here was to open the gates of uh psychometrical research for LLMs. I think we can improve a lot how we benchmark LLMs with very basic maths here. But there are a lot of uh ideas that you should explore because I didn't have time. The first one is multidimensionality and hierarchical models. I'm expecting if we apply them to LLMs to see different skill levels for different kind of task.
Also, we can merge different benchmarks to improve the estimation of each one of them. Makes sense if you have IRT. And also, this has been done in a in a research paper called Meta-Benchmark that I highly recommend you to read. Also, we can add another signal that we think correlates with intelligence, for example, latency or tokens. And another very promising idea is to use psychometrical models to actually measure alignment and use that for also interpretability.
I think mechanistic interpretability could help a lot psychometrics here. I'm working on all those areas. If you are working on them or you have any idea or you need help to apply them to your benchmark, let me know. Thank you for your time and here you have all the materials, skills, and benchmarks so you can play around with them.
The words are the caption track's own and nothing is reworded or re-transcribed. Paragraph breaks are placed between sentences so the text reads as prose.
Free tools for your own script. No signup, no login.
Paste your draft and see where viewers are likely to drop off, with a rewrite for each weak line.
Paste the first 30 seconds of your own draft for a hook score and rewrites.
Check your draft against YouTube's advertiser-friendly guidelines before you record it.
Read this channel's public videos and transcripts, and download a writing brief for it.