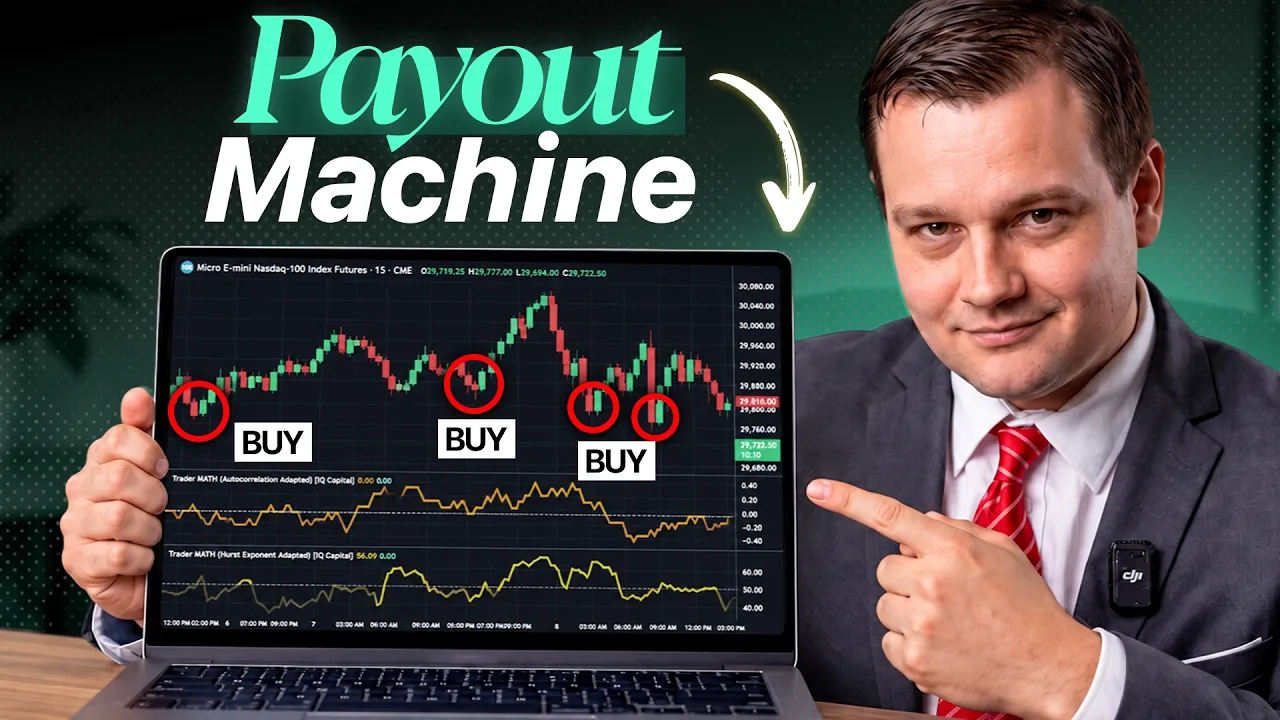
This Guy QUIT His Job for PROP TRADING. So I STOLE His Strategy transcript
IQCapital · @IQCapital_io
Words
3,605
Runtime
25:29
Speaking pace
141wpm
Reading time
15min
141 words per minute, below the 160 25th percentile of 349 measured videos. That distribution comes from the 349-video hook study.
Opening (first 30 seconds)
I reverse engineered and back tested the strategy of a prop trader that just quit his job and is making $33,000 per month at my prop firm. Now, hold on. That's not necessarily a responsible thing for someone to do, but this guy is pulling it off. And in this video, I'm going to break down step by step the exact strategy that he's using to do it. Just so it's
71 words, the words spoken in the first 30 seconds at 141 words per minute.
Sentence shape
| Measure | This transcript |
|---|---|
| Sentences | 253 |
| Average words per sentence | 14.2 |
| Longest sentence | 73 words |
| Questions asked | 3 |
| Sentences containing a number | 50 |
Most used terms
- price27
- five23
- hurst23
- atr22
- bar21
- music21
- trader21
- math20
- strategy19
- trader math19
- exponent18
- autocorrelation17
Filler phrases
33 in total: like 18 · actually 10 · kind of 3 · I mean 1 · you know 1.
A literal whole-word count of the same phrase list the Prepublish browser extension uses, so a phrase inside another word is not counted and a phrase used in its ordinary sense still is. It is a count and not a judgement.
What this transcript is
Every word below is the caption track YouTube publishes for this video, pulled from the video itself and reproduced unchanged. It is not Prepublish's writing, not a summary, and not a re-transcription: it is the video's own published captions. English captions, generated automatically by YouTube, in the video’s original language. Source: the video on YouTube. A channel that would rather this page did not exist can ask for its removal through the contact page, and it is removed.
Transcript
I reverse engineered and back tested the strategy of a prop trader that just quit his job and is making $33,000 per month at my prop firm. Now, hold on. That's not necessarily a responsible thing for someone to do, but this guy is pulling it off. And in this video, I'm going to break down step by step the exact strategy that he's using to do it. Just so it's clear, this guy gave us permission to share his strategy with you in this video.
Here are his numbers over the last 22 days alone. $33,95 total P&L, $4.03 profit factor, $126 trades. I'm going to show you everything he does in three stages. The entry model, the exit model, and the riskmanagement process. And this is where the strategy gets surprisingly sophisticated. It's using the Hurst exponent to identify the market regime, then autocorrelation to measure the structure inside that regime. Mathematically, that's actually pretty elegant.
If you try to reproduce this strategy with AI, it won't be correct. [music] You'll see why later. But I did make an indicator for this strategy that I'll show you how to get in this video. For the sake of anonymity, we'll call this guy trader meth. And obviously, nothing in this video is financial advice. Some of this does get a little technical, but don't worry, I'll break it down into simple terms and give you an easy way to [music] understand exactly what the strategy is doing.
First thing, I tested this strategy across ESNQ, the micros, and other traditional futures, plus a little bit of Bitcoin. Personally, I liked all of it. Now, from what he told me, he uses this strategy exclusively on the 15minute time frame, but there's no reason why this system would fail on something like the 30 minute or even higher. Now, this strategy can be described as hybrid swing trading. I'm sure you've never heard this before.
That's because I just came up with it right now, but it is perfectly descriptive of what you're about to see. First, we have to understand what the Hurst exponent actually indicates. And do not skip this part because even if you never use this strategy, there's an important distinction here. Most indicators tell you something about where price is or what it has recently [music] done. But the Hurst exponent is trying to tell you something about the behavior of the price process itself.
More specifically, this is looking at how variation scales over time and whether a series exhibits persistent, random walk-ike, or anti-persistent behavior. Obviously, if I'm trading a trend, I want persistent behavior. If I'm trading a mean reversion, as an example, I want anti-persistent behavior. But most of the time, the market's doing this one. Now, drop back down to the Hurst exponent. This upper red horizontal line will be marked one.
Right in the middle here will be 0.5 and here at the very bottom is zero. Now for a simple heruristic around 0.5 is more consistent with random walk-like behavior. So if the Hurst exponent is sitting right in the middle of its range, this generally means anti-persistence and persistence are not necessarily statistically identifiable. Instead, random walk-ike behavior is the current statistical structure of the time series.
The time series just being price data. [music] Now above 0.5 ideally towards one here relative to how the Hurst exponent is calculated this generally indicates that the current price series is exhibiting persistence. Obviously if we're trading a trend that is great and below 0.5 down here towards zero the price series is currently identified as exhibiting anti-persistence. As I already mentioned, most indicators describe recent price behavior itself.
Hurst exponent is trying to characterize the statistical structure of that price movement. It's a little more mathematically elegant than something like RSI. Now, Trader Math did adapt the Hurst exponent here slightly. He's using a Hurst proxy, and don't worry too much about remembering this, that compares the price range to volatility. The interpretation though is generally the same. Higher values means price is moving more persistently relative to its normal volatility.
Now trader math wants his adapted Hurst exponent to be greater than 0.5. That is condition number one. Hurst greater than 50. Now I know 0.5 is here. That is generally what's used but this version is scaled up to 50. So, trader math, we'll call him TM, is using 50 instead of 0.5. Obviously, that means one is instead 100 and zero is still zero. Now, in simple terms, he wants price to be behaving more like a persistent trend than random chop or anti-persistence.
But here's where it gets interesting. All this is going to disappear. Now even if you never use this strategy, this is still a concept absolutely worth understanding. Now autocorrelation is a wellestablished concept in statistics and academia that is used to measure whether a time series such as price data, specifically price returns, tends to repeat or oppose its own past behavior. Kind of like what we just looked at with the Hurst exponent.
So, autocorrelation measures how much a series resembles its own past behavior. There's a lot more we could go into this, but it would take an hour or two. Now, unfortunately, a lot of traders describe price as trending like this by just looking at a chart and seeing it go up. However, autocorrelation gives us a statistical way to test whether price movements are actually showing persistence rather than just looking like they are.
That is awesome. Trader Math is comparing price direction now with price direction five bars ago. That's the blue. And he does this across the last 20 bars. Obviously there are some specifics about how autocorrelation is measured that we are glossing over here for the sake of simplicity but trust me this is enough to know for now. Now generally the autocorrelation coefficient when measured is going to look like your standard oscillator at least to the untrained eye.
So it goes beneath the chart and tends to look something like this and I'll show you later. Now for scaling similar to Hurst we do 1 0 and -1. Now in this context -1 this generally is indicative of directions tending to oppose each other. Zero usually signifies no clear relationship and plus one signifies directions tend to repeat. Similar to those three images I showed in the Hurst exponent where we had persistence, random walk-like behavior and anti-persistent behavior, autocorrelation is very similar in that sense where I could recreate those three images and they would be applicable to this scaling and these numerical indications the coefficient itself.
So, Trader Math wants a market that is uptrending overall, which is what the adapted Hurst exponent is measuring for him. But inside of that overall uptrend is still some form of shorter term rotation, which is what he is using autocorrelation for at this lag. We're not going to go into what I mean by lag. Don't worry about it for this video, but the measurement trader math wants to have autocorrelation be at is negative 0.1.
This is very, very, very slight anti-persistence. So, let's pay attention back to this event. Hurst exponent over 50. Let's say right here for instance first exponent is over 50 here on autocorrelation we'll draw our zero which will not be perfect by any means but autocorrelation let's say right here is0.1 Hurst is over 50 whatever the exact price is at the time that these two measurements match up Now we have the green light or trader math has the green light to potentially take an entry.
The market conditions or statistical structure is now set. But and this is important and I kept it secret from you just cuz I felt like it. There is one last condition that serves as the final entry trigger. The previous five bar high price must be broken out of. So let's say Hurst is over 50. That's what we need. Autocorrelation 0.1 or even lower. This red line is our five bar high inside of this shorter term rotation inside of a larger uptrend.
As soon as this five bar high is broken out of price closes above it the previous five bars. Obviously, if price moves up and breaks this five bar high, it's going to create a new high. Don't worry about that. Focus on previous five bar high that does not include the current bar. As soon as this is closed over while Hurst is over 50, autocorrelation is negative 0.1 or less. This is the long entry signal that trader math uses.
And he describes this as confirming that the internal rotation is [music] starting to resolve back in the direction of the broader trend. Those are his words, not mine, but they do logically check out. Of course, this long entry is executed as a market order at the close of the bar with this breakout being the trigger. So, let's say Trader Math saw this and did take his entry. So, he has fresh long exposure. As for the exit model, unfortunately, it's completely discretionary, which means everything I show you here relies on his personal interpretation and will not be a perfect reconstruction of how he operates.
But he did give an objective version of this exit strategy because I needed something to test. For the objective version, he uses a five ATR target and a 4 ATR trailing stop. Why these numbers? It was already getting water out of a rock just to get this objective version in the first place. So, don't ask me. But I did test it. So, don't think it's a bunch of fooy. Let's keep going. Now, first we need to understand what ATR actually is.
A lot of you watching probably already know this, but it doesn't matter because if someone doesn't, well, I need to explain it. Now, ATR is really just a very practical measure of volatility. It's not the most mathematically elegant, but it is extremely practical for everyday traders. Something easy to find on a chart or any charting platform and to use for calculating the distance of a target or a stop. So, let's say this is the NASDAQ.
If the NASDAQ is moving 20 points per candle, ATR which we will draw down here will be relatively low. But when the NASDAQ starts moving 100 points per candle, ATR starts to rise. This is because volatility is increasing in the way that ATR measures it. So if we have this smaller candle here, ATR is going to be pretty low on a candle like this. But if every candle starts looking massive just like this, ATR [music] is generally going to be higher and importantly ATR does not care about price direction.
Big moves up or big moves down both increase ATR's measurement. It's trying to measure the magnitude of movement. So a 20 period ATR which is what specifically trader math told me he would use in the objective version that is essentially asking us how much has price typically been moving per candle recently because a 50point move let's say here [music] might be enormous in a compressed market let's say we make a 50point move here but in a volatile market such as here that move might [music] be completely normal.
ATR gives us the context to know that difference. Again, this is on any charting platform. It's not some big secret. So, all this strategy does is find the exact entry price, then looks at the ATR indicator. Let's say it's currently $30. Wherever my entry price is, I need to take the current ATR of $30, and multiply it by five. That's how he's using the target. Obviously, that's 150. [music] So, I would go up $150 from the entry, and that is going to be the target.
Now, on the stop loss, he's using a scale factor of four. So, I would take 30, multiply it by four. That is obviously 120. Then I would go down from the entry, $120. That would be my [music] stop. I will show you this on the chart. Now, this is very important. This is a trailing stop, not a fixed static stop-loss. I'm sure almost everyone watching knows exactly what that means. But just in case, if price continues to move in the direction of trader math's long trade, automatically, you don't need to do this.
The stop-loss will move up with price by the highest high reached during the trade. This is a much more trend following friendly exit mechanism because it protects profits while still allowing the trade to continue so long as direction is moving in favor of the trade. >> Ever thought about getting into prop trading? Perfect timing. Right now, we have the perfect offer for you. You can grab a futures challenge or crypto challenge for just 9 bucks.
Links in the description below. Now, back to the video. Now, this is important. Obviously, IQ Capital limits the loss on any single position to 0.5% of the starting balance on a funded account and 1% during the challenge. So, a competent approach to this objective rule set is adjusting position size based on whatever ATR currently is. That means higher ATR means a wider stop, which means fewer contracts. Lower ATR, such as here, means potentially trading more contracts.
Here's how simple that math is. Five MNQ contracts are worth $10 per NASDAQ point. So, a 40 point stop risks roughly $400, but an 80 point stop risks roughly $800. Same five contracts, twice the stop distance, twice [music] the risk. So adjusting the contracts to make sure the stop doesn't violate IQ Capital's maximum position loss rule, that is really smart. But before I show you the back test and share what I think is the most important part of this strategy, spoiler alert, I haven't even talked about it yet.
I want to take one of his actual trades and reconstruct it. because if what he told me is accurate, we should be able to calculate his entry target and stop all on our own. Now, here are two actual trades that trader math took. But first, these two lines, they're everything we just talked about. This red line here is the adapted Hurst exponent, [music] and this green line down here is the slightly adapted autocorrelation.
Yes, you can find these link in the description. Now let's pay particular attention to this long entry. Condition number one, Hurst exponent must be greater than 50. We can see that is true right here. The Hurst exponent at this time was right at about 5940. Condition number two, autocorrelation coefficient must be0.1 or less. Specifically on this bar, the autocorrelation coefficient was measuring.2. two. [music] You can see that right here.
So, condition number two was also true. The final final final condition here is that the five bar high over the last five bars, the five bar range must be broken to the upside. [music] And if we zoom in, this one might look a little confusing, but it's actually quite easy. This blue line right here tracks [music] the highest high over the last five bars. You can see this red bar made a high and this blue line stayed anchored to it continuously until it was no longer in the five bar range.
So it became the sixth bar. Now on this specific green candle, this old red bar out of the five bar range and the new five bar high was this red candle. I know they're not exactly connected, but we could draw a line here to show and it's actually this small dogee looking candle here. This was the new five bar high. This five bar high was in place while the Hurst exponent was above 50 and autocorrelation coefficient was at0.1 or less specifically 0.2 for this.
Now, this green candle that finally made a move up after the shortterm rotation during the broader upside persistence, this broke the five bar range high and right at the close or the open of the very next bar, trader math took a long entry [music] here. All three conditions are now true. this five bar highest high indicator. This probably won't be in the description, but this is something you could easily find on probably multiple trading platforms.
Now, once this entry is taken, again, Trader Math uses a discretionary exit system and position sizing, [music] but still the entry model itself was definitely something interesting to learn in this video. Now I specifically use as I mentioned the ATR target and ATR stop five and four in this objective model. Those are the numbers he gave me and you can see that an exit was taken all the way up here for a target. This is not where trader math exited but the objective version did exit here.
And the same rules pretty much happened on this trade as well. an entry that trader math took with all the conditions met. Thankfully, price [music] did move up. It looks like this target kind of sniped the high. That's [music] luck. That is lucky. Let's not pretend we knew that that was going to perfectly happen. And trader math probably didn't exit right here either. Maybe earlier or later. Maybe he even got stopped out here.
He manages everything with discretion. Now, finally, even though you can't see it in these long trades, there is a 4 ATR trailing stop trailing the long position. So, if that ends up getting hit, that is the objective exit. And of course, the same happens with the profit target, but it does not trail. It is not dynamic. It is just fixed and static. Both are calculated right when the entry is taken using the method I showed on the whiteboard with terrible handwriting.
But obviously one trade means absolutely nothing. As you can see, I coded the objective version of this strategy and made the computer take every single trade. And this is where we can finally answer the more important question. Does this idea hold up when we do not cherrypick examples? Now, obviously, this is just historical testing. This is not financial advice. And just so we're clear, I did run this testing using a more powerful programming language than Pinescript, but for the sake of simplicity and something that's easy on the eyes, we're going to look at the simple Trading View back test.
Now, for the test, voila. I must say it's actually quite impressive. Not financial advice. The equity curve, although it does go through periods of stagnation [music] like any system does, has shown it is able to recover. Maybe it takes advantage of beta here or there, but you get the point. Recently, looks like we're in a little bit of a rut with this system on the equity curve, but again, trader math uses discretion with the exits.
So, he's been doing really, really well recently that way. While the objective version has been a little more stagnant regardless, 1.381 profit factor, which over 486 trades is quite respectable. 44% win rate. The match draw down got up to $4,172 which is technically above the 0.5% threshold for a maximum position loss that IQ Capital implements. And then we have our total P&L over here. This is only on MNQ 15minute chart.
I did test in Python ES MEES some other stuff. Generally this model looked mostly similar in testing. Obviously, MEES, MNQ, NQ, all of this is generally going to be positively correlated. So, this kind of trend following strategy specifically, not necessarily something micro structure. If a trend following strategy like this shows favorable historical performance on one of those assets, usually it's going to apply on the other positively correlated assets as [music] well.
So long as that positive correlation remains strong microructure and stuff, okay, that's where it starts to change. Now for the most important piece of this strategy, trader math does scale out of his positions as the trend develops only sometimes. I actually saw him closing out his entire position in one order many times. And what he does is he actually scales into his position on pullbacks. So as he's in a position and persistence, we like that word now, develops during these pullbacks, he actually scales in and can add to his position.
This essentially lets him compound the position more and more and more as it continues moving in his favor. This is not necessarily an easy thing to do. As a newbie, this would be very difficult. And unfortunately, I do not have an objective process for this. He does this with discretion based on his own personal interpretation on the fly of what currently constitutes a pullback and what I guess is going to be a complete reversal.
And just so you know, this scalein method is not compatible with the objective version I created and showed you the test for because that version uses a 5 ATR target. So the entire position closes no matter what. But again, still worth knowing that he does do this. Again, I left a link to the indicators in the description below in case you are interested. You can get started with your first challenge for as little as $9 at IQ Capital.
Built by traders for traders.
The words are the caption track's own and nothing is reworded or re-transcribed. Paragraph breaks are placed between sentences so the text reads as prose.
Use this transcript
Three free tools that work on the material around a video like this one. No signup, no login.
Hook Analyzer
Paste the first 30 seconds of your own draft for a hook score and rewrites.
Policy Pre-Flight
Check your draft against YouTube's advertiser-friendly guidelines before you record it.
Channel Skill Generator
Read this channel's public videos and transcripts, and download a writing brief for it.