Getting the transcript
Reading the captions from YouTube. A video nobody has opened here before takes 10 to 30 seconds; this page fills in on its own.
Getting the transcript
Reading the captions from YouTube. A video nobody has opened here before takes 10 to 30 seconds; this page fills in on its own.
Pro Trading School · @protradingschool6692
Where viewers went back to watch this video again, from YouTube's public Most replayed graph, lined up with what was said at that moment.
Most replayed moment #1
10:202.1x the video's typical replay level
trading time frame switch to the higher time frame to ensure your trade plan aligns with the market Direction on the higher time frame all right let me show you a real chart example on the 15minute chart you notice a clear Supply Zone forming
Said at 10:14
Most replayed moment #2
8:412.0x the video's typical replay level
reward ratio here's the deal only trade zones that give you at least a 3 to1 risk to reward ratio now that you know the criteria for a quality Supply or demand Zone let's
Said at 8:36
Most replayed moment #3
12:532.0x the video's typical replay level
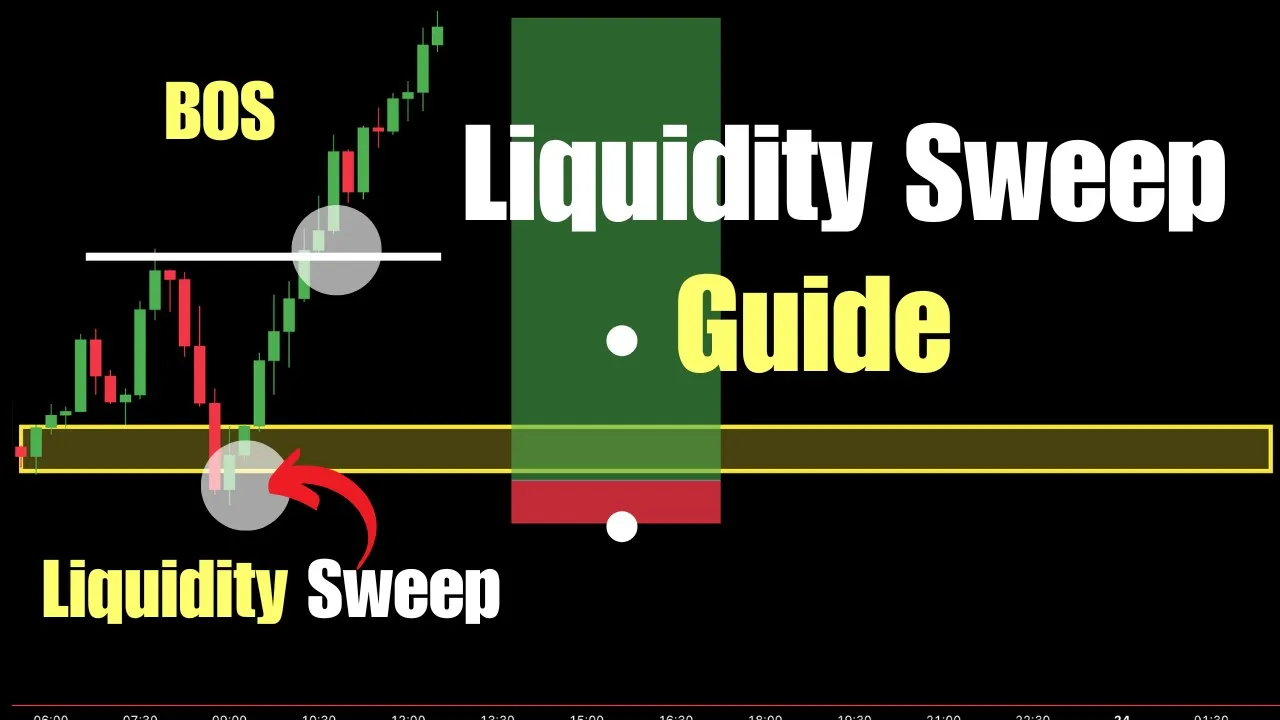
light to prepare for the trade now that the liquidity sweep has occurred and the price has closed back inside the supply Zone it's time to check the higher time frame for confirmation this step ensures that your trade aligns with the broader Market structure on the hourly chart the market was
Said at 12:45
The graph counts replays. It does not show where viewers stopped watching.
Words
2,423
Runtime
14:58
Speaking pace
162wpm
Reading time
10min
162 words per minute, between the 160 25th percentile and the 181 median of 349 measured videos. That distribution comes from the 349-video hook study.
Opening (first 30 seconds)
hey traders in this video I'm going to reveal a liquidity sweep strategy that works on all time frames and follows the principles of smart money trading this is the strategy that can take your trading to the next level by aligning you with the moves of the biggest players in the market here's what you'll learn how market makers trap you you'll uncover their strategies and learn how to avoid falling into their traps the market maker model you'll understand
81 words, the words spoken in the first 30 seconds at 162 words per minute.
Free, no signup. See how the first 30 seconds hold attention, with rewrites.
Sentence shape
| Measure | This transcript |
|---|---|
| Sentences | 1 |
| Average words per sentence | 2423.0 |
| Longest sentence | 2,423 words |
| Questions asked | 0 |
| Sentences containing a number | 1 |
Most used terms
Filler phrases
9 in total: like 8 · you know 1.
A literal whole-word count of the same phrase list the Prepublish browser extension uses, so a phrase inside another word is not counted and a phrase used in its ordinary sense still is. It is a count and not a judgement.
What this transcript is
Every word below is the caption track YouTube publishes for this video, pulled from the video itself and reproduced unchanged. It is not Prepublish's writing, not a summary, and not a re-transcription: it is the video's own published captions. English captions, generated automatically by YouTube, in the video’s original language. Source: the video on YouTube. A channel that would rather this page did not exist can ask for its removal through the contact page, and it is removed.
hey traders in this video I'm going to reveal a liquidity sweep strategy that works on all time frames and follows the principles of smart money trading this is the strategy that can take your trading to the next level by aligning you with the moves of the biggest players in the market here's what you'll learn how market makers trap you you'll uncover their strategies and learn how to avoid falling into their traps the market maker model you'll understand how they act and how to spot their moves before they even happen how to identify liquidity sweeps you'll learn to recognize Market maker liquidity sweeps and how to check if they're real or fake real chart examples you'll see the strategy in action step by step from analysis to profit this strategy works for scalping day trading and swing trading it's also effective across various markets including Forex crypto stocks Commodities and Futures with that being said let's get started market makers know how you trade they understand the patterns you trust and the double top is a perfect example price hits a resistance level twice struggles to break higher and starts reversing you think this is it a clear signal to sell convinced you enter a short position and place your stop loss just above the resistance level but here's what's really happening market makers are deliberately letting the resistance level hold just long enough to attract sellers like Q they know exactly where your stop losses are clustered just above the double top when enough Traders have entered the price suddenly surges upward breaking through the resistance this isn't a breakout it's a liquidity sweep market makers trigger stop losses to create the liquidity they need to fill their own sell orders at higher prices once they've collected liquidity the price reverses sharply and drops in the direction you originally expected but now you're out of the trade watching the market move without you the double bottom is a pattern most retail Traders trust it looks like a strong foundation for price to bounce higher when the price tests a support level twice you think this is solid support it's time to buy you enter a long trade and place your stop loss just below the support level confident it won't be broken but here's the reality market makers know this is a popular pattern among retail Traders they allow the support level to hold just long enough to attract buyers and cluster stop losses below the double bottom creating a liquidity pool when the time is right the price dips below the support level triggering your stop loss and causing panic selling however this isn't a real breakout market makers use the liquidity from your stop losses to buy at a discount and fill their orders once they've collected enough liquidity the price reverses sharply and moves higher leaving you out of the trade and wondering what went wrong wrong even though you followed the pattern perfectly trend lines are a go-to tool for many traders to identify Market Direction and plan entries they appear clean logical and reliable but here's the truth market makers know how you use them and they use that knowledge to trap you you see the price respecting a trend line touching it multiple times with each touch your confidence grows and you decide if the price touches the trend line again I'll enter as the price approaches the trend line you place your trade and set your stop- loss just beyond it thinking it's a safe spot but here's the issue you're not alone many Traders are using the same trend line placing their stop losses just beyond it market makers recognize this predictable behavior and see an opportunity to create a liquidity pool instead of bouncing as expected the price breaks through the trend line your stop loss is triggered and you think it's a trend line break I was wrong wrong but this isn't a genuine break it's a liquidity grab market makers use the liquidity from triggered stops to fill their own positions once they've collected enough liquidity the price reverses and resumes the trend you originally anticipated but now you're out of the trade and the market makers have taken control now let me show you exactly how market makers use support and resistance levels to trap retail Traders and take their money you spot a support level where the price has bounced several times it looks reliable so you think this level has held before it's safe to buy here as the price approaches the support again you place your trade and set your stop loss just below the level confident it's protected but here's what really happens market makers see your support level as an opportunity they know retail Traders cluster their stop losses just below it creating a liquidity pool the price suddenly breaks below the support level triggering your stop loss you are assume the support has failed and the market is breaking down but in reality it's a liquidity grab market makers use the liquidity from your stop losses to buy at a discount and fill their positions then the price reverses sharply and moves higher just as you originally expected but now you're out of the trade and the market makers have capitalized on your loss now let's look at resistance you spot a level where the price struggles to break above and it looks strong you think this is the perfect spot to sell you enter a short trade and place your stop loss just above the resistance level expecting it to hold but just like with support market makers use this resistance level to their advantage they know sellers are clustering their stop losses just above the level creating another liquidity pool the price suddenly spikes above the resistance triggering your stoploss you think it's a bullish breakout and might even flip your trade to go long but this isn't a real Breakout it's a fake move designed to collect liquidity once the stop losses are swept the price reverses sharply and drops moving in the direction you originally expected but you're no longer in the trade market makers don't trade like retail Traders they can't place massive orders all at once because it would disrupt the market instead they spread out their orders over time creating supply and demand zones areas where price frequently reacts if there aren't enough buyers or sellers to fill their orders market makers manipulate these zones to grab liquidity here's how it works when market makers want to buy they create a demand Zone by placing smaller buy orders causing price to bounce higher if they need more sellers they temporarily push the price below the Zone this triggers stop losses of traders who bought there and attracts new sellers creating the liquidity market makers need once their orders are filled the price shoots back up when market makers want to sell they create a supply Zone by gradually placing sell orders causing price to reject and drop if they need more buyers they push the price above the Zone this triggers stop losses of traders who sold there and attracts new buyers creating liquidity once their orders are filled the price drops sharply so our strategy is built around two key elements supply and demand zones and liquidity sweeps however ever before diving into how to trade this setup it's crucial to ensure that the supply or demand Zone you're focusing on is genuinely created by market makers this distinction is what separates high probability setups from less reliable ones over the years I've developed a set of proven criteria to pinpoint exactly where market makers are operating let's break them down step by step candle size of the move here's what you need to watch for large bold candles all moving in the same direction these are the footprints of big institutions clear signs that market makers are active freshness of the Zone here's the Golden Rule stick to zones that have never been tested before the first test of a zone is where the magic happens it's the most reliable and offers the highest probability of success break out of structure here's what you need to focus on look for moves that break significant levels like previous highs or lows when you see this combined with strong momentum it's a clear sign that market makers are in action risk to reward ratio here's the deal only trade zones that give you at least a 3 to1 risk to reward ratio now that you know the criteria for a quality Supply or demand Zone let's move on to the trade setup the first step is spotting the demand Zone these zones form because big institutions like Banks and hedge funds can't buy their entire position all at once it would disrupt the market and push prices too high instead they buy gradually creating a Zone where price repeatedly bounces higher here's the critical moment in this strategy the liquidity sweep when the price dips below the demand Zone it triggers the stop losses of traders who entered too early this process generates the liquidity that large institutions need to complete their remaining buy orders after this sweep the price often closes back inside the demand Zone this is a clear indication that institutions are ready to push the market higher this strategy works on all time frames but it requires proper top-down analysis if you're trading the 5 minute or 15minute chart your higher time frame is the hourly chart if you're trading the hourly chart your higher time frame is the daily chart for the 4-Hour chart use the weekly chart as your higher time frame and if you trade the daily chart your higher time frame is the monthly chart once you spot a trade on your trading time frame switch to the higher time frame to ensure your trade plan aligns with the market Direction on the higher time frame all right let me show you a real chart example on the 15minute chart you notice a clear Supply Zone forming this zone is created because big institutions are gradually placing sell orders causing prices to drop significantly from that area all right now let's confirm that the supply Zone meets all the necessary criteria this step ensures the zone is valid and worth trading candle size of the move look at the candles in the drop from the supply Zone they are large and consistent in size with no hesitation or Wick this tells us that institu were actively involved in this move the candle size confirms strong institutional activity freshness of the zone now check if the Zone has been tested before it's clear that this Supply zone is fresh and untouched meaning institutions haven't returned to this level yet the zone is fresh making it highly reliable break out of structure take a look at the market structure the drop from the supply Zone broke a significant previous low on the 15-minute chart this structural break confirms that institutions are driving the price lower the breakout of structure validates institutional control risk to reward ratio the setup offers a 4:1 risk to reward ratio meaning the potential reward is four times your risk the risk to reward ratio is excellent and meets our criteria without every Criterion met this Supply zone is confirmed as a high probability setup now patiently wait for the price to retrace back into the Supply Zone as the price approaches keep an eye out for signs of a liquidity sweep to Signal the entry as the price retraces into the supply Zone something critical happens it briefly breaks above the Zone before closing back inside the Zone this is what we call the liquidity sweep and it's a vital signal for the trade institutions intentionally push the price above the zone to trigger the stop losses of early Sellers and trap buyers who think the market is breaking out upwards this action creates the liquidity they need to fill their remaining sell orders once the price closes back inside the supply Zone after the liquidity sweep it signals that institutions have finished Gathering liquidity and are ready to push the market lower this is your green light to prepare for the trade now that the liquidity sweep has occurred and the price has closed back inside the supply Zone it's time to check the higher time frame for confirmation this step ensures that your trade aligns with the broader Market structure on the hourly chart the market was rejected from a major resistance level and is likely to go down and retest the major support level this aligns perfectly with our trade setup on the 15-minute chart however take a closer look at how the market trapped retail Traders at the major support level it swept their stop losses before moving up and at the major resistance level the market maker swept stop losses placed above the resistance this highlights that trading is fundamentally a liquidity Sweep game all right now let's return to the 15-minute chart with all confirmations in place it's time to set up the trade place your sell order at the candle that closed back inside the supply Zone after the liquidity sweep this ensures your entering with institutional backing set your stop loss just above the high of the liquidity sweep this protects you from any unexpected moves while keeping your risk minimal Target the next demand Zone on the 15-minute chart this is the most logical level where price is likely to bounce measure the distance from your entry to the stop loss and ensure the takeprofit level provides a minimum 3:1 risk to reward ratio look at what happened next as expected the market respected the supply Zone and moved directly to our Target the price dropped sharply hitting the profit Target now that you've seen the strategy in action and how effective it can be it's time to put it into practice take these steps apply them to your charts and watch how your trading improves if this video helped you don't forget to like And subscribe for more strategies like this and if you have any questions or want to share your experience leave a comment below let's keep learning and growing together see you in the next video and happy Trading
The words are the caption track's own and nothing is reworded or re-transcribed. Paragraph breaks are placed between sentences so the text reads as prose.
Free tools for your own script. No signup, no login.
Paste your draft and see where viewers are likely to drop off, with a rewrite for each weak line.
Paste the first 30 seconds of your own draft for a hook score and rewrites.
Check your draft against YouTube's advertiser-friendly guidelines before you record it.
Read this channel's public videos and transcripts, and download a writing brief for it.