Getting the transcript
Reading the captions from YouTube. A video nobody has opened here before takes 10 to 30 seconds; this page fills in on its own.
Getting the transcript
Reading the captions from YouTube. A video nobody has opened here before takes 10 to 30 seconds; this page fills in on its own.
PartTimeEngineer · @partTimeEngineer-h4u
Words
21,246
Runtime
1:37:04
Speaking pace
219wpm
Reading time
89min
219 words per minute, above the 201 75th percentile of 349 measured videos. That distribution comes from the 349-video hook study.
Opening (first 30 seconds)
Hello everyone, welcome back and today we will be discussing about metrics plus log monitoring and alerting system. So we will kind of take it word by word. I'll just give a very brief intro about what this entire thing is metrics and log monitoring along with this alerting system. So kind of think metrics monitoring platform collects performance data like CPU memory report latency all the necessary stuffs for engineers to monitor a system from where servers and services store it as a time series data visualize it on dashboards. kind of like take all the metrics and then there is your dashboard and then there you have access
110 words, the words spoken in the first 30 seconds at 219 words per minute.
Free, no signup. See how the first 30 seconds hold attention, with rewrites.
Sentence shape
| Measure | This transcript |
|---|---|
| Sentences | 884 |
| Average words per sentence | 24.0 |
| Longest sentence | 452 words |
| Questions asked | 31 |
| Sentences containing a number | 98 |
Most used terms
Filler phrases
521 in total: like 164 · basically 113 · kind of 97 · uh 86 · actually 41 · I mean 13 · you know 3 · right? 2 · literally 1 · um 1.
A literal whole-word count of the same phrase list the Prepublish browser extension uses, so a phrase inside another word is not counted and a phrase used in its ordinary sense still is. It is a count and not a judgement.
What this transcript is
Every word below is the caption track YouTube publishes for this video, pulled from the video itself and reproduced unchanged. It is not Prepublish's writing, not a summary, and not a re-transcription: it is the video's own published captions. English captions, generated automatically by YouTube, in the video’s original language. Source: the video on YouTube. A channel that would rather this page did not exist can ask for its removal through the contact page, and it is removed.
No Script X-ray for this video: YouTube shows a Most replayed graph only once a video has enough views.
Hello everyone, welcome back and today we will be discussing about metrics plus log monitoring and alerting system. So we will kind of take it word by word. I'll just give a very brief intro about what this entire thing is metrics and log monitoring along with this alerting system. So kind of think metrics monitoring platform collects performance data like CPU memory report latency all the necessary stuffs for engineers to monitor a system from where servers and services store it as a time series data visualize it on dashboards. kind of like take all the metrics and then there is your dashboard and then there you have access kind of these kind of beautiful diagrams.
So for all of this and here we have these mostly are the metrics part and for logs obviously we do write log debug and pass all the different log information over here we want a kind of view where we can do a query write check like error and we do a search so we get all the logs which have error in that or in general if we take a time window of let's say two to uh like a last 15 minutes now this is from your AWS cloud watch then we directly get all the logs of the last 15 minutes starting from now it's let's say 9:00 a.m. and till 8:45 a.m. uh top down basis.
So all these things come under the monitoring aspect of it. Alerting system is let's say I put a threshold that if my HTTP requests are around 500 not around sorry if my HTTP are 5XX series so there is some problem at my server end and in the last 10 minutes it the count is going overall greater than 200 or let's say 20 I keep such a number then I should be alerted like in slack or email or pager duty different places.
So this is what my alerting system is. So this is a very interesting design concept actually and things are not that hard over here. It's more about how beautifully you can arrange different components. [snorts] First let me again come back to this dashboard just to give a brief idea of how a metric system looks like. As you can see there are different panels over here and this actually is taken from graphana. So I'll putting the link to the actual page from where I have taken this exact image output.
But these are the different panels that I was talking about as part of your data visualization. Something to note over here is that all of are spanned or scaled over time. All of these even though it's not mentioned over here but even these uh here it's mentioned again it's over time even these are over time so all of it is basically time series or what I can say is like think about this here is graphana but there is data dog and AWS cloudatch now cloudatch does not really give that level of good metrics but it is from logs perspective you can check a lot of things and simple like this kind of data graph you will be able to see in terms of HTTP status code requests so this is what overall it looks like now how is one able to build it there are two aspects to it There are people build it basically in their own system.
So basically in their own infra or they use uh SAS product. So in the SAS like two famous ones are data dog and graphana. So Grafana gives a lot of things in which Loki Mimir a lot of other things are there. I I'll start uh telling about these terms but first what I will do is start explaining in how one would build a metrics and log monitoring system in their own infrastructure. then I will start cutting out components like taking out some components out of it and say that if I were to build a SAS product and give uh and completely make these outsourced then how will I be ingesting log metrics coming out and then kind of same showing the same output so that way it will help you all understand that there is not much change happening it's just that a bit of smartness and complexity is being introduced into the structure having said all these so we will first rule out our functional requirements and at the same time we also mention the non-functional requirements they are not much that of complex so here as we can see we have our functional requirements already listed out so ingesting metrics and logs quering the metrics as well as logs I mean I will be writing plus logs and visualization of these metrics and logs then defining alert rules and then once alert rules are defined then based on those rules receive notifications if the alerts are fired these are our basic uh functional requirements what will be our nonunctional requirements in this To understand it, we will first have an approx on what is the load coming on the system.
For example, if there are 10,000 servers, I mean this is on a SAS scale, but think of in our case when our own infra, so it's our own infra, then around 10 to 15, I'll take the apparent 15 servers. Now, irrespective of the servers, now if it is a SAS, then a lot of different cluster of services from different organizations are actually sending the data. So that's why I say 10,000 servers at a time and per second or let's say per minute 100 metrics.
Now this will be identical in both the cases. So here also I can write 100 metrics per minute. So in 1 minute if I multiply then it will be 10^ 6 metrics per minute or if I do per second then it will be 10^ 7 magnitude of 10^ 7 metrics per second and here it will be around four metrics per second these are huge numbers I mean from an old infrastructure standpoint of view this is still much lesser like in order of thousand it is much lesser so that's why I will first build up in our own infrastructure and then I will go towards the SAS that how It will be done over SUS.
But before moving on, let me also rule out what other aspects of our nonunctional requirements are here. Okay, sorry wrong pen. Here we are saying around inesting 10^ 6 or 10^ 7 metrics per second and if our own infrastructure then 10^ 4. So this is an or condition not that much of a stress but the magnitude is huge. Main things start coming over here. the query metrics that is when we are doing visualization then there should be like within seconds roughly 1 to 2 seconds I would say this much should be an acceptable latency alerts evaluation because receiving notification of the alerts it should happen within a 1 minute time span like if I have given my alert and it is like HTTP request I I won't be writing it so great but it's like if the 5xx series is greater than 20 in the last 10 minutes then it should be fired and it should reach to me within next like almost less than 1 minute.
Now the more sharper I want to go like less than 30 seconds. My design will change eventually. This I will also discuss how the other thing is a very highly available system we should be having because I mean this is at the end a metrics monitoring system log monitoring system along with an alerting system in place. If this itself is down then it's like a big tool or weapon of engineers is down then how will they even debug their own system if the relying reliability system is only down.
So high availability is a must. So we can tolerate eventual consistency in this case for the dashboards but the alert evaluation should be very reliable and also this is something not directly coming out of these requirements but it is more in the statement that system should handle late or out of order data gracefully. So basically because of network delays from individual server uh the data coming might be out of order it has to be functioned up.
So basically the visualization that we see in our graph it should be reflecting correct data at the end and not because out of order data is coming so there should be a different kind of graph coming up. Again these things will start hinting you towards kind of we components like in case you have heard out of order or you have heard things Kafka like structure should immediately strike in your mind so far after watching so many videos but again I'll also pick it up from first principles so let's move on before moving on as I have already written a nonunction requirements here as I discussed just pause the screen and take some time to absorb it and once you have done I just want to draw attention over here by what I meant by low latency alerts it's like within the 1 minute range from the time the metric is emitted to the alert firing kind of think in a way let's say our 5Xs series has reached 9 and I say that after 10 greater than equal to 10 alert should be fired if it is in a window of 5 minutes the moment plus one comes after that it should take less than equal to 1 minute like this is our service level objective or agreement whatever we say in this point [snorts] which becomes our nonunctional requirement actually that should be managed now what we'll do next is kind of take each of the functional requirements and try to write the APIs for it why because the nonfunctional requirements kind of give a structure to our discussion and writing APIs I mean ineneral eneral I write APIs and sometimes when things are very naive I don't go for API in this case these are very pretty simple APIs some post and some get we'll just cover it up quickly and then we'll start moving on to the next parts so targeting the first one inesting metrics that will be typically something of the flavor post and obviously v1 not going into the version part of it but metrics and then ingest and uh the post body will have a lot of metrics so what it might look like I'll add it over here if you see we'll have the metrics list of metric objects and here I should put dot dot why because it's not one object that I'll be sending over the time.
Uh it's like in one request I'll be batching up like around 100 of such object items. It kind of helps us in instead of bombarding every granular second I'll just kind of compact them together and then send it after every 3 seconds all those batched up 100 queries 100 metric points. So in this case I'm sending CPU usage with the labels that I'm setting up values and time stamps. What are labels and what are the metrics?
I'll discuss these are like our key core components. Then the next one would be uh let me just shift it over here. The body. So let me just quickly check what we have discussed. We have done this one. Then we'll be discussing about the query matrix. This is also pretty interesting here. It's as simple as we'll do a get but of what? So same matrix not forgetting the v1. So kind of get then v1 and just don't mind the handwriting as of now.
I'll kind of critify it. But let's first focus on what the query will be. I'm putting the normal query format and then Q is equal to if let's say I'm putting something like average of CPU usage this is my metric name then I'm putting my label this is the US east do I have space over here no let me kind of defy it and show and then we are putting and then start time is equal to A I'm not putting the exact thing and then end is equal to B and steps is equal to like 60 here it represents seconds but let's say I will say it as minutes okay so [snorts] this is basically the window from a to b and then in a step of like every 60 okay take it as seconds minute is like 1 1 hour window so every 60cond uh like 1 minute 1 minute chunking aggregation is showing up in our graph that is exact granularity and then it will somehow show up like this over here and that is the reason I wrote it kind of near here we have done this part as well these two alerting rules obviously again because we are sending something so it will be a post request Let me write it up below here quickly.
Post and alerts not forgetting the V1 versioning basically rules and then the different things that we want to say in those rules. So let's say the name of the rule, the exact query. Basically alert is nothing but a query. I'll discuss about it as well. Then the for and the notification. Technically this is actually converted into this kind of an API request but behind the scene it is actually a prom. And what is prom?
This is also pretty interesting. This is the name and let's say I put it as high CPU alert and here the same query whichever I wrote but in a better way that average of the exact uh metric that we are talking about CPU usage and uh the region is US East one I'll kind of fast forward this area because I'm just blabbing and it will take some time to write and here is the actual rule average CPU is greater than 0.9 obviously one more window we can put here as 10 so it basically says in the last 10 minutes it's greater than 0.9 not going into the syntax right now but here that 5 minutes I will put because four is over here so let me delete So basically this part almost matches the promql or the Prometheus query language.
But if I were to write a proper promql I will add five minutes over here. But then in the API post body I'm mentioning it in this way. So I'm writing it in kind of this way. Please don't take it word for word but it is a general way we will be writing it. And here what we want to put. So this is the channel for our slack and also in pager duty kind of exactly what we want to do. So let's say it would be a team info. The what is pager duty?
I'll briefly touch upon this as well but these are pretty interesting things in today's world. Hope as an engineer you don't get an on call rotation with a pager duty that that silent itself will kill your brain but okay that's life so ultimately to give it a final go what we are discussing about here is a post on the metrics in justest this is beautifully done a get over here if you want I will write the body again here where let me write that and there we go so yes now it's more beautiful and my handwriting is also very bad but again guys I'm doing such hard work over here this is not so easy to do please I'm expecting a lot of likes on this and a lot of engagement on the comment section and What next videos are also there plus subscription would also help me and again coming back to where I was.
So as you can see here the same thing the name the query the for and the notifications this is all over present and if you want I will pify this part also but I think this is pretty much readable at this point and we have actually covered our injection part quering part defining alert rules receive notifications is not actually any API in our system that we should be discussing about because technically it's very internal to our own system.
So [snorts] we have covered the API aspect now we will discuss about some functional components over here. It's not actually components. These are basically the actors and the main actors are metrics and labels to begin with. Logs are also there but I'll come to the logs part a bit later. We have actually done the metrics injection and not the logs injection but it won't actually differ so much. But let me try to build up a story over here which will make more sense.
So where I was we were having our metrics and labels on that. So let me just give a small example that will help you guys understand and then I'll also show the logs example as well. So starting with metric, it's as simple as a named measurement which has a value at some point in time. So let's say in this entire running case we are taking CPU usage. So this becomes our exact metric. Let me write it here separately. CPU usage and labels.
Labels is what helps in applying the slicing and filtering over those metrics. So things like the host equals server one because how do you identify CPU usage for which host? So there are multiple like there are different CPUs for which your dashboard is collecting these informations. Like you can see over here right for HTTP request itself the metric would have been the HTTP request or let me use this pen only HTTP request is our uh HTTP request like this if I write is also fine.
This becomes our metric and the labels will be something like status code the different statuses that we are seeing 200 204 20 500 all the different series. So this is the way we identify. So continuing in the same story something like a region also we can add I'm taking inspiration from here so US east one having said this there is something called series the reason I'm introducing these words is because here as I had said earlier notice that how we are expanding through time and a series is getting created everywhere so we have to understand the series as a metric entity this is nothing but take any particular metric and combine it with a label and this becomes a series what it is again we'll discuss but if I had to combine it all I'll just copy this particular thing and I'll write it in this way.
CPU usage with my particular host and region. I mean obviously this is key value pair. So the host is server one and my region is US East 2 or one whatever it is not going into the depth of it. As you can see I have kind of changed the screen over here. Why? Because just to give a more brief idea. Obviously they are the different labels that we have label one and label two. Now when we add host is equal to server one we had two choices right? server one and server two.
How series become different? Each label that we take and add to our metric that creates a new series. This understanding is very important as to the next data structure that we will be using or the entity that we will be using to store these kind of things. They will be adhering to this basic understanding of what a series is and how labels are helping because your entire OTL standards open telemetry which we say kind of adheres to these components metric label and series and the understanding which I have told right now.
Now that we have discussed about these as our key entities, I would say core entities. Let's start deep diving into our system design which everyone likes talking about. I mean the first thing that we can clearly see is the different paths that we have a right path and a read path. So this will be our database wherever we are storing the metrics and the logs and obviously just in front of the database there will be a worker or right now I'm not even naming the component.
This is for our injection path and here will be our query node. This will be doing the query. So our dashboard is actually sitting in this side and our service or servers are sitting over here. Now mind you this same system is true for both our own infra as well as for SAS. When it's a SAS then there will be a load balancer. I'm not focusing right now on these parts. I'll slowly build up from actually this point itself.
What is the exact data store that we are going to use and starting with metrics logs and metrics they require different kind of storage. So initially I'll be discussing a lot on [snorts] metrics. Then I'll be converging my discussion over logs. for metrics how do we go ahead what kind of a data store do we need to have and to also begin with here the number will also offshoot not by 10^ 4 but it will be somewhere between 10^ 5 to 10^ 6 why [snorts] because I'm assuming that there are 10 by 15 services in our own infrastructure but then think of it in this way there will be a prod there will be a QA and there will be for availability zone purposes our production instances will be kind of present in three to four regions let's say three regions and so it's basically saying equivalent to 10 into 3 into to so it will somewhere go and start touching towards your 100.
I mean these numbers are looking less but there's a reason why a system goes for its own infrastructure rather than choosing a SAS is when it finds out that hosting these services is very cheaper for itself rather than uh bearing the cost of a SAS service. So it's not limited to 10 uh 10 to 15 services anymore. There are more servers to it. So automatically somewhere touches 10^ 5 to 10^ 6 m per second if not 10^ 6 at the upper bound but some minimum 10^ 5 and touching to the point of 10^ 6 metric per second automatically SQL will not be a candidate obviously there is not a problem if I choose SQL when it was 10.4 four also.
Why? Because if I have a very strict structure and I can just keep appending I will be using ID time stamp basically when it was generated then the different labels the metric name all these things but remember labels is very dynamic in nature this will lead to cardality problem but bear my words right now metrics are dynamic and because of this dynamicity in nature SQL table breaks let alone that 10^ 5 to 10^ 6 metrics hitting per second which is like I am doing rightes and there is a read the moment right are happening my rows get locked and then my reads will be stale and then aggregation also has to happen.
There are a lot of responsibilities that my DB should be performing. Our next candidate would be OLAP DB. Now the point with OLAP DB is it's columnary in nature and actually it is not a bad candidate. We can do it but the way in which OLAP DB does the management and fairly enough because of the columnar nature like different fields are different columns. This is field one. This is field two. This is field three. Because all of it are also as files.
So field and files are analogous. In this case we can do compressions over here. Yet OLAP would be not a good candidate because again going back to this diagram here everything is time series based. So the concept of time is not coming into picture because if time were to be a different field what will happen is there will be another column with time stamp. What inherently we need when we are doing query is something which kind of respects it in a way that we have our series one and we have different time stamps coming up over here like time stamp one with the value then time stamp two with its value and similarly.
So every series inherently keeps building it and then kind of take each individual and these are your different chunks. Then you take the chunks and create a block something like that. Now that leads to the birth of tsdb time series database. It's not that OLAP has a problem inherently but the way the query access pattern is being done that led to the birth of time series database which is more ultra defined and OLAP wins in cases where TSDB does not win.
If you need to look into the exact differences, I will be writing a blog soon in that I will be actually mentioning when a TSDB needs to be used and when an OLAP needs to be used. But in this case actually it's a time series database. So this is time this is series and DB is your database. If you need a more beautiful wording I'll write it down below. And here we go. As I said this is your time series database. And we'll take some inspiration from here.
So this is basically thinking on how the time series database was built. I'll not take much time over here because it needs its own dedicated but it will also be a major factor on how your entire design system is getting built. This is the powerhouse like mitochondria is the powerhouse of the cell. This is the exact powerhouse of the entire metric monitoring as well as log monitoring if not directly but still indirectly.
I'll also tell that in sometime how [snorts] first thing is what defines series will be basically when we had said this entire series the metric plus label. So I'll be directly pasting over here. This is basically a series. The main thing is the system will be using a hash function and converting it into particular series and it will be having its own. So basically a series will be like a bucket which will keep growing and whatever value that we got like in this case HTTP request it's a count.
So time stamp is like for example 0 0 0 1 is like in the 1 second the value was 1 and then 0 0 0 5 the value became three. So like this in the bucket this value will keep growing. The next step would be similarly for all the different series accumulating all these. So this is what will happen here as you can see for individual timestamps. Now I'm just saying that these times are same but it's from a graphical perspective just to give a row column format but think more in each individual series is running they have their own set of timestamps running over here we will have to start doing some chunking this word keep in mind and then these chunks will be kept because ultimately all the databases that we see is a file system right so there will be a chunking kind of structure and that we will follow so I'll say it as a step two and this is step one.
What is this next step? Let me just paste it here. But before pasting, let me just again repeat what I said. So here also the other thing as there are a lot of things here. So I have to kind of build up a story properly. These different chunks that I had told they are kind of in memory also and in file also. So this what I'm building right now is actually Prometheus. This also I'll reveal at this point. This is by Grafana.
It had built or conceptualized this TSTB. The main foundations actually came from your Facebook's paper on its own gorilla compression which I mentioned over here. I I'll represent what this exactly is. For example, in OLAP DB we had different types of compressions like Zor compressions and uh time stamp delta compression that we say. Gorilla said that we can do much better in case of these time series database. This is called delta of delta.
Why? Because if let's say you take a time value of 0 05 07 and then next one increments by 08 then 09 you take it as base B1 then this will become B1 + 01 this is B1 + 01 or 02 you can take delta of delta saying that again this is B1 this is delta 1 and this is delta 1. So basically this difference column was going only till one level delta this goes delta of delta. Why? Because this is the magic the series there in column database all the different things were coming and getting stored.
So different types of things were coming as different things and getting stored. So that granularity or continuous nature was not present here the continuation is coming because I have built a series already. And next thing is the zor on the float values that is also very easy. If I like obviously and I'm going into the binary representation but a float is nothing but at the end a binary let's say this somehow represents 0.5 I'm not going into the first part representing the mantisa and all those things I'm not going into that 7 and 0.5 will be differing by some bits only so if you take a z rest everything becomes zero wherever the bits are same only the places where bits change this is your zor operator and that is the so basically when the numbers are very close by in nature then the zor between these numbers are also like very small so you store a lot of extra memory like 20x to 30x compression you start getting due to the time series determinance.
The next part that I was going to say or this part which I have added here is the chunking part. So let's say these started from 0 0 and till 0 02 let's say for every uh 2 hours I'm doing a chunking. These are fine tunable parameters. This is a entire chunk that is created and then this will be sent back to your file system. This right now that we are seeing it's actually in your RAM and this is the head. That is what I'm showing here that in head RAM the window here is from 0 0 to 02 so far but next from 0 to like 0 to 01 to 02 basically next so it will be 04 drawing it over here again this window needs to be now kept in your RAM and remaining needs to be flushed so the concept of chunking comes into picture making some space and now that the space is cleared up so as I was kind of saying a chunk was created here and these are the different let's say this is the chunk as of now every series has its own chunk that has been created chunk is nothing but your granularity between let's say 0 to 0 0 and 0 0 this is basically since start and the next 2 hours and after 2 hours the system will say that okay this much is considered one chunk let me store it now as a block so what it means is I create a block which says by time stamp that this is my entire block duration uh hash ID of it is 01 ABC that does not matter main thing is here I had four different series individual chunks all will be stored over here in the chunks folder so basically the main factor becomes the time interval And then index this I will again discuss this is basically coming from your inverted index concept from elastic search but let's let's let's kind of keep a hold into it and meta.json it's basically uh because the file has to read right so this information will not be present here it will be in the meta json which time range it belongs to and some stats related to the file health and finally all these data are actually getting collected in the form of different blocks which is the final representation over here.
So this was the block one for the first 2 hours then block two for the next 2 hours and similarly obviously in posgress also we have our right ahead log but this is basically in the RAM whatever is present for persistence right now it is in the wall and rest everything that has got persisted are present as blocks so this is a subtle difference obviously in case you guys don't know what is a wall or write ahead log in a myql I will create a dedicated video discussing very minute details of these different beautiful systems in place overall now what I said to keep a pause of index is when say your uh different values related to this HTTP request came just writing it down quickly and your label was say code 200 over here and host is B.
So basically representing that this particular HTTP request and this is your query. So how will this query resolve into quickly we have to then understand the concept of inverter indexing internally what's stored in this index or like I'll draw it over here quickly is we store these values the different labels that we have code 200 in that let's say we are getting a lot of chunks chunk 1 3 9 dot and for code 500 we are getting I'll be a bit more uh [snorts] realistic over here say very less time scheme because obviously 5x series has been some problem with the server and for host Host A say these are the chunks 1 2 dot dot and for host B the chunks are something of 3 9 all these things.
So when our query comes this helps us this inverted index concept quickly helps us. Now we only need to search for 200. These are the different chunks and obviously this is the time stamp based also like start is a and end is b. So very quickly resolve which blocks to find your things into and once you go into the block just look up into the index find the respective chunks. So let me just do from here the answer will come as 1 3 and 9 and from here host B the answer will come 3 and 9 and intersection operation will lead to the answer is 3 and 9.
So just fetch out the chunk 3 and 9 and similarly I'm assuming our start here was of 0 0 to 02 only so it reached out only to block one in case I would have gone for a 4-hour window or like the point is this granularity can also be fine tuned so then we will be quering like the querying engine will be quering over these two blocks and that is how quickly it picks up the answers. Now that I've said all of it, this actually is itself enough for TSDB for a discussion where we are more focused towards metrics and log monitoring and alerting because there are other components to it.
But this plays a major role. This is actually Prometheus in action that I have already said beforehand. But this is kind of vanilla in nature or vanilla means very simple or plain. This has no much added thing. Obviously what you guys might be thinking now is what is so plain in it when it is doing so many extra work for us. No, when we have our own infrastructure then it is not actually that great of a deal. That is where vanilla Prometheus shines and to be honest in our own infra setup we'll have our Prometheus DB and all our different server components are pushing data and we are fine with it but what about in a SAS scenario when load balancer all different these are mind you this is organization one let's say particular company X company Y company Z everyone is pushing their data we have to automatically start creating different like we cannot first of all either go with different Prometheus DB instances or do something much smarter where we can do some redirection and that is when graph Ana came up with a concept of Mimir.
It is nothing but Prometheus with I would say steroids and it's not steroids basically. I'm like being funny over here but Prometheus but with smarter concepts and at the same time the durability nature here we can afford this is our own infra. We can afford to retain it in file system in a SAS setting file system like what do we even understand? We have to do a more persistent storage and then block storage like S3 comes into picture.
It has to start uploading. Mind you vanilla Prometheus is not doing this at all. it is only dumping it into its own retained file system. So what do we do over here? I'll discuss this part as well that how do we persist and go push into block storage but mainly this is what mimir does and today industry has moved towards mimir even in our own infrastructure setup al as well to explain this further actually I created a good slide presentation and this with animation will actually help you guys understand much better this is what I was discussing about so we will be kind of focusing more about mim's separate things like the write and read part that it is providing with respect to the shard and multi-tenency so everything whatever we have seen in promethia so far that is what mim is also doing but in a bit of a different way now consider Here there are two tenants out of so many we are considering two companies here like act and gloex now these two tenants data flow the same pipeline but stay physically separate and that is what we actually need so the next part here would be we have the concept of agents now what are agents kind of I haven't touched it up this will be my next immediate topic consider it like a collector or a collector collector would be a better term which is kind of pushing that data so these different entities are not directly communicating with Prometheus they have a small sub agent or agent kind of put into their different services and they are collecting that information and reaching out to the exact SAS service or the Prometheus or whatever DV in this case it's a Prometheus only so these are the different agents the main thing is the header tenant in the HTTP header is given by XO or ID now this is the exact name which graphana uses and has kept in the documentation exactly I'm copying it out I will be giving the link to the exact graphana docs or the website link in the description so check it out below the next thing is the distributor it is indeed a different component a separate entity in uh nimir nimir is by graphana by the way so distributor reads the header which acts as a tenant does the same hashing of the series which we saw earlier in our vanilla prometheus this helps us now pick the concept of shard shards are nothing but different nodes or systems.
Now we will also decide replication factor which was very much missing in our vanilla prometheus. Here for high availability we will replicate it let's say three times. Now I'll not go into the right and read cororum but generally we keep odd numbers for as an application factor for high availability and then we will be also doing validation enforcement of limits which was again we not done in vanilla because again that was just a time series database just a single entity where the distributed itself takes care why because the concept of cardality comes into picture and what cardality here is the different series that are getting created because of the combination of metrics and labels.
I will actually visualize it out in my drawing board after some time. But think of in this way that anyone if by mistake enters some ID or some label like user ID which itself is so unique like in a million range it can go because of the UU ID nature it can blow out the entire system. So that itself the limit enforcement and even the rate limiting enforcement to be honest can be checked because you don't want as per kota and whatever things are present you want those things to be respected for each individual tenant or even in your own system when you are hosting these things you don't want just because you are unlimitedly giving out logs just because some issue happened somewhere you don't want your tgb to get overwhelmed the next part is the injusters as simple as it can get these act as basically your the ram part so in our vanilla prometheus as I told all those data exist in our ram here these injusters are keeping they are using their memory as the RAM.
So the fresh head is present for every series that is present in the injust itself. Sharding again the same this distributor has picked which injust to process it into. So the hashing of the series along with the tenant id leads to that particular sharding and in this case because I'm saying replication factor of three. So three different injustice will be having all the same data. So that is how replication factor has been managed and after every two hour the flushing will happen.
Now in this case the flushing will be into an S3 which we will see here. This was also missing in our vanilla DB. So overall this is the entire sequence. So now in S3 also keep in mind every tenant is respected and given its own space. So globex will never touch acme like the queries of acme and globex will never touch each other. They are completely isolated even from a data storage perspective as well. Ultimately the query will be like a scatter and gather.
This is basically if my scope is acme which is coming again in the scope or ID. Then the concept of hot and cold which was not present in Prometheus vanilla style. Why? Because it is the same system or the same machine where the node or where the RAM is also present and where the file storage or basically persisting to the file is also happening over the same machine itself. Here these are two different entities. Injust is like a machine is is a machine is a node which is utilizing its RAM to work as a hot store and S3 is literally becoming a cold storage.
So your distribution or the query can be completely distributed between two different things. Cold is like a storage gateway not like it is exactly a storage gateway. So via the store gateway reaching out to S3 block and pulling out it will take it some time and the hot ones are present over here. Most of the time you will be doing queries which are in the hot range. So not too mind but still mimir will help you also do query over the cold range as well.
And then the merging and dduplication and finally the result you will be getting. So that is what finally isolation is basically a query from ACME can physically only touch this acme S3 URI not globex blocks these are unreachable one tenant cardality blow up that cardality block which I explained will also not actually hit in case due to any other reason also globex or acme anyone screws up their labeling system and cardality blow up happens other tenants will not be affected and also the series 4 rejected so it's not a global outage so the final aspect of a TSB that is remaining or it's not final [snorts] but it's an important powerful feature the downsampling and compaction both are interled in one way is like think of this when we have our 2our chunks or basically blocks we can take these individual blocks and we can convert it into a 6-hour block so this the DB itself gives out of the box this is basically compacting in nature downsampling means so let's say if I go very granular 0 to 02 then 04 then 06 all these data points that are there.
I now want to compact it into 0 0 to 06. I want to see something of a which kind of resembles it but it is kind of shrunk down. That shrinking happened over here. So this is called downsampling. Compacting is taking these blocks of individual 22 units and then converted into 6 hour block. So in our block already we were storing it in a different 2our stamp. Then instead we will be creating a new allgether block here 01 a bf which will be like 0 0 to 0 6.
And in that the downsampling has happened by taking like depends on the kind of data it is uh average or max or whatever it is based on the type of metric system it is whichever represents the better data like simple kind of things we have done in our convolutional neural networks in machine learning also when we have to take average of the pixel values in these but okay not going off the topic this finally completes and concludes the entire discussion on our time series database the major powerhouse or component for this entire thing now that we have stated that so this is our producer producer of metrics or logs but in this We will just restrict ourselves to metrics.
Logs will come later. This is our TSDB that we have identified as our main storage house. Do we directly send it over here? No, not at all. This is emitting or kind of producing at millions 10.6 metrics per second. TSDB taking this much hit itself is a very bad idea. Second thing is it automatically there is something called injection service that we will be adding. Now this will kind of differentiate in a style when it is for our own infrastructure and for a SAS but some parts will actually a lot of parts will match except for one component.
How that will happen is because of the injection service. What is it doing in case of SAS this is basically just after load balancer the exact entry point because the request has to hit some server right. So this is the injection server. This will not be present in case of our own infrastructure. There is neither a load balancer nor an injection service. So this is your SAS and this is your own infra. Uh let me just write it in a cleaner and writing infra own infra after injection service also do we directly put it to tsdb keeping a source over here still no why because say here at least in s case we can scale up the injection but scaling up injection is equivalent to just saying that all my 10.6 six requests not hitting one server but scaled up and say if I have three services 10 part two uh requests hitting but again at the same time all of them I'll just change when all of them hitting the DB over here it's like just removing the bottleneck from directly hitting the TSDB to now accumulating it over here giving high availability basically every request gets entertained at least at least over here but then writing will crash the server we have to introduce a shock absorber which will be Kafka same here we will be applying the same Kafka now Kafka acts in multiple ways.
One of the important things here would be the partitioning structure that we will be choosing and at the same time durability and parallelism 10.6 now again it needs to be consumed because this itself does not have the power to pull the data out of it. There will be a injection consumer. I I'll write it down later but it is a consumer. It will pull the data from the Kafka and feed it into the DB. Same goes for here same component I'll put it into the DB.
In Kafka the back pressure handling is because Kafka is absorbing the spikes while consumers process at their own pace. This is mind you a machine a server. It will have its own speed by which it is consuming. So Kafka will be retaining. So this part of the data has been processed. Rest all are piling up and they are durable because of the nature in which Kafka is retaining or persisting the data. It's all the file system and in the file system different offsets are present.
Offsets are equivalent to the file system. In the not offsets sorry these are different topics and each consumer is reading at its own pace using the concept of offset. So basically there's concept of consumer group in each consumer group all the consumers share different offsets and then different consumer this is group one this is group two they all will be reading at their own pace the same like the same topic and that is what we actually want to do over here this makes a lot of visibility sense in SAS but at the same time there will be different readers which I'll be introducing slowly and gradually [snorts] readers inense consumers the second aspect is the durability which I already said metrics are persisted in Kafka until consumed and parallelism obviously multiple consumer partitions process data in parallel so if I create a consumer group and all working at the same time.
So one particular and what is this partition? That particular partition will be processed very fast and will be feeded up into the time series database. Now the partition will again be the same hash of metric plus label. The same exact concept that we followed over here. So basically we will create the same series and each series is basically each partition and obviously we can obviously put an X or ID as well. So basically it becomes series plus org ID one particular partition and in case of our own infrastructure or ID does not exist.
So this becomes the entire own series with only the metric plus label hashing of that. I'll kind of clean it up in case the concept of Kafka did not make sense. I I guess I have covered it as much possible. Kafka needs its own deep type. But at the same time there's a video of admetric. It will be appearing in the top right. So the admetric correction also uses Kafka extensively. Anything which has metrics or kind of data input points coming up throughout the time needs Kafka as back pressure handling.
There also I have discussed the similar topics. I hope those will be helpful. But obviously I have to discuss about Kafka in a separate dedicated video. I would expect there will be a lot of engagement in this video as well which kind of [snorts] gives me the incentive and push at the same time to create more such videos and I will be doing it but maybe I will do it sooner. So please again like share and subscribe. So the final key takeaway is Kafka along with injection consumer with the TSDB writing to it and our right path is almost done here. injection service because a load balancer was introduced and then the Kafka and then consumer injection consumer server uh services or server services whatever you say and then so basically the right path is almost done there's a reason why I said almost done think of individual I will first say in own infrastructure itself same thing replicates in SAS and SAS also is overwhelmed by other different orgs sending a lot of requests at the same time we can kind of reduce the number of lines over here basically in the same second instead of 10^ 6 we can go a bit down to 10^ 5 or to the order like even like magnitude of 10 is also less so we can do the same over here rather than every request being bombarded started over here we put the concept of collector or agent that I had told in case of mimir or in general this is basically coming from the domain of open telemetry at this point.
So these agents or let me draw a better diagram and here we go. So what I was trying to say this is your main service there will be an agent. Technically what happens is basically this is your docker container and there will be one agent that will be putting here. Similarly different docker containers or like even if you have a swarm of dockers then there will be one agent sitting outside. They have different names like fluent bit and then out of the box there are other hotel I I actually there will be a bonus content in the end of this video where you will I will be discussing about these things.
Now coming on to this agent part we were getting hit by around 10.6 like 1 million or order of like whatever x million it is. We can easily reduce it to now 10^ 4 also because they will be buffering it up almost and sending it regularly. So instead of 10^ 6 10^ 5 to 10^ 4 like something in this range we will be hitting it up. A lot of things this will be able to do is this introduces the concept of a push based mechanism or a pullbased mechanism.
Sorry it looks push but it is a push or a pull. Now think this entire thing is our black box. This with respect to it if anything is coming this will be a push and if it reaches out then it will be a pull. Prometheusdb was designed to be a pull based. So means our system or server is supposed to expose metrics kind of an API endpoint or endpoint and then our promises DB will reach out. It will reach out from here asking for hey what is your metrics.
So every like duration of every 1 minute or whatever granularity you are putting it will reach out. But now that an agent has been introduced it will start reaching or pushing the data to the boundary that we are setting. Obviously Prometheus is not designed to be in this format but Mimir has this already. Mimir Cortex Thanos there are a lot of TSDBs at this point. and Victoria metrics as well. I'm I I'll write down give the links in the description but because we were discussing so I'll just mention Mimir from Grafana a wrapper around Prometheus you can directly reach out to these because they will expose their API endpoint but even for Prometheus today they have when you are setting it up locally there's this concept of web enable remote write so this uh let me write it out properly so this is what I was talking about this flag when you are setting up Prometheus locally if you set it then it will expose this API v1 and write main thing is this so now you can do this query and keep pushing and similarly in your SAS case obviously these are providing the necessary details to you before concluding on the right part topic as we have already discussed about the agent I'll just take some four like maybe two to three more minutes and just extend on it there are both as I said earlier for this blackbox there's a push mode and there there's a pull mode obviously the moment agents have been introduced it starts looking like a push mode now there is a reason why both push and pull exist in picture for a black box if this black box like if sorry if this server keeps dying time and again then how will this black box or in this case their entire metrics monitoring system and alerting system but first you have to monitor then you can alert so okay having said that this black box can only do a pull if this server stays alive with it fixed IP address and everything generally for dockers or docker images which keep dying and because ECS kind of things came into picture where [snorts] containers are ephemeral in nature and then they are scaled up and down the pool starts breaking and that is when the push concept started coming in that now it's the container responsibility to push and reach out and that is where we start like we in the container image we give an agent as This agent is nothing but a YAML.
I as I said earlier I will be creating a bonus part in the end of the video where I'll be discussing about this OTLP online telemetry protocol and how things are adhering to this protocol from now on like in the current industry to avoid vendor locking and other things. But this kind of gives a final conclusion to the entire right path that we now have our service. I I'll just cut out this part and use this area for a SAS style.
Here will be our load balancer and then we have our scaled injection service. Then we have our Kafka. Then we have our scaled consumers and then we have our TSDB. That's it. Reaching out to the injection service. This is our load balancer and this is our Kafka. Then consumer and TSTB. Obviously I'm repeating myself here but kind of helps you guys also I guess in case not then please say it out in comments as well that I should not be repeating but okay [snorts] next part is how do we query?
Now that I had already explained in TSDV that what is the powerful feature of doing all the queries and aggregations. It's as simple as there's a query service. This is our dashboard. We reach out using our query service. Basically, this happens because there is a load balancer over here. And then this will reach to a TSDB. But in case there is no load balancer, basically this load balancer, this load balancer is same.
I just have moved the dashboard over here to show a read path. But in case in our own infrastructure we'll be directly having our dashboard and we'll be directly doing our using our promql because Prometheus is our underlying DB over here. Using the promql we'll be querying and we'll be getting our responses. Now I'll take some time I'll introduce obviously I have given the entire dashboard of graphana over here itself.
This is graphana I had written with other pen earlier. So I'll just show exactly how the different panels are set up and this will exactly cover the read and write path the entire metrics monitoring path so far. So in the next slides or the next uh drawing board I'll be discussing these things and here we go. The main reason is obviously we have discussed our data source which is our TSDB in this case it's our Prometheus and there are different things that we do not want to do from scratch.
Let's say thing like graphana did not exist. What we had to do was first we will have to create this entire dashboard with all the HTML CSS JavaScript embedded. Then understanding of the different kinds of data and then what kind of visualization like histogram, bar graph, pie chart like sectoral representation. There are a lot of different visualizations. So for that individually we have to write different CSS stylings.
Every other organization will spend time in it. So this is the initial thing which Graphana gives you out of the box. The entire dashboard. Let me just copy this as well. and keep it below. Oops. I think this will use space. Yeah. And as here I was saying the different panels with visualization. This is Grafana giving out of the box. And how this panel is being set to begin with for each panel is basically so this is the panel that Graphana says there are three different things plug-in, query and transform.
Now plug-in is actually something why because it's not always Prometheus from where things are coming. It can be from elastic search also and there are other different data sources. So plug-in is for that reason. Plug-in is basically a definition of graphana that in the marketplace there can be something else that graphana does not support. Graphana out of the box supports Prometheus, elastic search and a lot of native different data sources.
I will be providing the link in the description. You guys can have a look. Next is the query. For example, if it is Prometheus then it is the prom query in picture. It gives this kind of a widget where you will be setting. So for example, this is for the node CPU and for the this is the metric that we are setting and this is getting inested actually. So it will be auto identified over here from that data source. Then we will be putting a label filter exactly what do we want over here and then this is the exact raw query that will be getting found because here any label is not being put.
So that's why this is raw query in this format. If let's say host [snorts] is equal to server one we put then obviously the host equals to server one will be showing up in a raw query. So we can add query and we can check different things also. Next part is our transformer. Now transform is not really necessary. Sometimes different tables need some joining or different kind of conversion which inherently the DB is not able to provide out of the box.
Then a transformer layer is needed. And finally this is the panels visualization layer. It's not the actual visualization per se. It's more like how do we want the visual to look. So this is basically for the table. If I expand a diagram a bit. Yeah. So here if you guys see it's the table the kind of the column width we need, how it should adjust and then the alignment all these metadata. Then how it should be mounted on the different kind of things disk space usage [snorts] how it will be looking like and finally the exact query.
So as we have already said here I mean this is one example node file system size bytes the job this is one particular label the instance all the different labels have been put over here and accordingly all these data points have been aggregated. So this is how the table will finally look like and we can control it and that gives you the powerhouse graphana itself. Now graphana had started it journey with visualization then it came and gave L for Loki and M for Mimir.
What is Loki? It's a very interesting part. Our entire log segment is still waiting to be discussed. This is where I will be discussing about Loki. But yeah, Mimir is what I say at Prometheus. Even Prometheus is by Grafana only. Prometheus with a lot of extra powers is what Mimir came in picture. I won't be again repeating the same stuff. So now that we have defined again I had mentioned over here. This is our right path and read path.
And if we are in our own infrastructure then as simple as that we will do a direct query. This is our graphana dashboard directly quering here. We just have to mention the data source Prometheus. It understands out of the box. And that's it. We are done at least from a metric monitoring perspective. Mind you, there is no alerting right now and there is no log monitoring right now. We will first go into the log monitoring part and then we'll combine and do the alerting mechanism because alerts are generally happening over quantized value.
Logs I'm like it's like a combined discussion that I'm having. When you say log.debug and you pass the particular de log statement, you can never set an alert over this except for the fact that if my error logs are like happening more than five or 50 whatever that number is, then you give me an alert and that two in a range of let's say last 10 minute window, you have to mention the window name. So that is the important thing.
So now the log has to be treated a bit differently. TSDB is not exactly how it has to be treated like but then graphana did treat it like TSDB. So there are two flavors to it. Flavor A will be the ELK stack, the elastic search log stashana or you can go directly via the Loki which is your graphana. This will be your flavor B. So let's go to the next board and start discussing these. To begin with we will go with the flavor A version or like flavor or in this case flavor is a suitable word [snorts] and obviously this we'll be discussing about flavor two.
Flavor one is all about the ELK stack but not necessarily be the ELK stack. The main thing is using elastic search. L stands for log stash and K is for Kibbana. Then Kibbana is specifically like a dashboard just like your graphana but bounded to your elastic search. Uh obviously this is elastic search. I think I need to improve my writing at this point. And this is your log stash. As I had discussed earlier the concept of Prometheus agent or or agents in general.
Log [snorts] stash is kind of similar not entirely but in a way. So the similarity is coming from the point that here an agent is kept. These is your OTLP uh from telemetry point of view. And these are metrics that it is collecting and sending. Obviously, it is batching all of them and then sending it in case of log stash kind of thing which also uses the same concept of YAML file and then detects or not even detects basically collecting from different services and then sending it out in bulk.
It has three different stages input, filter and output. All these are actually not present in this kind of an OLP connector for metric point of view. So I'll just remove this confusion overall in a diagram. Here it has this is log stash which I'm discussing about first. This has your input filter and output. So basically here we read from your it could be from Kafka directly all the logs which are getting into Kafka from Kafka or from your syslog or from beats.
Leave beats for the time being but sis log is in case you guys are aware or incor not then etc sis log some good flavors from where basically all the logs they are to be dumped and logs when you write log.debug in all the places or log.info info. There are different formats of log like different levels of log sorry all these are finally getting output then your terminal level things come into picture that they are getting dumped and that is when the sys log kind of thing comes into picture for aggregating all the logs and then from the sys log which acts as an input to the log stash it will do the filtering step filtering consists of lot of different parts let me just directly copy it and then explain each and everything and this is the filter part that I was talking about so what we've already discussed is the input which is coming from the syslo part in this case then in the filtering step these the typical things like the G block part which we say then the GIP adding of the GIP [snorts] all these are basically enrichment enrichment is nothing but your log is basically let me just add the enrichment text here and here we go so as I was saying this is our raw text error payment failed let's say this was the error log we have to enrich it with a lot of things timestamp obviously here I will discuss this is being done by the filter step from the log stash itself converting the time stamp into ISO format level error is coming from the log itself extracted out message is the payment field that was over here.
Now, which service it is coming from, which machine, which environment, all these are the enrichment things out of which you can already see that go based enrichment go and how do we transform like what we have to redact from the field PI data or anything we want to scrub off from the log message that happens from the filter step of the log stash. Next, there are other things for which we need flink actually. But before I introduce even the term flink, think on this way, there are other separate things as well.
How do we kind of input them? So, This is the one which is providing the logs. Now obviously here I have already added my log slash component. Then I will pass it into my Kafka and then into my flink and then there will be other things also like the correlation ID. Correlation ID I'll discuss upon it. It's not that big of a deal. It's very important. But from where the user tier is coming and say the region environment and host obviously it can also be provided by my flink itself.
So think in this way there is another table. This is my business related table. From here whatever things are present I will create a materialized view in Flink and any changes here will be captured by the CDC. Then Flink will be joining this is stream A and this is my stream B along with other informations. These kind of informations they will be provided in the flink and then this stream A plus stream B plus other info.
This altogether will be creating an enriched log. Just to give you a understanding this here will be my stream A which I have mentioned and adding here will be another stream B. So you can see here from the log stash part what we are getting. We have already got our user ID with the time stamp with the event payment failed reason the message and necessary IP address and then from the CDC DDM Kafka with the metal list part when it had when that person had signed up what is their active status country tier to which they belong for this particular user.
So we can do all this enrichment obviously what I mentioned here is not matching directly because lot of things are present in as part of our other info like the host environment region all those things but for example the user tier that I was saying premium it came from the enriched part from the flink itself. So kind of this is our business lettered table like all when I were designing any other like let's say payment gateway then this table coming into picture from here I'm bringing in via CDC that thing and keeping a materialized view which is like a fresh state and flink [snorts] is using that as one of the stream then the stream coming from here from the logs stash after the filter step output is basically what has happened after all the filtration process one after the other and there we go this and this combined along with output is giving us our enriched log and then it will be sent into our elastic search I will be clearing this entire clutter in an organized way and then drawing part out.
So let me just clean it up. And here we go. This is much more cleaner. This kind of again going. So log stash is based in out of three stages. Input, filter and output. Input is basically coming from SIS log, GCD and other kind of places collectively all the logs going into log stash getting filtered out. And then there are different steps we're providing in our filter. Basically these important parts like rock, geo zip, mutate and date.
Next once so basically again seeing the flow. This is our raw log that is coming then getting enriched by log stash at least from a IP perspective and data getting normalized as IS is format and the groing part after that it is going into Kafka because of serialization because link has to consume from Kafka stream A and stream B we provide for more further enrichment as to what different like exactly what tier that user was belonging to and also we have to introduce our you know correlation ID as well this correlation ID and then we are doing an enriched log obviously I'm showing the state uh these different streams stream A that was coming after enrichment from the log stress filter field itself and then from stream B it was coming by the CDC for example the country tier sign up date status all these things then we al together create the enriched log and now we send it to elastic search for that let me add a logo over here for elastic search and basically this is the enriched log uh let me just pull that out and send it to elastic search now elastic search is a DB and it follows the concept of same inverted index but here the inverted index is more like red fox jumps brown fox and brown paper.
Now say this is article one, article 2, article 3. After the indexing tokenizing step, red will be mapped to A1. Fox will be A1 and A2. Brown will be A2 and A3 and so on. You get an idea. This is what elastic search also does. But it has to be done. This is in random. When I say it's just for example, you have full control over how this indexing process will happen and exactly at which part tokenization and indexing will happen.
Let me just add that configuration over here. And this is your typical indexing so property that you create in mappings. So basically you get elastic search console and then you have to basically create this mapping using this. I kind of forgot but it is like a put request that you do and then you have your mappings and you have your cluster ID. I mean the elastic search tenant ID and then you start putting all these properties into picture.
Now type text I won't go deep into it. Elastic search needs its own dedicated uh video [snorts] and just giving a this type text for the message. This is where basically when we do keyword of let's say payment we want all those logs where the message is related to payment to come up. So this is where the exact inverted indexing step is happening which I discussed over here. Keyword match is exact keyword match which where we don't want the service like the type to be tokenized then we put it as keyword.
Here trace ID again we want this to be indexed as inverted index but want to keep it as keyword. That means we want to do an exact match not like for example ABC and when we are matching A then it should not be a match it should be ABC matches to ABC. So keyword is this exact match in invert index what happens? A can match to ABC. I'm not going deep into it but it uses your bucketing and other kinds of algorithms which altogether works over here like BM25 being one of which you guys can go and take a look.
And again here text it's of type text and it's false. We don't want any indexing to happen over here. Just to keep it as it is. This is like a very this just treat it like a example that I'm providing. I'm not saying that this is exactly what is being followed but yeah kind of taking the flavor from here and then finally once things have been indexed over elastic search a query will come in the same format query then you have your matching fields a b and all these things and which you can do using your kibbana let me add that logo over here and that's here we go so now this is just a dashboard and here all the related things related to elastic search whatever we have indexed properly we'll be able to find out this is one way of doing it there is another way flavor two what if I don't want to take any of the headache graphana provides something called Loki out of the box.
This is by Grafana. Now this is not doing anything extra actually and this will be very helpful also which ELK stack is not able to do out of the box and you'll have to build another system for it when we are discussing about alert metrics over logs uh alerting mechanism not alert metrics but alerting mechanism over the logs metrics alerting mechanism is out of the box because of the inherent nature of metrics but here in this case first let me discuss Loki what Loki thought is obviously in Prometheus there was series 1 series 2 series 3 and each series is basically nothing but metrics plus labels hashing uniqueness and then expanded over your chunk and then start storing it.
Loki or basically graphana team thought that why not do the same with logs as well. I'll exactly copy the thing which graphfana says and also the link will be present in the description below and this is exactly what graphana loc is saying. So think of the log which it's reading has the initial label and metrics with it. Then it will do a stream ID of it exactly the converting it into basically a series of stream and this is the exact entry which is added as a chunk.
So additional log messages with the same levels are added to the same chunk because all of this convert to the same ID. So out of paper, too much paper, all of it are coming as part of the same time series chunk. Then all these chunks are then compressed and stored just like how we were doing with the metric system and separate and small index is kept to look up the chunk that is the inverted index table and this is a different uh stream ID all together.
So it will be going into a different chunk like a different stream and different chunk. So that is it because all the things that we had discussed in time series database the same thing is being actually done over here. So flavor 2 is very short in nature in terms of discussion because whatever is the inherent nature of TSDB the same thing they did with logs and stored it. So there are upside and downside of it. Downside is Loki never says that you can do very rich query.
The point is when I do a query of let's say uh payment what will happen is first the query will reach out and find out the exact block and then from the block the exact chunk this is based on the particular filters that I had put earlier that I want to look these these things. This is a prerequisite. I have to do a proper label based filtering first. Then it will be a GP. It's basically doing a full text matching search using power of grap over the logs that came as part of the chunks C1 C2 C3 different chunks and that is how this works.
Whereas in the ELK stack it is very rich in format. But because of this entire system the enrichment and the way elastic search you have to set up another node and then the kibbana over it. It's not kibbana but still even your graphana can ingest uh elastic search or it can understand elastic search. The point is this turns out to be cheaper with respect to this entire ELK stack or or at least the elastic search in itself and that is where you as an organization or as a developer whatever uh you have to think of which one you have to go to.
I kind of just gave out this particular flavor one and flavor two and we have kind of completed two very important aspects. We have ingested our metrics. We have also ingested our logs. Now we have to set up alerting. Obviously I have not drawn the log part here because I kind of drew it over here auto directly sending it to Loki. Loki is just like a black box at this point. I [snorts] will create another diagram when I have finally discussed about alerting mechanism and then I will combine everything all together.
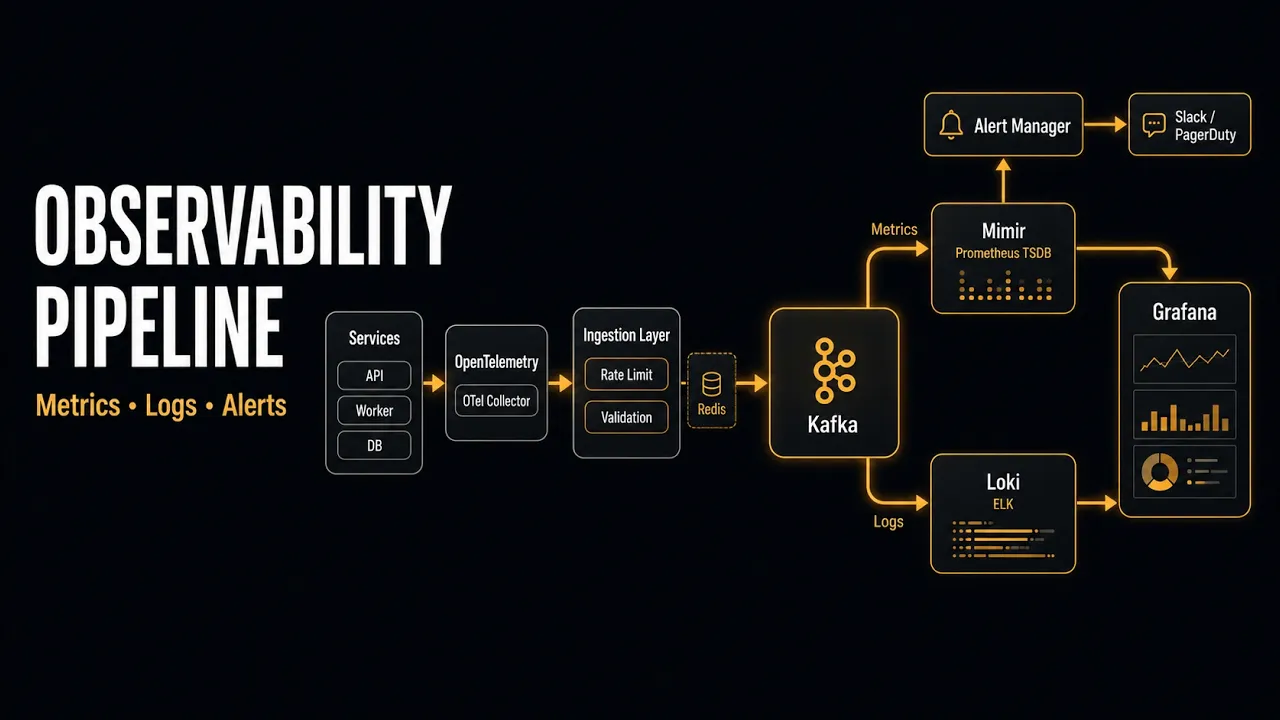
Now for alerting mechanism let me just quickly drop in this space with a different pen color. We have already said that all our metrics is coming from agents passing by load balancer in this case when it's a SAS and no load balancer because there's a load balancer then there will be an injection service. is I'm typing over here and then from there we will have obviously our Kafka and from Kafka there will be a consumer and then our time series database now this consumer and in case it's our own infrastructure this entire thing will be missing and directly from here it will go to Kafka now for alerting alerting is nothing but queries in a periodic fashion so why not I write it in this way there is my alert manager this don't mind the handwriting right now again because I will be giving a cleaner diagram.
Now the alert manager will do a query over here. We'll run alert evaluation and then finally once the alert has matched like whatever condition we're putting on the alert then it will push out to notification service which is basically aware or basically responsible let me change the pen to send out you know different places email slack pager duty all these places now it's easier said than done let me clean it up into a better diagram where I will be focusing on this part of the aspect and then I'll come into what each of these different components are doing.
So this is our cleaner picture and the reason I have knowingly drawn this part smaller and alerting service and notification dispatcher comparatively bigger is because of the importance on the topic that we're giving right now. First of all, there will be a rule evaluator kind of we'll draw in a flowchart uh state right now because this service is doing a lot of different things. So this is a conditional check step it is doing.
So it will be in taking input from the tsdb basically doing a query and there will also be the rules DB. Now this is basically a SQL DB. I'll be talking about the schema definition. Main reason being because the amount of writes that are happening over here is much lesser with respect to the reads and that too. This is not a main deal. This is very small in size. Every organization how many LS they will be having. Think about it.
And at the same time SQL DB and these are out of the box lightweight in nature. We are fine with it. >> [snorts] >> we can manage it in a proper schema structure table. The next thing is it will also take input from here basically the rules that have been set for this particular uh organization. It will do the query if conditions are met or not met whatever is the case there will be a state manager [snorts] and obviously this is a met rule.
Then the next thing will be firing. Here we will be doing routing and grouping. route and group what these individual things are like routing and grouping again it will have to reach out I will just do a pen color change it will also reach out to a SQL DB this right now I'm putting all of them positioning to the same DB at this point [snorts] and basically it's all about tables and finally it will then reach out to the notification and dispatches service now [snorts] this also needs to read from the DB that exactly what and all uh are the different channels and in the channels so where it has to send like in slack in which particular channel then what are the web hooks because by the web hooks state will be sending whether be in pager duty or other places.
So this is the overall state right now. First let me quickly discuss about this important DB like not about the DB but the schema structure so that we can discuss further that what these important different things are. This is a particular schema diagram that I was talking about. There are different things that I would like to draw attention to. First of all this is the main table alert rules where things are stored.
Now in the alert rules obviously we can give the name. This is actually a promql if basically Prometheus is your DB for duration is something very important. This is basically saying that after these many intervals basically sustain this before firing. Now the concept of firing of alerts think on this way. The moment your CPU metrics or whatever metrics was there for a particular label it has gone it was 9 and then it became plus one 10 and you had put a filter of greater than equal to 10 and alert will be fired.
[snorts] Do you keep firing immediately just after that? Obviously one fire is more than enough because after that whatever degradations happen in the system those are equivalent to this particular thing getting hit you don't want to but you want until it is not resolved. So once for example right now the moment it has gone into pending then it will be fired. So fired state and then resolved. This is exactly the life cycle that uh a typical alert follows.
I I'll explain it. Give me some time. So [snorts] from pending to fire to result what we are saying is we need to sustain it like okay it's pending but for the next 10 minutes if it is no more only one time this event happened after that there are no more sustained events then what is the event point of firing that is the for [snorts] duration we want to sustain it then also severity like what is the severity of this is it critical is it warning info because think in this way this entire alert in our slack channel like let's say payment bug is my slack channel here the pop-up will come with all that information or same pager duty also [snorts] I need to look at a glance that exactly what is happening so from here in the alert we have to set that what is the alert severity then the labels again this is [snorts] exactly the same labels which will be used to generate your basically in your query prom query and is it enabled or not because you can toggle there will be a toggle to turn it on or off so that is what enabled is coming from silences is just the opposite of alerts let's say you have all these in place but at the same time you want to silence some typical scenario for example In the case of billing, you have put the service down for some time.
So you will put a label of billing and while the engine is doing query, it will call from the silences part and see okay in with respect to billing services if the payment if not payment in this case CP or something is spiking up then we will so consider the alert rules as the master set and silences is the exception set that we are creating. So that when the new labels that we are applying are apart from your silences set then they should not be triggered and that is the reason when basically when you're putting your system down for some time you don't want to be treated as a uh alerting scenario and there are other scenarios as well.
Now from the alert rules this is the main part the alert instances for example when alert when it is created for example here as I said in the CPU usage when the CPU metrics has triggered or tipped over 9 plus 1 and became 10 and that is when my alert got created. So in my alert instance a entry is getting created and that entry is basically matched using the fingerprint. Fingerprint is nothing but hash of your uh rules plus like basically the rule plus the labels.
Same like we were doing earlier it was metric plus label. So here it will be the rule id plus the labels basically sorted labels. So that will automatically give you a unique fingerprint. Now you will be putting all the states over here like what is the current state of it either is it uh pending or it is fired or it is resolved because until it's not resolved you have to keep firing it but at regular intervals. So that is when these come into picture.
When was it last evaluated basically converting from fire to resolved and when was it last notified so that again a repeated notification can be provided. When was it last started at like basically when it was it started at so that the duration till the resolution can be tracked. These are the different things. Next is your routes and receivers. There's nothing much great about it. Routes is basically saying that I'll come to the matching labels part.
Routes is answering your which uh let me just change color over here which alerts go where and the main answer is being done using the matching labels here. So when we are saying severity critical and team payment this will be mapped using the receiver ID which we put over here. What is receiver? That also let me put them. Let's say the main thing will be coming from the type here. Let me put it as slack channel and config is a JSON binary of basically you'll have your URL.
This is the web hook and the channel name. Let's say alerts and this is your hooks. Slack your typical web hook structure kind of encapsulating it over here. So now think in this way once my alert has been fired it gets dispatched to my notification dispatcher over here. It will now reach out to my SQL basically my DB. It will just go and check the routes table do a query on matching labels. Once the labels are matched it will just check okay so this is the particular receiver ID.
So send it to this particular receiver and it will push out using that web hook uh to that particular notification point. Now coming over to the state management. I will first draw a state diagram to help you guys understand and then discuss further upon it. So think in this way. First when an alert is created it is in the pending state. Next there will be a firing state. Obviously when it will fire it will come to it.
Then if a notification is sent then it will be in a notified state. If the user acknowledges it then it will be resolved. Oh sorry it will be acknowledged. which ultimately is transitioning to result or otherwise condition closes and it is going to result now from pending to firing it's basically condition will hold for duration remember that duration that I had told here for duration exactly this this is going to determine that for this entire duration if the situation is present and it has gone to pending state so basically and entry got created in a table that uh alert id which we have here fingerprint basically and then it is in a pending state then it has been closely watched for that particular duration using these things like when it was last started started at until how long it has been.
So basically if we do a now minus started at greater than equal to the for duration using the alert rule because we already have the rule id. So we will be doing a join over here in this table and taking the for duration from here. Then transition it to this uh firing state. So it will now go to the firing state and once it is going to the firing state that means we are have to now do a routing and grouping over here.
And you guys might be thinking what is the routing and grouping. So taking two words from here the grouping part is or basically together large scale systems can trigger thousands of alerts per minute. So to avoid overwhelming on call engineers alerts are grouped and routed intelligently. Groupings are basically done on label combinations like job region severity. So basically once we have that severity and region in picture this group by clause will come into picture and group weight.
Group weight is nothing but wait for these many duration to collect a burst before first send. For example, these many alerts have been accumulated. So for how long do I accumulate before I send? So it will be somewhere around 30 seconds, 20 seconds. That grouping is there and then all that will be sent in burst by the notification firing dispatcher. That's it. And anything else in case it has not been resolved yet then the repeat interval comes into picture.
Let's say 2 hour, 1 hour, whatever resolution we put. If it has not been resolved, then again this interval will uh after these many intervals, it will uh again be repeated. The notification will be again fired. This is as simple as it can get. There is not much complexity over it. This is the entire life cycle out of which notified and act are not exactly the states. It's just that me saying that if it is notified is equivalent to an act state and it will be considered as resolved or if it is not matching that condition like from pending it will be going to it is not exactly firing it is basically a short circuit.
So it will be resolved. In case this life cycle is creating some confusion, let me just add a very cleaner text here as well. So what I will say here is simple. First time when the query became true. This is the first time our state converts to pending and it is started at is basically recorded over here when it was started at alert instance is created with the fingerprint everything and start at is recorded. This stays true for the whole for duration.
Example we are putting let's say 10 minutes. If the query is true for the entire duration sustained we start because we are keep quering over here for those 10 minutes and we are monitoring it. Then we will convert the state to firing to the notification service will be handling these all details and it will be dispatched off. Once the condition clears then the state is resolved sends the result notification then cleared obviously.
And now after that the second case say thing has been fired and we are over here. So basically this is the firing state and we did a firing at 10 and we notified. So we tracked the last notified at 10:00 a.m. Now at 10:15 it is still firing because the conditions are still being met. Do we really want to fire? Is it firing but 15 minutes is less than the repeat interval that we had put. So we will be staying silent. At 10:30 we are still firing but silent because we have put 4 hours.
Now at 2 p.m. still firing 4-hour window is elapsed since the last notified at time. Then we will do a renotify because why these have been put into place is because maybe the engineer has forgot to take an action on it or it is going into a severity mode where still it has not been resolved yet. So reset the last notified to now 40 2 p.m. and condition is cleaned and send resolved once then done if it is clear. Simple the logic each evolution cycle is simply if state is firing and now minus last notified at is greater than equal to repeated interval which I had written over here then send notification and then set the last notified at now as simple as it can get this condition.
So at this point we have actually covered all the things of it. Now you might be asking how the alert looks like. So I already have added the alert part. Let me just cut it from here and kind of position it over here. Yeah. So this is typically how a typical alert looks like. So you have your alert name mentioned it's your expression and yeah to read it out loud this is saying HTTP request total and these are the labels.
Now this within bracket means for the next 5 minutes it should be valid and within that window if that count goes greater than 0.05 that rate then this is for the next for 10 minutes duration it should be true for 10 minutes. This is the window I kind of forgot but yeah for so long I have been saying it window but I forgot it right now. This is the 5 minute window for which in that window if I see a count of greater than 0.05 05 and this is sustainedly true for the next 10 minutes then we have to raise this alert and the label type will apply to it will be severity of critical and annotation will be something like this is the like we are mentioning it as 5 like the message will be coming as 5x rate the exact value on the particular label service so kind of finally summarizing up we have not reached the end of the story but we will kind of summarize it up here we have all the right path of present here then for the read path I'll I'll first put the alerting mechanism and then go towards the read path we have our the alert manager this time much smaller and we have the notification dispatcher not writing full thing over here obviously we also have a SQL DB they both will be reaching out to SQL DB and this will also be reaching out to the TSDB because it has to kind of evaluate as I had shown over here the evaluation step then once alert mechanism has understood this part that thing is looking from pending uh has detected it as a pending then it will push it to fire once The for duration is matched and obviously it will go to the notification dispatcher and it will be fanned out to the different notification points.
And for the read path we have our query service. I will be putting the dashboard. Now here it will be reaching to a query service and this will also be asking the TSDB and getting all the necessary information here. If needed we can cache but technically the way TSDB works everything is in memory hot. we can introduce a cache over here and keep that data points if too much uh query is being done. So this also helps. This is from a SAS perspective in if it is on infrastructure then we remove all of this.
Now coming to the log part which I had kind of removed out. We can either directly go via the Loki step and things remain very simple. So it has reached and I'll treat this entire thing as Loki because this is just like a TSDB but not TSV or a variation of TSDB. And then we also already have our dashboard graphana which will be so let me do a dotted line or a green dot and it will do the query service and provide in the dashboard or otherwise let me not uh erase it but kind of show it in this way and generally this step is mostly done in on-prem system only that we are consuming it using our log stash then we are enriching it with our flink and then we are passing it into elastic search and then we are using kibbana dashboard and we quering the elastic search again kind of same graphana would also have done the same thing so kibbana/g grafana and we would have got all the necessary things this is our service generally this is followed in our own infrastructure and loi is followed when we are using SAS and offloading the entire head onto graphana so this is our typical thing this kind of completes the discussion there's only one thing left because we are designing a system the problem will be cardinality explosion and there is a very easy way to even control Remember [snorts] cardality problem.
So when we have introduced different labels for a particular metric, we choose a particular label which is very high unique values in nature. For example, UU ID. The UU ID if chosen example user ID or any other ID immediately leads to cardity explosion. The meaning of it is it is in the range of the entire length of UI. Let's say it were of six bits then 10^ six variations exist and that many different on paper theoretically can exist and also in reality it will happen because logs will be keep sending on UUID pattern and our TSDB will just hash using the metric plus label combination.
Let me just clean up this mess over here just to give a brief idea again on what I had said reiterating over it. Say this is my metric and in that my labels are method and status. Method can be what? All the verbs of our rest API like get, post, put. Let's say I track get post and put and in status let's say I'm tracking 200 series, 400 4 and 500. So these are three. These are three. So overall uh we have three into three only nine unique series coming up.
Now say someone accidentally or knowingly we don't know like maybe they did not think of it up front they took a method they took a state and they wanted to for any reason track against a user ID as I was saying earlier so already here we have three we have three think about user ID I'm just giving a number over here let's say 5 into 10^ 6 5 million now multiplying all of it we have around 4.5 into 10^ 7 and this is called explosion so like this is our cardinality explosion We need to control this and we do not want this kind of rogue behavior to uh overwhelm our DSDB.
Already in Mimir we are making sure that per tenant we have segregation and one tenants's mistake does not affect others that is already sorted but for this tenant also we really don't want. So what we will be doing is giving service kota and basically for every different tenant we will have a kota number a global number for that we will be using the concept of radius. Right now I'm just drawing the radish box and say we have this kind of a thing the tenant ID I'm just defining a key I mean bear with me and this is your series and it will be a sliding window basis.
So currently let's say I'm giving a time of 226 6 8 current time is 8:00 a.m. So let's put it as 8. Now this is our key in which we will be keeping this is our set basically this is our hourly set. This this nature can be changed. Hourly means our window can be 1 hour, 2 hour, 3 hour. And how this window is managed, we'll look into it quickly. We will start adding each. So when a new key is coming, so basically when basically when a new metric along with its label is coming, we hash it and we get a number like let's say a102 something of this sort, we add this number over here.
So basically it's called s add. We add a member to this key uh to this set. So a102 is added and we also manage a counter. So we will take this part tenant ID and we will take count and again a similar time stamp and here initially this number is set to zero by default. Then we will use increment to auto atomically increment it by + one every time we have something new. The logic would be something of this format. We first check if is member or not.
So that means let me copy this part and paste it over here. When we have some new thing which is indexed to a102. This is basically our metric plus uh label at this point. I won't be repeating anymore this point. It is becoming quite redundant. So let's treat it by hash. Right now we first check if a102 is present in this set or not. If it is not present then add to the set and also increment counter by one. Incr counter. this counter that we have by + one and we also have a kota for this tenant.
So for this tenant id we have say 10. So what we are saying is that in 1 hour we allow this window also we can decide the point is we have control from an organization like from a customer [snorts] not customer from an or perspective that in 1 hour window how much we allow. So in 1 hour we allow a series of say 10 in this case. If we are adding this to the set here again repeating add to the set increment counter and before even incrementing so let's not increment the counter check global count if uh your current count I'll be kind of writing it with a permanent pen only at this point.
If current count is coming from the uh the counter itself is greater than or equal to the kota then we will skip it because we will be returning it that means we are kind of rejecting this otherwise we are good to go you know what at this point I think I will write the entire script over here that will give you guys a direct visibility on what I'm trying to say this is what I was talking about so a few things that you'll have to understand take a pause in the screen and kind first absorb what I'm trying to say.
This is basically a Lua script which directly and automatically works on the radius. Now we have a key with the series name then another this is this is the tenant ID like don't consider accounting name but it is the tenant ID. This is also a tenant ID. Then this determines this is the series this is the set and this is just a number that counter key and the set key. We will be doing uh we'll be passing a hash. This is our argument and the kota in this case uh three we are taking three per hour.
And then the detail for key in seconds. So how much is the expiry that we're putting? So simply put first we will check if it is member or not member of this key. If it is not a member so exists if it is returning one then it is a member already exists. If it is zero not exists. If it does not exist then we have to add it because obviously it's not present already. But if it is already present then it is not a unique key.
We are seeing earlier we have already seen it and we have accepted it into our kota. So we will just return. So basically exit this loop. But in case it is not there then we come out then we check our current like what is the current scenario current counter value and what is the total limit that we have now this is three per hour and say here we have got a new counter of the current count. So we are checking immediately the current count greater than equal to the three or not.
If let's say we have a 103 a10 and a 103 coming up. Oops. And now the overall count is three and this is obviously greater than equal to three. true that means we have to reject so we'll be returning zero. Now it's simple thing if this is false then we are under the kota we just have to add this key along with the value and we'll have to increment our key obviously here we are putting a dtl uh so this sorry um accidentally I wrote in bad way so here s add is basically adding the particular uh value to the key here simple thing in the keys one you can see the set name and in the arg1 we are putting the hash so passing a102 in this case a this is already present this is already present a103 is part of this new uh and then we'll increment it.
So now the counting value will also become from two it will go to three. Now we will put the expiry TTL. So this was our hourly window. Right? Now if let's say we assign this we want three per hour then we will put an expiry of 1 hour then we will put 1 hour into seconds it is almost uh 3600 not almost it is equal to 3600 but if it were 2 hours then we will put 7200. Similarly this number will also keep changing. Now 22 means 10 p.m.
So technically this thing will change. I'm just giving an example over here. I had to kind of think of a number but generally this will also be a epoch time stamp. So that time stamp also will change. So now this entire set will also become obsolete because this let's say it's set one ultimately after 1 hour window radius will not be checking in this set. It will be checking in our set two. So this way we have managed our kota as well.
And where it will be present? This entire machinery will be present just before Kafka when we are getting into our injection service. Then we will be having this radius and injection service will be uh running this and quering against our radius and then if it gets a success like if it gets a go then it will pass into Kafka and then obviously it will be consumed by the consumer and then feed into the TSDB won't be repeating the same story again.
And this completes our uh cardality explosion problem as well. At this point, let me go back to the previous diagram where a lot of things were drawn. The only thing I did not draw here was the Kafka. So, let me reintroduce over here. Uh sorry, uh I did not introduce radius. So, kind of putting it over here for Kota. And we have a very running and working alerting system as well as metrics and log monitoring both done.
So obviously here what short circuit we are doing is Loki when we are going by a SAS path but in case it were not a SAS then we will be passing it into our own ELK stack which we had already discussed up above all these places. So you can go back to this segment of the video and check this out the entire log stash part and this entire pipeline finally reaching out to the elastic search and then querying it to Kibbana.
Now comes the bonus section because at this point our entire system design of the end to end absorbing the metrics as well as logs and then monitoring it via the dashboard as well as putting the alert mechanism everything has been covered. You can skip the video at this point but otherwise I would say because extra knowledge doesn't kill anyone. So here we go. This is actually called open telemetry. So the O is for open and T is for telemetry.
This is the entire ecosystem for telemetry that is collection and metrics monitoring of logs, metrics and all these other parts and this is a subsection of it which we say as open telemetry protocol. So same thing this is the standard and this is the way by the protocol by which this ecosystem is managed. Why this came into picture? Just uh try to understand in this way this is my server and uh here I want to first I was using today a vendor called graphana.
For that I had my Prometheus agent. They provide Prometheus agent out of the box. So I wrote my script as per Prometheus agent. Uh this is not the scene right now. So let me try to give a scenario when OTL and OTLP did not exist. You had to flesh out your logs and those logs and metrics they had to be collected. Now for even metric collection in your say file this is your let's say some something py file. Whatever metric you want to collect, you have to kind of accumulate it, aggregate it and then via some SDK, you will be then finally passing it over and this graphana will be providing this SDK.
Now using this SDK, you are kind of locked in or you can say vendor lock in. You are uh vendor locked with graphana because they are controlling how the SDK behaves and what kind of output the SDK gives and this is only understandable by Prometheus and it can only be reached out to Prometheus DB. But what if tomorrow I want to shift to data dog or I want to keep my own elastic search or I want to manage my own logs in my own way.
I do not want to reach out to any of them. I want to kind of experiment and build my own things. That is where the concept of open telemetry came into picture. And under that this protocol started coming into picture. What this protocol says is you cannot log in. So SDK as well as the agent or the collector via which the push is happening to finally the metrics are getting pushed to the TSDB. They have to be very generic in nature and there is a standard that is followed.
Generally we have a YAML file and those who are obviously aware of it they will know the stat syntax is like you mention your receivers you mention your processor then your exporter your service. Let me just paste the snippet over here and explain some of the concepts line by line and then you it will start making sense to you. So as I was saying over here this is the syntax of the collector basically and what is collector at this point this is your server and this will be your collector which will be pushing it out all those metrics logs traces everything.
So we will be focusing on metrics and logs. So we define the receiver the processing that we have to do the exporter and the service this is the main thing. If service is not present mentioning any of it doesn't make any sense. Now coming to the receiver part we are defining basically so this is our let's say file something py we use the SDK to and here we will be defining I the next discussion will be on this only how the SDK based looks like now this has to export the data on something on basically port let's say 4317 and 4318 based on whatever is happening gRPC and HTTP in this case generally we [snorts] use gRPC I mean services prefer gRPC because it will be using protobuff and there is so much data that is going from one side to the other that by default if it is encoded using protobuff then it is much easy for serialization deserialization and that is where it becomes powerful though this is not really part of the discussion right now but just saying kind of that obviously so much data is being sent over the network from one end to the other to the other like one hop is from your service to the collector and from then your collector to the actual export area like data dog or graphana [snorts] all these places so all where every place you mostly do over gpc but you can also do over HTTP now coming back to the point you are just saying you're saying what kind of receiver it is an OTLP receiver you're following these two protocols and these are the end points where from uh where from where the collector has to receive basically this is as I said earlier this is the collector YAML collector is present here your file is sending so there are different files all getting pushed to this collector and collector is sitting in your server and then this server will this collector will then reach out to your uh say Prometheus so this is what is written over here this is the receiving end from which all places it will be receiving via what port 4 317 4318 what processes are to be done generally batching is there and this is like called default otherwise if you don't want to go for default then you also have things like timeout batch size max size so but here I'm just going with default as simple as it can get and the other part is how do we want to enrich the logs so all these logs we want to enrich with the environment value so main is the environment what it is it's the production and we will be inserting it so that is what we are saying so this key value pair will be present in all the logs as like pre part of the enrichment.
Next [snorts] is the exporter basically. Now this collector because this is following OTLP protocol. So it is agnostic. It can send to any OTLP. We are sending to both Loki. This is for logs and this is for your metrics and there we are saying how to send endpoint for Loki is in this and endpoint for Prometheus over here. And here in the service we are saying which pipelines we have. One is the logs, one is the metrics.
In logs we are saying the receiver is of TLP type. We are applying these two processes batching and resource. The one that we have mentioned over here. Let me just remove the clutter and here exporter is of type OTL http and Loki this one and in metric case it will be Prometheus. So this is what we are seeing exporter is of type Prometheus. So here you can also see that if we had saved Prometheus then it would have exported to Prometheus as well.
So we can do the full granularity on the controller using this OTLP protocol and in this processor we are only applying batch because this is enrichment of logs only but if you want you can apply batch as well as resource over here as well. So that's what this example is just to help you understand that there are different things. First you define these three and then the combination of what you want to do with the receiver, the processor and exporter in the pipeline part.
That's it. Now coming to the final part of it how the SDK implementation in the file looks like. First I will bring your attention to these two important points. What we are sending here? We are sending a metrics request counter and latency histogram and we are logging. So we are checking the log as well as metric. In the metric we have two things. One is the counter of the HTTP request and one is the histogram uh time based bucketing that we are doing in these two places.
All right. [snorts] Now having said this, keep your attention to this point on log. This is a bottomup approach. I mean generally this is how I also study a code when I have to first I see the things which I really understand. So in handle request this is basically mocking the HTTP request. Here we have what we want to log and let's say we are logging both the good part and the exception exception error part as well.
Now this is my attribute the method and the status. In the log we are passing request handle with the extra parameters and in the log we are handling these things. Generally you might have seen that only doing the log get logger and then passing the log.info debug error all these things but we do something extra in the logger. First we create a handler. Now this is actually coming from the OTLP SDK. It will be a from OTLP dot uh I forgot the exact library library name but you will be importing this particular logging handler and you are passing those meta information and then in the get logger add handler you are passing this handler.
Generally we don't pass the handler but in once we have to push it out from the logger to the OTLP part then we push this add handler and also we are setting the level beforehand. This is basically from a [snorts] filtering level that because we are putting info then everything above uh more than info will be logged and debug level of stuff will be filtered out all together that switching we are controlling over here but okay enough said on this now the important part we are getting the logger and then we are starting logging.
Now for the metrics part also we are doing the same thing. Check these two metrics. This meter is also coming from the OTLP uh library only uh OTLP SDK. So you just have to create the counter and in that you pass the exact request uh metric name and this is the label that you add finally. So here you see the attribute the label that you have created method and status and in the request counter the metric name is already passed and the attribute is also passed.
Same goes for latency histogram metric that you have created using this name and in that you pass this attribute method and status and in histogram you're adding some uh additional parameters that how it should be uh bucketed in seconds and the description you are passing. Same goes for here meta information just before that how the meter is created. This is basically metrics.getmeter get meter of you're naming it basically how to in the graphana or wherever you have to see it finally it will be saying order API as a service name and then for that order API in this service name this is also basically part of your label that will be added here so or it will act as a tenant ID also it can act as both and this is the metric reader class that you're creating then in the set meter provider you're passing this metric reader class and then finally creating the meter object and obviously it is governed by a resource this you're creating one time obviously there is too much depth in it I haven't gone this is something you guys can look into I'll provide the resource of the library in the [snorts] description and here we conclude the entire discussion on our logging collection or log monitoring metric monitoring and alerting system.
Remember earlier I had also told about the correlation ID. Correlation ID is nothing but say when you have distributed services like in your ecosystem or in your system design and
The words are the caption track's own and nothing is reworded or re-transcribed. Paragraph breaks are placed between sentences so the text reads as prose.
Free tools for your own script. No signup, no login.
Paste your draft and see where viewers are likely to drop off, with a rewrite for each weak line.
Paste the first 30 seconds of your own draft for a hook score and rewrites.
Check your draft against YouTube's advertiser-friendly guidelines before you record it.
Read this channel's public videos and transcripts, and download a writing brief for it.