Getting the transcript
Reading the captions from YouTube. A video nobody has opened here before takes 10 to 30 seconds; this page fills in on its own.
Getting the transcript
Reading the captions from YouTube. A video nobody has opened here before takes 10 to 30 seconds; this page fills in on its own.
Cue Banks · @CueBanks
Words
1,285
Runtime
4:57
Speaking pace
260wpm
Reading time
5min
260 words per minute, above the 201 75th percentile of 349 measured videos. That distribution comes from the 349-video hook study.
Opening (first 30 seconds)
Reading the chart is the one thing that holds most traders back, and they don't even know it's a problem. I didn't either, [music] not for years. I'm Q, 12 years trading in the Forex market, and even after I was past all the beginner stuff, reading the chart clean still didn't really fully click for me. Once it did, everything else got a lot easier. If you've ever looked at a chart and have not been fully fully sure of what it's telling you, this is the only video that you'll need. By the end, you'll be able to actually open any pair [music] and read it clean. Structure, direction, all of it. It looks intimidating, but it's only showing you where the money [music] is going. I used
130 words, the words spoken in the first 30 seconds at 260 words per minute.
Free, no signup. See how the first 30 seconds hold attention, with rewrites.
Sentence shape
| Measure | This transcript |
|---|---|
| Sentences | 110 |
| Average words per sentence | 11.7 |
| Longest sentence | 38 words |
| Questions asked | 4 |
| Sentences containing a number | 6 |
Most used terms
Filler phrases
9 in total: actually 8 · right? 1.
A literal whole-word count of the same phrase list the Prepublish browser extension uses, so a phrase inside another word is not counted and a phrase used in its ordinary sense still is. It is a count and not a judgement.
What this transcript is
Every word below is the caption track YouTube publishes for this video, pulled from the video itself and reproduced unchanged. It is not Prepublish's writing, not a summary, and not a re-transcription: it is the video's own published captions. English captions, generated automatically by YouTube, in the video’s original language. Source: the video on YouTube. A channel that would rather this page did not exist can ask for its removal through the contact page, and it is removed.
No Script X-ray for this video: YouTube shows a Most replayed graph only once a video has enough views.
Reading the chart is the one thing that holds most traders back, and they don't even know it's a problem. I didn't either, [music] not for years. I'm Q, 12 years trading in the Forex market, and even after I was past all the beginner stuff, reading the chart clean still didn't really fully click for me. Once it did, everything else got a lot easier. If you've ever looked at a chart and have not been fully fully sure of what it's telling you, this is the only video that you'll need.
By the end, you'll be able to actually open any pair [music] and read it clean. Structure, direction, all of it. It looks intimidating, but it's only showing you where the money [music] is going. I used to stare at all these for hours and nothing but noise. So, [music] if that's you, you're in the right spot. No fancy words and 50 indicators. I'm 10 years plus into this, and I'm telling you it's way easier [music] and way simpler than people make it look.
They overcomplicate it on purpose. So, let's get into it. So, first, let's take the mystery out of it. A chart is just price over time. [music] That's the whole thing right there. It looks intimidating, but it's only showing you where the money's going. Every candle is one story, where price opened, where price closed, how high it reached, how low it dropped, and whatever time that candle covers. One-hour candle, that's one hour worth of a fight.
Green means the price closed higher than it actually opened, buyers won that round. Red means that it closed lower, sellers won that round. The body is a thick part. That's where price opened and where price closes. The little wicks poking out, that's where price [music] stretched on the highest point and the lowest point and it pushed back down and then closed at a different point. That's it. Don't overthink a single candle, cuz when you zoom out, all these candles together are telling you one thing, who's winning, [music] buyers or sellers.
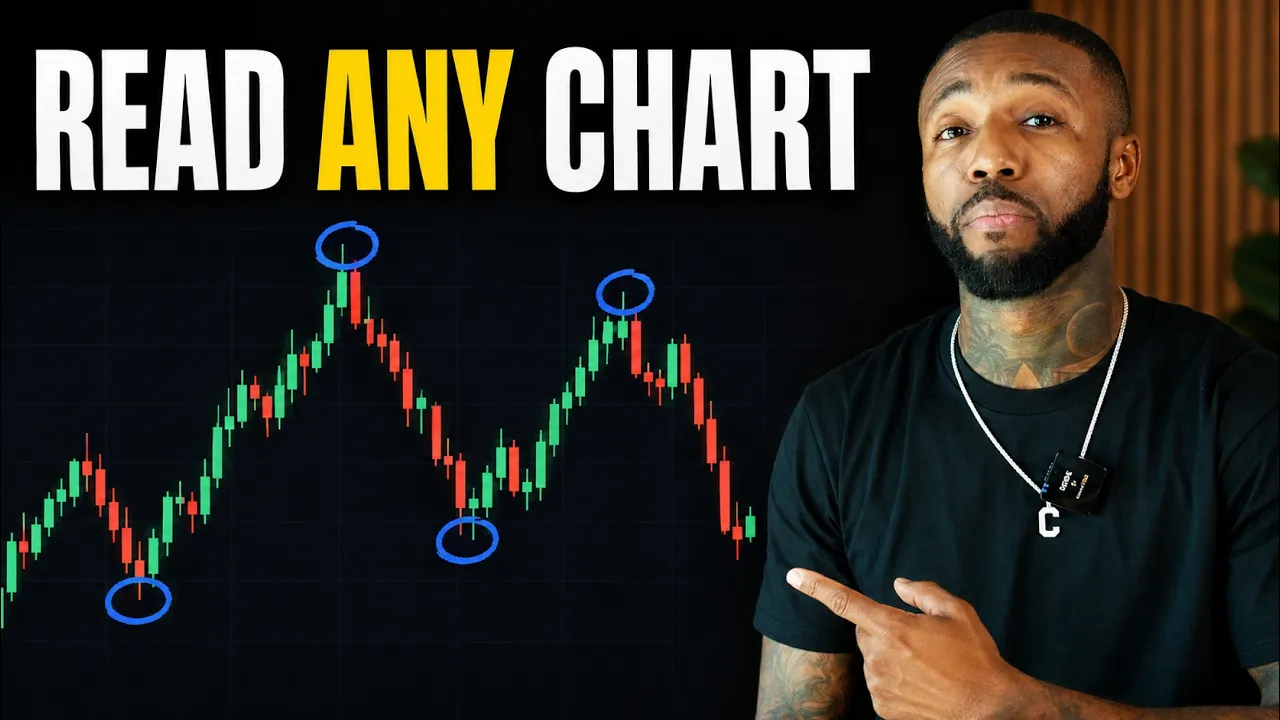
That's all you're really trying to figure out, direction. Now, the single most important thing I can teach [music] you is what I lead with in everything I do, structure. Always structure first before any indicator, before anything that you've ever downloaded, structure is just one thing that [music] shapes the market and tells you how it's moving. And it's simple, market moves in highs and lows. If you're seeing higher highs and higher lows, the price pushes up, pulls back, stays above where that candle started, and pushes on a new high, that's an uptrend.
Buyers are in control. [music] Flip it, lower lows and lower highs, price drops, bounces back or a little bit weak, drops lower, that's a downtrend. Sellers own it. So, that's structure. The whole thing is you want to pull up a chart and ask yourself one question. Are you making higher highs and higher lows or are you making lower highs and lower lows? That's the direction right there. And direction is everything cuz the whole game in trading you got to pretty much know it because if you're not you'll be lost every single time.
Now here's where I lost money in my early days. So really hear me out on this one. Price never moves in a straight line, never. [music] Even in the strongest uptrends you'll see it looks a certain way but then all of a sudden you zoom into a lower time frame and all of a sudden it's it's zigzagging, right? So those little dips and little pullbacks all those little dips are exactly what destroyed me. Cuz it'll be a clean uptrend, price would dip a little bit and I'd panic think the whole thing is flipped around.
I'd bail out, flip short, then I watch it rip right back without me every single time. It wasn't a reversal, it was just noise the entire time. A small move inside a much bigger move. The bigger picture never ever changed. I just couldn't tell the difference between the real shift and a normal wiggle. So here's how you tell. You zoom out. When things get a little bit scary on a small time frame you go up one time frame or even two time frames.
If that's scary little move doesn't even show up as a real move on the time frame that you zoomed out on, it was just a little little blip inside of the bigger trend. You stay with the big move. You float with the trend. The second you learn how to do this and you stop getting shaken out by all of the smaller movements, you actually can actually take advantage of a good trade. And that alone will save you so much money that any indicator would.
Next piece, this one ties it all together. Not all time frames are equal. The bigger one always wins. So now I go top down every time. Daily first for the big direction then H4 then H1 then I come down to time it. I read the direction up top where it actually matters then I drop down to find my spot. Get your direction from the big time frames first, always, then come down. Do that and you stop fighting the market without even knowing that you're fighting it.
Let me put it all on one chart so it clicks. I pull up the daily. First question is do I see higher highs or higher lows? Okay, uptrend. Buyers are in control. So right away I've made a decision. I'm only looking for buys. I won't even think about sells today. That one choice already puts you ahead of where I used to be. Then I drop to H4 just to check if it agrees. Still bullish? Good. Everybody's pointing the same way.
Now I come down to H1 and here's the discipline part. I don't chase it. I buy it way up here where everybody else is and I'm going to get screwed. I wait for price to pull back to come down to a point that actually makes sense. I let the market come to me. And that's reading a chart. Structure tells you the direction. Top-down make sure that the big time frame is leading you, not the noise. Then you wait for price to come to your spot.
No more staring at candles with no clue. You could open up one pair, any pair, and actually know what is going on. So that's it. That's how you read a chart from scratch. It was never really magic. It's just price telling you a story if you listen. Structure gives you the direction. Zooming out keeps that little wiggle from faking you out. And top-down keeps you on the right side of the market. Master just this before entries, before anything fancy.
Cuz here's the truth. If you can't read a chart, nothing else you learn is going to work. It all sits on top of this. I skipped it and paid for it for years. Get this part down first. And when you're ready to go with past reading a chart, I built a full road map that takes you from right here all the way to real entries, managing live trades, every step in the right order. The way that I actually learned was the hard way.
So pretty much you have a cheat code. So if you're serious about doing this, check out the link below. Let's get to work. And I'll see you guys on the inside.
The words are the caption track's own and nothing is reworded or re-transcribed. Paragraph breaks are placed between sentences so the text reads as prose.
Free tools for your own script. No signup, no login.
Paste your draft and see where viewers are likely to drop off, with a rewrite for each weak line.
Paste the first 30 seconds of your own draft for a hook score and rewrites.
Check your draft against YouTube's advertiser-friendly guidelines before you record it.
Read this channel's public videos and transcripts, and download a writing brief for it.