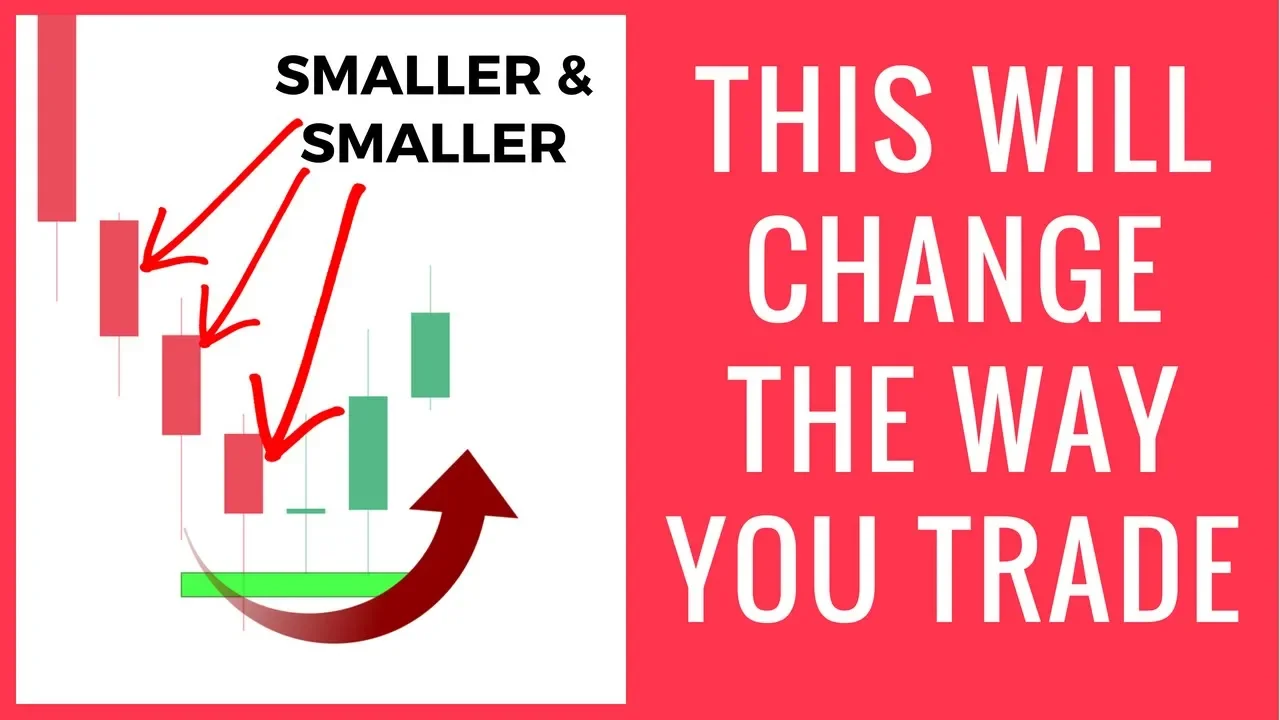
Best Price Action Trading Strategy That Will Change The Way You Trade transcript
Wysetrade · @Wysetrade
Words
1,513
Runtime
9:29
Speaking pace
160wpm
Reading time
6min
160 words per minute, between the 160 25th percentile and the 181 median of 349 measured videos. That distribution comes from the 349-video hook study.
Opening (first 30 seconds)
Hey guys, in this video I will show you a price action trading strategy that will change the way you trade. Now the core of the strategy relies on the concept of momentum loss shown through candle sizes and shapes which is a very powerful price action technique. Here we have the Kiwi dollar. So if you've watched our other videos, we always want to identify key levels first. And as you can see, we have a level of support
80 words, the words spoken in the first 30 seconds at 160 words per minute.
Sentence shape
| Measure | This transcript |
|---|---|
| Sentences | 93 |
| Average words per sentence | 16.3 |
| Longest sentence | 50 words |
| Questions asked | 0 |
| Sentences containing a number | 0 |
Most used terms
- candle56
- price44
- level27
- support25
- smaller24
- resistance22
- rejecting17
- approaches14
- smaller candle13
- candles11
- green10
- big9
Filler phrases
5 in total: like 3 · I mean 1 · you know 1.
A literal whole-word count of the same phrase list the Prepublish browser extension uses, so a phrase inside another word is not counted and a phrase used in its ordinary sense still is. It is a count and not a judgement.
What this transcript is
Every word below is the caption track YouTube publishes for this video, pulled from the video itself and reproduced unchanged. It is not Prepublish's writing, not a summary, and not a re-transcription: it is the video's own published captions. English captions, generated automatically by YouTube, in the video’s original language. Source: the video on YouTube. A channel that would rather this page did not exist can ask for its removal through the contact page, and it is removed.
Transcript
Hey guys, in this video I will show you a price action trading strategy that will change the way you trade. Now the core of the strategy relies on the concept of momentum loss shown through candle sizes and shapes which is a very powerful price action technique. Here we have the Kiwi dollar. So if you've watched our other videos, we always want to identify key levels first. And as you can see, we have a level of support here where price hit and reversed from.
And now we are back here again. Now, here is a very key point you need to know in order to spot high probability reversal trades. We want to see candles getting smaller and smaller as they approach a level of support or resistance because it shows that price is losing momentum. Very key point. You want price to be losing momentum and slowing down as it approaches key levels. Now, as price approaches this level of support, look at how the candles behave.
As you can see, we have a big candle followed by a smaller candle followed by an even smaller candle, another smaller candle, and then a smaller long wick candle rejecting support. And then finally an even smaller green candle that is also a dogee and also an inside bar which is a reversal candle. And this results in a bounce upwards. So I'll show you this again on another pair. Here we have the Aussie dollar. This is a key level of support.
As you can see from when price got here last, it hit and reversed upwards. So as price approaches this level again, we have a big candle, then a smaller candle, an even smaller candle which is also rejecting support and then we have this beautiful green long wick candle rejecting support and then followed by another great inside bar candle rejecting support as well. And as you can see price bounced upwards which would have presented a great trade opportunity through the intraday time frames.
So when approaching support, what these smaller and smaller candles show is that the sellers and people shorting the market are losing steam. Meaning some sellers might be taking profit as they notice this level of support, which causes these smaller candles. So let's jump to another example. Here's the Kiwi yen. As you can see, we have a double top here before price tanked down, making this a key level of resistance.
Now, as price approaches this level of resistance again, look at how the candles start acting. We have a big candle followed by a smaller candle followed by a smaller red hanging candle, another hanging candle, and then a candle where the wick is rejecting this level of resistance before dropping down, which was another great trade opportunity. Here's the CAD Swiss again. We have three rejections of this level before it reversed downwards which makes this a key level of resistance.
As price approaches this level again, we have a big green candle, a smaller green candle where the wick is also rejecting resistance and then an even smaller candle which is a red bearish candle. And as you can see, price reversed downwards. Now, here's a pro tip. Look for a candle color change at support or resistance which can signal a possible trend change. I'll show you what I mean. So, as price is moving upwards, notice all the green candles.
Green candles represent bullish price action. As you can see, there's eight green candles in a row before finally a red bearish candle appears. And the most important part is that it occurs right at resistance. And as you can see, price then reverses. So if you want to learn more in depth how to identify these key levels of support and resistance, head on over to our website at wisetrade.com where you can learn this for free.
Now in the following examples, I'll show you price action you want to avoid. Here's the Aussie Kiwi. As we look to the left, this is a clear level of resistance. Now look what happens when price approaches this area again. We have a small candle, but then the following candle is a large candle which shows a gain of momentum. You do not want to see momentum gaining as it approaches these key levels because if price doesn't slow down, there's a high chance it will break right through these levels.
As you can see, there was no price action that signaled a reversal. So, I'll show you this again on another pair. Here we have the dollar CAD. As you can see here, we have a double top and then price reversed giving us resistance. Now look at what happens as price comes up here again. We have a small candle and then a massive engulfing candle which shows that price is picking up speed and momentum as it approaches this level showing that buyers are in control.
Now this next candle here shows that people tried entering short but that failed and price blew right through which is a mistake that most beginner traders would make as they would have seen this long wick candle and thought oh this is a great short. Be very careful when you see large candles approaching support or resistance levels. So let's jump to another example. Here's the dollar yen. You can see we have a double top here making this resistance.
As price comes up and approaches this level, we have a big candle followed by a smaller candle that is rejecting this resistance. Another candle rejecting resistance and then finally a red candle also rejecting resistance before price reverses downwards. Now, here's a perfect example of momentum loss not occurring as it approaches this next level of support. So, we look left and see two rejections of this level, making it a good level of support.
But now look at what happens when price approaches this level. We have a massive bearish red candle showing that momentum is picking up and that sellers are still in control. Here is another mistake beginner traders make as they see this small green candle which is just some sellers taking profit. But it is then followed by another bearish candle before breaking right through. Meaning that there was no buy opportunity at this level of a support. look at the difference between what a good reversal looks like with good price action versus what bad price action looks like.
So, I'll do a few more examples to drive the point home. Also, if you guys like what you see and are enjoying the content, please leave some comments below and hit the thumbs up as this goes a long way for us. Here's the dollar Swiss. We look left and we had a double bottom and then price went up making this support. And as you can obviously see there was no trade here because price makes a massive bearish engulfing candle and blows right through support.
In contrast, look at what happens at the top. We have a level of resistance here to the left. And as price approaches this level again, we have a big candle, a smaller candle, an even smaller candle that is also a dogee and also rejecting resistance. Then finally a red bearish candle that is also rejecting resistance which then caused a reversal and then we entered a trade through the intraday time frame. Here is the Aussie CAD.
We look left and have a clear level of support here. As price comes down here again, we have a big candle, a smaller green candle, a candle showing the upwards buying pressure and then a beautiful long wick, smaller candle rejecting support before price took off upwards. This occurs again once price comes back down to this area. We have a big candle and then a smaller long wick candle rejecting support. Another perfect long wick candle rejecting support and then a perfect green inside bar longwick candle rejecting support and then price reverses upwards.
Trading should not be hard if you know what you are looking for. Let's do one more example. Here is the pound Aussie. We have a double top here at resistance. As price comes up here, we have a big candle, a smaller candle, an even smaller candle, a red dogee candle rejecting resistance, an inside bar, and then a reversal. So, some traders might have noticed this level of resistance here. But look at what happens when price comes to this area.
We have an engulfing candle and price broke right through and there was no price action for a trade. Here along the bottom we have a level of support here through this rejection. Now again as price approaches this level look at all the small candles as price approaches this level which shows no bearish momentum. Price then finishes with three candles where the wicks are rejecting support and then price took off upwards.
The words are the caption track's own and nothing is reworded or re-transcribed. Paragraph breaks are placed between sentences so the text reads as prose.
Use this transcript
Three free tools that work on the material around a video like this one. No signup, no login.
Hook Analyzer
Paste the first 30 seconds of your own draft for a hook score and rewrites.
Policy Pre-Flight
Check your draft against YouTube's advertiser-friendly guidelines before you record it.
Channel Skill Generator
Read this channel's public videos and transcripts, and download a writing brief for it.