Getting the transcript
Reading the captions from YouTube. A video nobody has opened here before takes 10 to 30 seconds; this page fills in on its own.
Reading the captions from YouTube. A video nobody has opened here before takes 10 to 30 seconds; this page fills in on its own.
MegaWhale Crypto · @MegaWhaleCrypto
Words
4,004
Runtime
22:22
Speaking pace
179wpm
Reading time
17min
179 words per minute, just under the 181 median of 349 measured videos. That distribution comes from the 349-video hook study.
Opening (first 30 seconds)
Good day, legends, and welcome back to another video. I hope you're all having an absolutely amazing day. Today, in today's analysis, we are taking a look at the short-term rally, discussing how the price action is developing since the breakout of 81.5 and rally into the high 80,000 region. Will this rally fall apart? Are we going to see another push higher? and what will that look like? We're also going to be taking a look at the macro charts, discussing the key 62.09 and what it tells us
90 words, the words spoken in the first 30 seconds at 179 words per minute.
Free, no signup. See how the first 30 seconds hold attention, with rewrites.
Sentence shape
| Measure | This transcript |
|---|---|
| Sentences | 259 |
| Average words per sentence | 15.5 |
| Longest sentence | 108 words |
| Questions asked | 12 |
| Sentences containing a number |
What this transcript is
Every word below is the caption track YouTube publishes for this video, pulled from the video itself and reproduced unchanged. It is not Prepublish's writing, not a summary, and not a re-transcription: it is the video's own published captions. English captions, generated automatically by YouTube, in the video’s original language. Source: the video on YouTube. A channel that would rather this page did not exist can ask for its removal through the contact page, and it is removed.
Good day, legends, and welcome back to another video. I hope you're all having an absolutely amazing day. Today, in today's analysis, we are taking a look at the short-term rally, discussing how the price action is developing since the breakout of 81.5 and rally into the high 80,000 region. Will this rally fall apart? Are we going to see another push higher? and what will that look like? We're also going to be taking a look at the macro charts, discussing the key 62.09 and what it tells us about the future of Bitcoin's price action.
And we're going to be analyzing in comparison to the prior signals. And very importantly, we are going to be taking a look at the monthly Ichimoku cloud baseline which is acting as a current point of resistance and historically when broken has triggered a macro continuation higher. And alongside all of that, we of course will be going over the daily and the weekly charts as well. Before we jump into it, make sure to smash that like button, hit that comment button, and subscribe to the channel.
We post daily videos for Bitcoin focusing on the facts, the data, the technical, and the structural information. Absolutely no hype, no BS, no emotion, just pure raw TA. And if that is the kind of content you guys are interested in, join our free channel. The first link down below. Again, absolutely nothing to sell you. Entirely free updates, analysis, charts, educational posts, news, events, no strings attached. Join below the first link.
Check it out. Let's jump on in. So, thank you everyone for jumping into the video. And again, I am still quite sick. You may be able to hear it. I am feeling much better, but you know, we'll have to hang through the slightly raspy voice for another few days. Let's jump into it. We have seen a little bit of a pullback for Bitcoin over the last 24 hours. Of course, we discussed in yesterday's analysis the key short-term levels we are watching for rejections to and for potential bounces to develop from.
The first one was around that $85,000 region. The next one was of course our sellside liquidity which was around sorry 85.58,000 and the next one was at 85 to around 84.9K region. We have managed to hold above this sellside liquidity and that is going to be our critical point of short-term support. Provided we can hold above this level, we do avoid the risk of this rally falling apart. If we drop below this level of support, this rally will likely drop all the way back into that $82,000 region, essentially retesting the breakout point of that 4W week long consolidation point.
Provided we are able to avoid that short-term breakdown, there is a chance Bitcoin will be pushing up into the next point of macro resistance, which was around 89 to 90,000. We'll discuss that more in just a moment. But when we're looking at the breakout of this range, we did show you a few days ago our upside target on the initial breakout of course was going to be around 87.4 as per the measured move. You can see here that vertical line was our measured move.
And we can see we got that from applying the depth of the channel to the breakout point, dragging that upwards from the breakout point, giving us that target which was hit absolutely perfectly. So, we know already that the initial breakout from this consolidation has reached this target. So, we're in a position now where we're waiting to see whether or not the sellers have actually got the strength to push the price back through these supports and back down or if the buyers are going to continue to absorb that selling facilitating another leg toward the upside.
And that's really where we're sitting at the moment for the short term. In terms of the higher time frame charts, there is a lot to discuss. Like we said, from the monthly Ichimoka cloud baseline retest, from the 62.09 on the weekly RSI, and of course the weekly breakout, the lower high with 5 days remaining. There's a lot to dissect, so we'll jump into that in our analysis. But let's take a look at the market data. 24-hour volume down 22%, billion.
Liquidations, 296 million, down 72%. Looking at the 24-hour liquidation data, pretty evenly split here between both longs and shorts. Moving over to the S&P 500 and the DXY, the DXY retesting the 200 EMA on the weekly. Watching that closely as a rejection point if we are able to break through that 200 EMA. Expect the DXY to potentially push back upwards. And this actually could put some downward pressure on the risk asset market.
The S&P 500 currently challenging the most recent all-time high around 7,820 to 7,840. If we are able to break through this region, we are anticipating a rally into this uptrending dynamic resistance where we then expect to see proper rejections develop from. And of course, if we are unable to break through this region, we do run the risk of printing a short-term double top. So, watch out for both of those formations.
Let's go ahead and jump into Bitcoin. Now, before we do get into it, guys, make sure to go ahead and sign up to BitGet, Bit Unix, BingX, the exchange links down below. You'll get yourself a lifetime trading video scout, 15% off all your trading fees. You'll support me making the content on a daily basis, and you'll support yourself trading on exchanges I personally use and I personally trust, including access to your Bit Unix.
You'll get access to our monthly campaigns and promotions where you can win thousands of dollars every single month. We have these going every single month for you guys only on Bit Unix. Check it out. We'll play it out and we'll see you back in a second. Legends, I wanted to jump in and take a quick moment to show appreciation to the exchange that supports this channel, Bit Unix. If you like the content I make for you guys on a daily basis and you want to support the content, trading where I trade and of course supporting the content, keeping it available, keeping it going, keeping it free, this is the best way to do it.
You can see I personally use Bit Unix having traded over 215 million in trading volume over the past 30 days being that of VIP level 7. You can see right over here. Ben Unix is of course a global access exchange. There are some countries that are restricted. It is up to you to review which countries are restricted from your region. And of course, if you are restricted, you will not be able to access the exchange. You'll get access to a plethora of bonuses from Trading Feed discounts and of course monthly campaigns by using the link below.
And this offer is not available to Australian users. Thank you for listening. Let's jump back in, guys. Thank you very much. I do appreciate everyone who uses the exchange link down below 2B Unix specifically. You'll get yourself access to all those bonuses and it does support the content. So, thank you. Let's go ahead and jump into it. So, I want to start by taking a look at the monthly chart today and then slowly and gradually build it down to the short term.
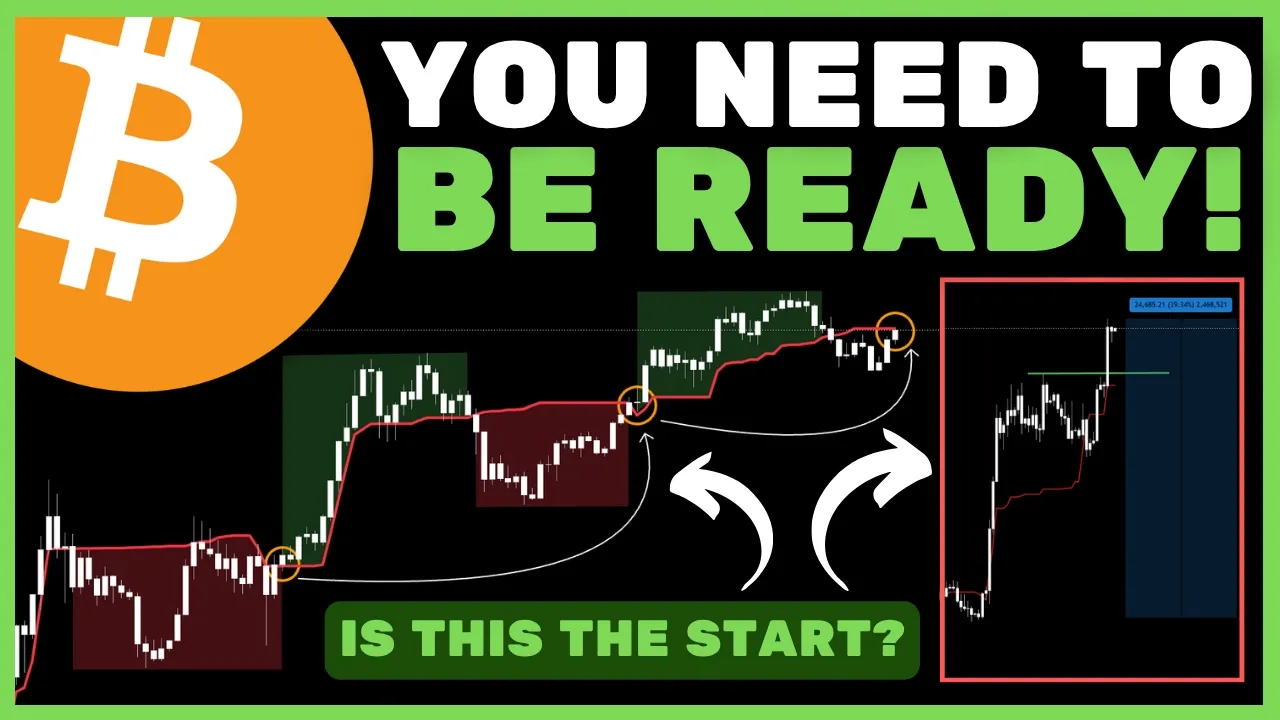
The monthly chart is very interesting. The one thing we are watching here on the monthly chart is going to be the Ichumoku cloud baseline, the red line, and this is the Ichimoku cloud indicator. All we've done simply is we've just gone ahead and deselected everything on this chart except of course the baseline. So if you're wondering why Ichimoko cloud indicator looks just like this, that is why. What we can see historically and the Ichimoku cloud baseline on the monthly chart has been a fantastic tool to really differentiate the the differences between our macro uptrends and our macro downtrends, but more so the bull market and bare market favors.
And yes, it hasn't been an indicator to predict tops and bottoms. That's not really the purpose. But it has been a good indicator to project when do we generally start to see these multimonth upward moves develop from and when do we generally start to see these multimonth downward moves develop from. So what we're going to do is we're going to take a vertical line. We got a green line. We're going to actually draw the green line on every single time we broken above and closed a month above the monthly Ichimoku cloud baseline.
And what we're going to do next is we're going to take a green line, a red line, sorry. And the red line is going to be when we have closed below the monthly Ichimoku cloud baseline. And what you're going to notice is a very clear, very clear pattern. And that is from the breakout of the green line. So from the green line to the red line, we are in a overall uptrend. Okay? And from the red line to the green line, we have, of course, our bare market within that phase.
Now, like I said already, this isn't going to predict the exact tops and bottoms. That's not the purpose of this indicator. So, we can see already that during the distance from the red line to the green line, we have a long period of uptrends on the short term. We have a long period of uptrend on the short term, a long period of the uptrend on the short term. And even during the distance from the uh green line to the red line, we do actually sometimes print these tops which happen within the range.
And again, this is not a error of what I'm trying to show you. This is besides the point. The point is to show you that when we're looking at the baseline from the trigger points, it shows us that these key levels or these key points, these vertical lines represent key pivot points in the macro direction, not exact reversal points for the macro trend, but pivot points for the macro direction of which we generally see sustain for multiple months going forward.
So when we're looking at of course the red line we saw what was this multiple multiple months of downward price action from that point to the bottom we saw around 11 months of downward price action. From the green vertical line upwards we saw around 19 months of upward price action. From the red to the down we saw around 9 months of downward price action. From the green to the top 18 months etc etc. So you can see multiple multiple sometimes even 10 15 months of upward price action and 10 months of downward price action from the breakout of this level.
And the reason this is significant is because not only are we actually seeing yet again the retest of that baseline. The reason this is very significant is because when we look at how the price responds above and below, the baseline has historically acted as a significant level of support during these macro uptrend phases. And if you look at particularly this phase here, okay, we're just going to take a red box and this phase over here.
Even if we take a look at the most recent one, which was this phase here, you can see tracking that red line, just taking a orange line here and tracking it, that acted as a monthly support the entire way until we broke back below and entered that bare market, right? It tracked as a monthly support for a very, very long time. So when we break a monthly close above the baseline, historically we have actually maintained above it.
Not only have we maintained above it, we have held above it for sometimes 10, 15, 20 months, facilitating a much larger macro uptrend. Now here comes the grim reality. The grim reality is we have also seen instances of rejections and instances of bounces from this baseline. We can take very notable instances such as this over here, such as this over here. Okay? Such as this over here, this over here. That's four ones we've just drawn out. very notable, very clear instances where we have either bounced aggressively from or rejected aggressively from the baseline and therefore this has to be considered a key point of resistance that we are watching moving into the monthly candle close.
Closing a monthly candle above the baseline will very likely put us based on historical data, right? This is based on historical data in one of these macro uptrends again with the baseline and the monthly being a trigger for a further continuation down if lost. And if we do not close a month above the monthly baseline, we then fall back to those weekly levels of validation we'll be discussing in a second. So very interesting levels to watch.
Incredibly important chart for the monthly. And of course the cloud indicator has always been one of those fantastic tools on the week on the macro time frames and above. So taking a look now at of course the weekly chart. There are some very key levels we are watching and one of the most important levels we are watching has been discussed already which is the 62.09 on the RSI. And what I want to show you is the 62.09 on the RSI represented by the breakouts of these green lines.
And for those of you who have not paid attention, haven't watched the videos or haven't or if you're just new to the channel, you're probably wondering what the hell is the 62.09 in the RSI. Well, the 62.09 09 on the RSI is a historically significant level when broken in prior bare markets and bull markets have resulted in significant moves either upward or downward. Okay, we can map that out. We've shown you historically many instances and I'm going to show you again here.
But when we're referring it to the end of the bare market, it also has a very obvious and very profound um correlation to essentially the bare market ending and the bull run starting. And that is what we have seen after creating macro tops. We remain underneath the 62.09 the entire bare market until when we finally break above the 62.09 09 for the first time we enter a macro uptrend. We have seen that play out time and time again.
We remain underneath the 62.09 the entire bare market. Only upon breaking above it for the first time do we then properly enter these macro uptrends for Bitcoin. So it has acted as what you would consider to be a bull market trigger point. Breaking above the 62.09 has historically resulted in strong macro uptrends. And today what we want to talk about in relation to this is I guess the spacing between the breakouts and then comparing it to this current instance.
If we're taking a look at the prior macro tops for Bitcoin, okay, and then we're looking at the prior breakout. So 62.09. Let's just get an average. We saw around 99 bars, which is 99 weeks from the top to the breakout. In this instance, we saw around about 73 weeks. And in this instance, we saw around about 71 weeks. So we've seen around 90, let's say 100 to 70 weeks on average between the exact top and the moment the next bull market has started.
So quite some time. We're looking at a year and a half in some instances, a bit over a year in most instances. What we are seeing currently is the weekly chart with just 5 days remaining is yet again challenging the 62.09 for the first time. Since we broke below it right over here and created the macro top, we have been underneath it the entire time. Based on historical averages, we could expect 70. Okay, let's just take it over here.
[clears throat] 70 to 100 being the expected time horizon for the next breakout. If we were to look at averages and what we've seen historically, somewhere in this region between February 2027 and September 2027 for the breakout of the 62.0 9. What we are actually seeing which is incredibly interesting is we are seeing a potential breakout with 5 days to confirm it 50 bars. So under a year from the prior autom and this if this does trigger this would tell us it is not only the earliest and quickest this signal has triggered but it might also constitute us having the shortest bare mark we have ever seen for Bitcoin in the last 14 years. well and truly in validating the four-year cycle if this plays out.
So, something to consider. Uh very interesting bit of data. Of course, we do have 5 days remaining for that to validate. Let's quickly jump over to the weekly chart. So, on this chart, of course, we've talked a lot about and I think you've heard everyone now talk about the lower high and why the lower high is important. And we're breaking above the lower high. I'm not going to go into it too much today. I'm sure everyone already knows about it.
All I'm going to say is that it isn't confirmed. We do have 5 days remaining. So 5 days remaining until the weekly candle close. Uh pay attention to that how it develops. 5 days remaining. If we do close above here, the next target of course is going to be that 90 to around $98,000 region. If we do validate the breakdown, we could see a further correction. I will also show you one instance of where we saw a breakout.
This was back over here in March, well sorry, July 2015. We actually did have a lower high breakout as you can see followed by a quick rapid correction toward the downside. So maybe we've seen something like that. Who knows? It's possible. I don't like to, you know, play on these hypotheticals too much, but we've seen it happen before. It may happen again. Again, everything comes back to the short term. The short term drives the market.
And that is why I've been talking for the last few weeks and the last month or so particularly essentially ever since we were in this consolidation play it range by range. I've been saying level by level I've said very clearly lose six um everyone's going to remember lose 61.5 only then we go lower break 67 we're going to see a strong move up then we entered into this consolidation range I said we're in a neutral range play level by level only upon the loss of 75.5 will we expect a correction but break 81.5 expect a continuation up and we've given you those targets along the way and we've played it perfectly even though we're still aware aware of the macro context and we're still aware of the potential for the 4year cycle to play out.
We're still trading and making our decisions on a levelby level basis, which is very critical. When you're in periods of consolidation and indecision, when there's conflicting data, when you're not entirely sure, zoom in when you're not sure, don't zoom out. Zoom in and let that guide your decision-making process rather than being, I don't know what the hell is happening, so I'm going to zoom out and just get more confused.
No, zoom in. Zoom in. Take a look at the short term. Take a look at what is happening right now and then just build your decision- making process off that. Make your decisions. If they start playing out well, compound those, let those run longer. Turn those short-term positions into longer time frame swings if you so see fit. Nevertheless, let's jump into the short term here. So, the 4hour, like I said, it has broken upwards.
It has reached our target of 87.4. Um, we talked in yesterday's analysis for the potential for a continuation into the next resistance. Let's go ahead and you can see the next resistance by this red box over here. Okay, 89 to 90,000. We talked about that as a potential. That potential is still holding true. So, it's still standing as a possibility. Uh, we talked in yesterday's video, we had this triple divergence, this rejection.
We expected initial corrections. We were looking for targets of 86. We saw that ticked off. We were looking for then corrections into around 85. We came very close to that. Not quite hit it, but we came very, very close. We have since bounced from that region, pushing sideways, absorbing a lot of that selling pressure. And it does appear like it is trying to have another swing toward the upside. Again, if you're looking at what we need to see for corrections to take place, if you want to see the market drop, if you want to see a correction back to 82,000, um, you need to lose.
We need to lose 84.5. We need to lose 85,000. this sellside liquidity point, this level of support, this red box, we have to drop below it. If we drop below it, then we're going to see that stronger pullback. Until then, the buyers are going to keep coming in. They're going to try to absorb the selling and they're going to attempt to push the price into this another swing upwards into this next resistance where we then again run the risk of corrections or continuations, etc., etc.
So, let's talk about implications. Okay, implications. Implications of the loss of support. We lose the support, we drop back down to 82. What implications does that have? Number one, which is the big implication, we then run the risk of failing to close this candle above the high. And then, of course, everything looks grim again. You know, everyone's going to be bearish again, and then we run the risk of correcting, right?
Because we fail to close here. We have this massive deviation toward the upside. We print a a massive wick toward the upside with a close nice and low, basically a gravestone dogey candle of some sort. And then that is going to flip the sentiment. It is going to shift the tone. It's going to facilitate a potential further pullback. So if you want to see the bearish case really activate, the first domino is this. Okay, this needs to break and then we're looking at 82,000.
The weekly close under resistance failing to print the lower high would facilitate further continuations. Alongside that, we would have the failure of the 62.09 breakout and we would have the failure on the monthly breakout of the baseline of the Ichimo cloud. So, a few things would stack on top of each other there. That's the bearish scenario. The bullish scenario is that if we do start making these moves up into the highs here, all it does is it diminishes that 5-day clock.
Right? We have 5 days into the close, meaning we'll probably go about 3 days or even 2 days and Bitcoin will be higher, decreasing the probability that we are going to be dropping back below. Okay? Increasing the likelihood that we are going to see those continuations. And that is really what it comes down to, probabilities and timing. Thank you so much for tuning in. Have a fantastic day, guys. I'll catch you all in the next analysis tomorrow.
I'll see you all then. Cheers.
The words are the caption track's own and nothing is reworded or re-transcribed. Paragraph breaks are placed between sentences so the text reads as prose.
Free tools for your own script. No signup, no login.
Paste your draft and see where viewers are likely to drop off, with a rewrite for each weak line.
Paste the first 30 seconds of your own draft for a hook score and rewrites.
Check your draft against YouTube's advertiser-friendly guidelines before you record it.
Read this channel's public videos and transcripts, and download a writing brief for it.
| 62 |
Most used terms
Filler phrases
35 in total: like 10 · actually 8 · right? 4 · uh 4 · um 4 · you know 3 · basically 1 · kind of 1.
A literal whole-word count of the same phrase list the Prepublish browser extension uses, so a phrase inside another word is not counted and a phrase used in its ordinary sense still is. It is a count and not a judgement.