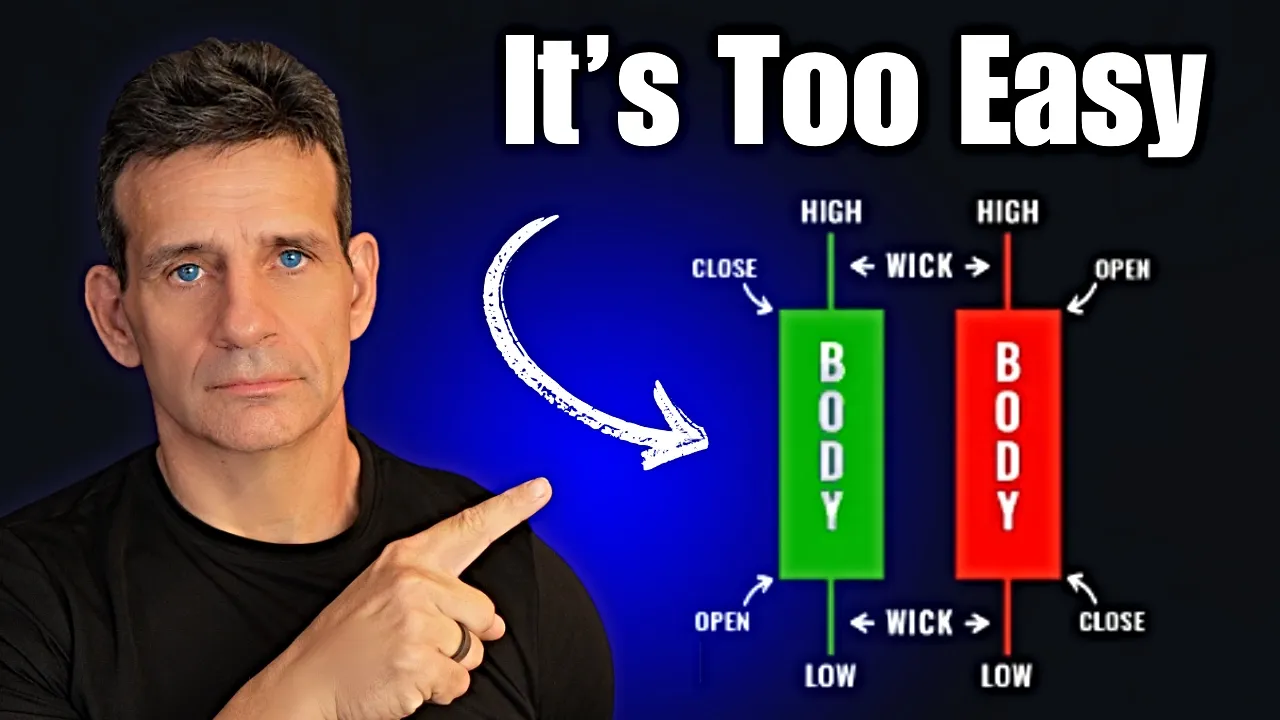
What Nobody Understands About Candlesticks — Until It’s Too Late transcript
The Rumers · @the.rumers
Words
4,281
Runtime
22:44
Speaking pace
188wpm
Reading time
18min
188 words per minute, between the 181 median and the 201 75th percentile of 349 measured videos. That distribution comes from the 349-video hook study.
Opening (first 30 seconds)
Hello, my name is Doug and I've been a professional trader now for 26 years. And in today's video, I am going to tell you what nobody understands about candlesticks until it's too late. Because if you ever want to have a fair shot at hitting the big time as a trader, you got to know your candlesticks. And if you don't know your candlesticks, it won't be long before you're gone. You see, the thing that most traders never understand about candlesticks is that it's not just about price. It's not just about
94 words, the words spoken in the first 30 seconds at 188 words per minute.
Sentence shape
| Measure | This transcript |
|---|---|
| Sentences | 289 |
| Average words per sentence | 14.8 |
| Longest sentence | 97 words |
| Questions asked | 23 |
| Sentences containing a number | 13 |
Most used terms
- candle43
- candles19
- candlestick19
- wick19
- move18
- candlesticks17
- price16
- emotional14
- lot14
- chart13
- top13
- point12
Filler phrases
50 in total: like 22 · kind of 15 · right? 7 · you know 3 · sort of 2 · uh 1.
A literal whole-word count of the same phrase list the Prepublish browser extension uses, so a phrase inside another word is not counted and a phrase used in its ordinary sense still is. It is a count and not a judgement.
What this transcript is
Every word below is the caption track YouTube publishes for this video, pulled from the video itself and reproduced unchanged. It is not Prepublish's writing, not a summary, and not a re-transcription: it is the video's own published captions. English captions, generated automatically by YouTube, in the video’s original language. Source: the video on YouTube. A channel that would rather this page did not exist can ask for its removal through the contact page, and it is removed.
Transcript
Hello, my name is Doug and I've been a professional trader now for 26 years. And in today's video, I am going to tell you what nobody understands about candlesticks until it's too late. Because if you ever want to have a fair shot at hitting the big time as a trader, you got to know your candlesticks. And if you don't know your candlesticks, it won't be long before you're gone. You see, the thing that most traders never understand about candlesticks is that it's not just about price.
It's not just about bulls versus bears or who's in control of the chart. It's all about emotions. more specifically understanding the emotional context that's beneath each candle because once you're able to figure this out, which is pretty simple to do, you now possess an extreme edge in the marketplace. So, if you're tired of guessing, you're tired of chasing, you're tired of, wo wo is me, gee, I don't know if I can do this whole trading thing, I don't know if I'm cut out for it, I need you to stop.
I need you to stop right now and watch this video because today I am going to give you an absolute master class on how to read candles. So, how about we get started with today's video. All right, my friends. Our agenda for today is a very simple yet effective one. We're going to begin with the four pillars that go behind successful candlestick reading and they are the color, the body, the wick, and the range. After that, I'm going to show you how to read the true emotional significance that goes behind each candle.
This is where the secret is because once you have this knowledge, trading is going to make a lot more sense to you. Now, after that, I'm going to share with you my three favorite emotionally charged candlestick patterns that I'm using every day and have been using for the last 20 years. And of course, once we've combined all that knowledge together, I'm going to show you some live trading examples using these candlesticks.
That way, you should be good to go. So let's get started by discussing these four pillars to successful candlestick reading. Beginning with the color of the candlesticks. Green candlesticks tend to represent strength or buyside momentum because the price of the asset had moved higher throughout the selected time period. Red candles tend to represent weakness or sellside momentum because the price of that asset moved lower throughout that selected time period.
Now the rectangular area that you see here on the candlesticks is known as the candlestick body. And each candlestick body has an open and a close. On green candlesticks, the opening price is at the very bottom of that candlestick body. And the closing price is at the very top of that candlestick body. For red candlesticks, the opening price is at the very top of that candlestick body. And then the closing price is at the bottom of that candlestick body.
Now, the lines that you see protruding above and below that candlestick body are known as wicks, tails, or shadows. And for today, we'll be referring to them as wicks. Now, the ends of the wick at the very top of the candlesticks represent the highest price point for that time period. And the wick ends at the very bottom of the candlestick represent the lowest price point for that time period. And the total distance between the very top and bottom of a candle or the bottom to the top of the candle is called the candlesticks range.
Now, let's break down each one of those pillars individually, beginning with the significance of the candlestick's body. And for today's video, we're going to talk about three main types of candlestick bodies. Big bodies, small bodies, and little to no bodies. So, let's go ahead and begin with largebodied candles. The larger the candle body, the stronger the momentum is in that direction. But here's the catch. Normally, these candlesticks are abrupt, fast, and aggressive.
And the impulsive nature of these moves tend to create a splitsecond illusion of certainty like this is the next big move in the market and I have to get in on it now. And many times less experienced or undisiplined traders chase into these moves and the majority of the time that's the wrong move to make. So here's a better way to look at this. Instead of viewing candlesticks in just terms of price alone, look at them as people or trader type.
So the next time you see an impulsive candle upward or downward, instead of asking yourself what's causing this move, what's creating this move, ask yourself, what kind of trader would be buying or selling this candle right here and right now? Because once you're able to look beyond price alone and understand truly who's behind this move, it's going to be a lot easier for you to predict what the future movement of that asset is going to be.
Now, let me break this down for you in layman's term by showing you this chart real quick. Take for example this massive green candle right here. Any disciplined trader who relies on technical analysis would not be buying at the top of this move. And the reason is because there is no valid technical analysis pattern in the technical analysis universe that has a signal entry that is that high. Which means anyone who is still buying at that level is likely an amateur or reacting via emotionally chasing FOMO instead of following a strict set of rules.
That's why these large candles tend to fail more often than not. The bigger the body is, the higher the emotional intensity is and the less sustainable that move will become. Now, the same logic applies in reverse. On large red candles like this, any disciplined trader who's relying on technical analysis would not be selling into the panic this deep. So, anyone who's chasing into sellside momentum that deep is driven by fear, not by logic.
And just like emotional buying, emotional selling often leads to sharp reversals. Remember, emotion is the abandonment of intellect. And that is exactly what separates the winners from the losers. Now the smallerbodied candles to the no-bodied candles which are called dogeis to most traders they represent indecision. But to me they represent opportunity because when I see them I'm thinking percolating you brewing. It's just coiling up and it's just getting ready to explode either up or down.
And I want to do my best to read in between those lines and truly understand those candlesticks so I can kind of frontr run that move because again that's where the money is made. Now, this is pretty simple to do, and let me show you exactly what I'm talking about right here on a chart. Notice all the small consolidated candles and the little tiny dogeis. Now, to a lot of traders, that's going to look like wasteful consolidation, but to me, I see it as it's setting up for the next big move.
Now, in this case, that move happened to be higher. But here's what I want you to know. On this chart right now, there are two pieces of strong candlestick data that clearly told you that the move was going to be up and it was about ready to happen. And in just a few moments when I go over my favorite candlestick chart patterns, I'm going to show you exactly what those two pieces of strong data are. And finally, the most important part of every candlestick are the wicks.
There is nothing that will signify an abrupt change of sentiment or a trend shift or a directional change easier, faster, and better than wicks. There's just nothing like it. And let me show you exactly what I'm talking about right here on the charts. Now, take a look at this chart and notice the size of this wick from the very low price point to the closing price point of that candle. That's almost 90% of price retracement.
Now the significance of that candle is not just about buying. It's the large aggressive and authoritative buying that matters that gives the trader the confidence. And when you get that much aggressive buying, the end result is most likely going to be higher prices. Now on this chart as well, there's a little tiny secret. It's right there in front of you. And I want you to tell me if you can see it. It's okay if you don't.
I'm going to tell you here in a second. And just think about it here real quickly. Pause the video if you need, but I'm going to go ahead and tell you. Notice that right before that wick, just right before that, what is it that you see? Is that not a largebodied candle, which means what? Emotional intensity. And what have we learned up to this point about emotional moves? They normally do not stick. So long before that wick ever printed and took a place, you would have known ahead of time that that was most likely to appear on that chart.
And right there is a significant edge. Now, here's what this move would look like in reverse. Notice in this case, you had two backto back top wicks with strong retracements. Now, what do you think happened after these strong retracements? The asset went lower. Note that also in this case the down move occurred after what? After the emotional impulsive candle up. Simple. Right now in this section I want to talk about my three favorite candlestick chart patterns.
And by this time you probably got a pretty good understanding of why they're my three favorite and I hope they become your three favorite as well. But if not I want you to pay attention to one thing as we go through here or keep this in the forefront of your mind. It's the significance and what these patterns represent. It's the context that they represent. This is what makes all the difference. And what I have here on the screen is what I feel are the three most emotionally charged candlesticks.
Starting with the inverted hammer and hammer candles. And we're going to go through each one of these individually here in just a second. Now, as some of you know, I've done a video about these particular candles before, and I'll call them the John Wick. So, if you hear me say the word John Wick, this is what I'm talking about. The next is the engulfing candles, also known as the power of tower candles. And the third, which I have not talked about yet here on this channel, is the rising wick and the fading wick.
And we're going to go through each one of these and with real live trading examples to back them up. And let's start with the John Wick. So I want to show you exactly what a John Wick feels, looks, and smells like in a real live market. And these were real trades that we took in our trading community. But the most important part of this segment is I want you to understand the context that goes behind this move. Otherwise, it's never going to work for you.
And that's not what I want. And you may recognize this chart because I used it a little bit earlier. But here's what the significance is to the John Wick if you're not familiar. It's the aggressive price change from the very bottom of that candle to the top of that candle. So in layman's term with this one as well, what this meant is at one time this candlestick was a fullbodied red. And not only that, it was coming off the back of another fullbodied red candle.
So think about this at this moment because this is what's really important. At that moment, it looked like this thing was going to implode, right? Like it was just game over. It's just never going to stop. Everyone should sell. That's the point. However, when it hits a specific spot, it immediately retraces. So, think about that. You have people moving in one direction emotionally. Fear, this is a crash. This is going lower.
Then all of a sudden, snap of the finger, it gets picked up and picked up aggressively. Now the point about this candle is normally when you get this much aggression that comes from the wick whether it's at the top of the candle or it's at the bottom of the candle the most important thing is aggression like that doesn't normally dissipate because what you might not understand which is a little tough to for some people even myself to understand the true amount of money that has to go behind a move like that the amount of volume it takes to lift a stock of this nature off the floor is insane.
I don't think any of us could really comprehend how many millions and billions of dollars it takes. And when you have that much intent and that much commitment, it's super hard to get that thing to to come back down. Like there's major buying in there. Not to mention, it was set up before by this candle. Now, let me show you how I would enter this trade. And there's two ways that we can do it. Normally when you have something that's this aggressive where the previous candle was that strong followed by the second if this candle that was once fullbodied red can claw back about 30%.
So not to confuse people that would be about right there about 30 to 50%. That's normally where I would buy. Now, that's a very aggressive entry because you're entering on something where the candle has not closed and there's a lot of data that may maybe the other the next candle is going to go much lower. But that's the way I would do it. However, I'll share with you a much easier, more simplistic entry and that would be crossing through the very high of that candle.
Okay? So, any move for the next candle that presses through, I would buy that. the stop loss would be beneath the low of the day and this is not an exiting class but normally what I look to do is at least get about 50% to 100% of that that range. Now again this is just a example because the most important thing is to understand the candle. Now, at some point it may look like the risk is a little large on this, but the point is that I want you to understand it's that candle significance that allows you to have the confidence you need because the strength of this candle, the the aggression at which it was bought, there's a extremely high probability it goes a lot higher.
So, if I just kind of play this forward, you can see what ultimately happens here is you do get this massive upward momentum move, right? And you'll see all along the way, even if you missed that very initial John Wick, there were a couple of different style of of wicks. Now, they might not be as crisp and clean as this John Wick, [snorts] but there were in fact some other John Wicks into rising support there that makes this a really good trade.
So, understanding the power of the John Wick. Now, if that's at the top, you just flip the chart upside down. And the same thing would be that way via a short. Again, most important part is what? Anytime a large candle gets retraced before it can finish, it really represents the highest level of emotional significance and that's how you make money. Now, the next one is we'll take a look at what a power of tower candle looks like in a real live market.
So, again, just take a quick second to look at the chart here and just tell me what stands out to you the most. It should be the fact that what do we see here? A large red bar, which is what an emotional fear candle. And hopefully some of the light bulbs going off in your head that the next time you start to see these impulsive candles, you ask what who who who would be selling down this, right? Who would it? Rookie, pro, who would be doing it?
Now, when it comes to the power of tower on a very strong, huge, robust candle like this, it it might be too late. It is too late in a lot of cases to wait to the very top of this candlestick to engage in a long. For this one, I do use that 30 to 50% rule. If it can somehow retrace 30% from the bottom, 50% up there, it's fine. Now, one note, it doesn't have to happen perfectly to script with these candles. I think most of you know that they can be separated depending on your chart frame.
They can be separated by a few different candles. I'll show you what that looks like in a minute. So, it can happen in a sum of one candle, two candles, or or even three. But, let's kind of put a 50% threshold on this candle. Now, hopefully you also can kind of put, you know, kind of connect the dots here and say, I don't have to take this trade. Maybe you understand that anatomy like I'm thinking I don't have to take this trade but just so happens if the next candle bounces up this far or the next two count candles bounce up that far that's the entry that I'm looking for.
So I'm just going to kind of play it forward here real quick and as soon as you get somewhere up there right the next candle comes up right hits that point. So in this case that would be very close to what my entry is. So I would just buy it here using the same formula with a stop at the low targeting back to the range at least bare minimum. Now a lot of these can go further. Again it's not an exiting class or an entry class.
I just want you to get the concept of what we're looking at in terms of context. And of course we play this one forward. You you'll move up a lot higher. And then there's another really strong strong trade. Now let me show you what that looks for. Because if you play this one I remember this trade specifically. If you play this forward, you're going to see you got the same setup two different occasions because later in the day, this rolls over real strong right there.
Now, let me just kind of back that up real quick here. Showing you again the power of tower. In this case, this was sort of like a a mix between the John Wick, a mix between the power of tower. In these cases, this is almost it's close to a John Wick, but because it has the tail at the very top. You could say that's a dogey candle, but I don't look at it that way. In these cases, you're just looking for the next series of bars to cross that 30 to 50% threshold.
So, if I just kind of draw that line, the entry could have been on the push through this candle right here. Okay? Hopefully, you can see that. Now, there's other advanced entries a little bit lower, but what I'm trying to say here without getting off topic or confusing everyone is that once that candle has dropped, you just need 30 to 50% of it. Whether it comes from the next candle, the candle after that or the third candle, it's still valid.
And many of our technical signals are that way. There there's noise in between and the smaller the charts are, the worse it gets. And notice what happens. What does it do? it comes back up to the very top part of the range. And that's the key. Now, the next one I want to show you is the rising support wicks or the fading support wicks. And we're going to look at the rising support way because this was a recent trade.
Again, what is the anatomy of this? I did a video once and kind of bring it up because I think it's really important right now. A lot of the answer to what's going to happen next is in the series of candles that happened before it. What are we seeing here? Another downtrending instrument. Even though it's not as aggressive as the previous one with these very strong, thick, singular, robust candles, there's a series of candlesticks moving down.
This is the point. It's moving the emotional intended in a certain direction. That's the key. That's how technicals work. It's it's it's it's determining who's on that trade. It's shaking people out. And you're looking over here. You don't completely get it. You get a tiny tiny little power of tower style. But what is important about the rising pattern is that's the key. It's rising support. So notice the tail of each one of these wicks.
If I just kind of draw a little trend line, notice how they're they're kind of trailing up, kind of like grinding up, kind of walking up and rising support. You're using the same formula in a trade like this where you're buying on the break of any candle structure which would just be right there. It's very very tiny. Let me write that line. Put it right there. Right? And you could even in this case wait. But notice that would be your a standard wedge pattern.
Right? Stop loss always goes below the low of the day or the high of the day. Target price moving back into the upper range bare minimum. Again, we're not doing a class on that right now. The key here is those rising wicks. I want to open that up because notice that every time you get inside there, there's somebody scooping that up like an algo rhythm. So, the emotional significance here is there's building, right? That's building pressure.
It's coiling. There's some sort of algo just kind of nibbling and nibbling on chairs. And all it needs is a break of this upper range and it's off to the races. And you'll see in this case that's exactly what happened, right? Off to the races it goes and just starts shooting all the way up. Now, a lot of people will ask, "What about the losers? You're showing me all the winners." Look, I get it here. But what I want you to understand this is each and every one of you, and I hope you saw this throughout the presentation part.
The key with this type of theory is that when you're down that far with stops at low and high after big moves, your stops are so small. That's the point. They're little compared to the gains. Notice that each and every one of these have produced more than a 3:1 riskreward. While 99% of traders are out there chasing one to ones or one to twos, these are threes, fours, five. You don't have to win a lot when you're when you're getting gains like that.
So yes, there are losses and there are quite a bit of losses, but in most cases, you're winning because you're coming after the emotional. You're understanding the emotional context between it. So your ratio of winning is high, but the ones that you do lose on, well, they're a lot smaller. So anyway, guys, I hope some of this made some sense to you. I really enjoyed doing this video. It's one of my favorite subjects to talk about.
I want to say just a few things before we log off here. Uh, as always, my wife and I who run this channel, who she trades as well, we put together a free watch list. It includes all the great technical setups for the week ahead. It's called the gains guide. It's completely free and I've put a link down there in the description box. I also wanted to inform everybody, which a lot of you do know by now. We finally got around to starting our live trading community.
It's been a lot of fun doing this. I love trading live in front of everybody every day. It's called the Rumor Squad. I'm also going to put that link down there. So, if you're interested in trying to get a little bit more education, a hands-on experience, trying to get better knowledge, trying to finally get out of the the hamster wheel of existence, go ahead, click those links, join us in our live community. Love to have you narrating through each and every one.
I'd love to narrate through each and every one of these scenarios with you on a day-to-day basis. Be my pleasure. So, I look forward to seeing you there. On that note, guys, let me say thank you very much for watching this video. Thanks for your support. Until the next one, take care. Trade well and cheers.
The words are the caption track's own and nothing is reworded or re-transcribed. Paragraph breaks are placed between sentences so the text reads as prose.
Use this transcript
Three free tools that work on the material around a video like this one. No signup, no login.
Hook Analyzer
Paste the first 30 seconds of your own draft for a hook score and rewrites.
Policy Pre-Flight
Check your draft against YouTube's advertiser-friendly guidelines before you record it.
Channel Skill Generator
Read this channel's public videos and transcripts, and download a writing brief for it.