Getting the transcript
Reading the captions from YouTube. A video nobody has opened here before takes 10 to 30 seconds; this page fills in on its own.
Getting the transcript
Reading the captions from YouTube. A video nobody has opened here before takes 10 to 30 seconds; this page fills in on its own.
Zach Star · @zachstar
Where viewers went back to watch this video again, from YouTube's public Most replayed graph, lined up with what was said at that moment.
Most replayed moment #1
5:092.1x the video's typical replay level
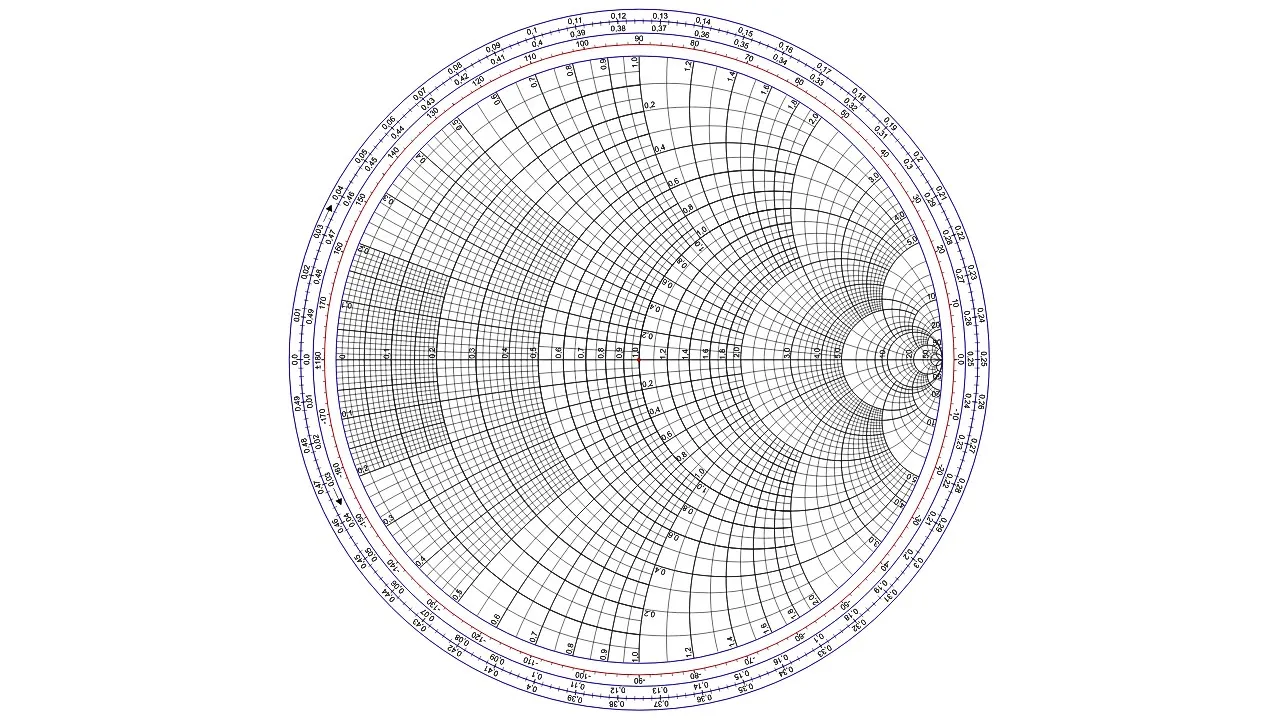
circles is going to tell us how much of our wave will reflect back from the antenna and that's found by looking at the distance that point is from the center of the Smith chart taking the
Said at 5:03
Most replayed moment #2
4:421.8x the video's typical replay level
that value out here along the perimeter of the Smith chart in our case positive one can be found right here the top is all positive values AKA inductive if the value was negative one then we find that on the bottom half of
Said at 4:36
Most replayed moment #3
4:091.7x the video's typical replay level
anyway step one with the Smith chart is to take your load impedance and divide it by the transmission line impedance then you take the real part of that and find that value on the horizontal axis
Said at 4:04
The graph counts replays. It does not show where viewers stopped watching.
Words
1,388
Runtime
9:02
Speaking pace
154wpm
Reading time
6min
154 words per minute, below the 160 25th percentile of 349 measured videos. That distribution comes from the 349-video hook study.
Opening (first 30 seconds)
this video is sponsored by brilliant I present to you the Smith chart ooh scary but it's actually not that bad so what is this why do we use it here's the story when dealing with low frequency signals in a cable like the 50 or 60 hertz signals that come from our wall outlets or even audio signals that go up to 20 kilohertz which is the maximum frequency humans can hear the associated wavelengths are
77 words, the words spoken in the first 30 seconds at 154 words per minute.
Free, no signup. See how the first 30 seconds hold attention, with rewrites.
Sentence shape
| Measure | This transcript |
|---|---|
| Sentences | 2 |
| Average words per sentence | 694.0 |
| Longest sentence | 991 words |
| Questions asked | 0 |
| Sentences containing a number | 2 |
Most used terms
Filler phrases
11 in total: like 8 · actually 2 · kind of 1.
A literal whole-word count of the same phrase list the Prepublish browser extension uses, so a phrase inside another word is not counted and a phrase used in its ordinary sense still is. It is a count and not a judgement.
What this transcript is
Every word below is the caption track YouTube publishes for this video, pulled from the video itself and reproduced unchanged. It is not Prepublish's writing, not a summary, and not a re-transcription: it is the video's own published captions. English captions, generated automatically by YouTube, in the video’s original language. Source: the video on YouTube. A channel that would rather this page did not exist can ask for its removal through the contact page, and it is removed.
this video is sponsored by brilliant I present to you the Smith chart ooh scary but it's actually not that bad so what is this why do we use it here's the story when dealing with low frequency signals in a cable like the 50 or 60 hertz signals that come from our wall outlets or even audio signals that go up to 20 kilohertz which is the maximum frequency humans can hear the associated wavelengths are very long if a signal travels at the speed of light through a cable even at 20 kilohertz the wavelength comes out to 15 000 meters and that is most likely much longer than the cable it is going through but bump that frequency up to 100 million Hertz the frequency of radio waves and you get three meters and this is much more comparable maybe even shorter than the cable it will be traveling through and when that happens you're gonna get Reflections within the cable just like if I take a rope and pulse it very slowly the rope moves in a very predictable way because the actual wavelength is so much longer than the Rope itself but pulse that rope faster where the wavelength is comparable or shorter than the Rope and then you're going to get Reflections and things get more complicated so in the circuit world you might have some high frequency input maybe for radio Television Satellite Communications and so on which goes through something called a transmission line just a specialized cable often used for these high frequency signals until that signal gets to some load maybe an antenna to be transmitted now that transmission line is going to have some Associated impedance to it 50 ohms is often what is used so really just a resistance and this is a fundamental property of the cable determined by material properties and physical dimensions and then the antenna is also going to have an Associated impedance likely both a real and imaginary component meaning it has some resistance and some capacitance or inductance capacitance and inductance are represented with an imaginary number and EES use j instead of I because I is used for current okay so what we have here is kind of like a rope attached to a bigger rope both free to quote move or change voltage and current but they have different properties so what would happen if we pulse that we'd send a wave down the first rope and it goes until it would hit that Junction then at that point some of the Waves energy will be reflected back while some will transmit through to the antenna you can see that visually here we got smaller rope attached to bigger rope transmission line attached to antenna send a wave down once it hits the Junction in the middle boom some energy goes through while some is reflected back we typically don't like those Reflections we want as much of the Signal's power as possible to get to the antenna so it can be transmitted and that's where the Smith chart comes in this tells us the parameters we need to know like how much voltage gets reflected versus how much is transmitted so here's a quick example with the numbers shown here the first thing to note is as chaotic as this looks you're really just looking at a bunch of circles you got these ones that are fully inside the Smith chart that have to do with resistance which we'll see in a sec then these curves are also just circles well the portion of them inside the Smith chart and they have to do with reactants the capacitive or inductive part of the load represented by an imaginary value anyway step one with the Smith chart is to take your load impedance and divide it by the transmission line impedance then you take the real part of that and find that value on the horizontal axis hard to read but 0.5 is right here which is on this circle which we're going to highlight again these circles are all of constant normalized resistance that all correspond to the real component then for the imaginary part you find that value out here along the perimeter of the Smith chart in our case positive one can be found right here the top is all positive values AKA inductive if the value was negative one then we find that on the bottom half of the Smith chart we'll then highlight that Associated circle of constant reactants again those are always for the imaginary component then the intersection point of those two circles is going to tell us how much of our wave will reflect back from the antenna and that's found by looking at the distance that point is from the center of the Smith chart taking the very Outer Circle to be the unit circle distance of one away so in this case and you'll typically have a little scale below your Smith chart that distance away is just about 0.62 meaning the ratio of the reflected wave voltage to the incoming or incident wave voltage is 0.62 so if the incoming wave had an amplitude of 10 the reflected wave will have an amplitude of 6.2 so the smaller that ratio is or the closer this intersection is to the center the better that means less of the wave will get reflected and more will go to the antenna so if now the antenna's impedance was something like 45 plus J10 instead then normalizing that and finding the associated circles we'd find an intersection Point much closer to the origin meaning less reflection and that's because the impedance of our load is now more closely matched to our 50 ohm transmission line the real Parts being 45 versus 50 respectively pretty close and then the imaginary values are 10 versus 0. also closer than before now if the antenna also had an impedance of just 50 ohms they matched then the intersection would be found at the very center of the Smith chart a distance of zero away from the center meaning there would be no reflected wave which is exactly what we want this would be like instead of before where we had different size ropes we just had a rope tied to an identical rope now there will be no reflection because well it's all the same rope so we like matched impedances or same size ropes because all the energy gets through to our load and this is actually the real use of the Smith chart when we have mismatched impedances that cause Reflections we can add things to the Circuit that make the impedances more closely matched allowing more power to reach what we want the load and the Smith chart is what helps with that telling us what we need to add to minimize the reflections the stub matching is definitely Beyond this video but that's some of the insight into how the Smith chart works and why it's useful and for the engineers looking to further expand their knowledge in all things Math Science and Engineering I highly recommend checking out brilliant the sponsor of this video brilliant is an educational platform home to thousands of lessons in math science and engineering with new lessons being added monthly and a big focus with brilliant is real world applications as they show you exactly how to apply the formulas and Concepts within their lessons you a much deeper understanding of even the more technical topics as you see how they apply to the world around you and with their constant practice problems along with intuitive visuals brilliant offers a unique experience to anyone who wants to expand their stem knowledge at their own pace and you can now try everything brilliant has to offer free for a full 30 days just go to brilliant.org Zack star or click the link in the description below plus the first 200 of you to sign up will get 20 off brilliant's annual premium subscription with that gonna end that video there thanks as always to my supporters on patreon social media links to follow mirror down below and I'll see you all in the next video
The words are the caption track's own and nothing is reworded or re-transcribed. Paragraph breaks are placed between sentences so the text reads as prose.
Free tools for your own script. No signup, no login.
Paste your draft and see where viewers are likely to drop off, with a rewrite for each weak line.
Paste the first 30 seconds of your own draft for a hook score and rewrites.
Check your draft against YouTube's advertiser-friendly guidelines before you record it.
Read this channel's public videos and transcripts, and download a writing brief for it.