Getting the transcript
Reading the captions from YouTube. A video nobody has opened here before takes 10 to 30 seconds; this page fills in on its own.
Getting the transcript
Reading the captions from YouTube. A video nobody has opened here before takes 10 to 30 seconds; this page fills in on its own.
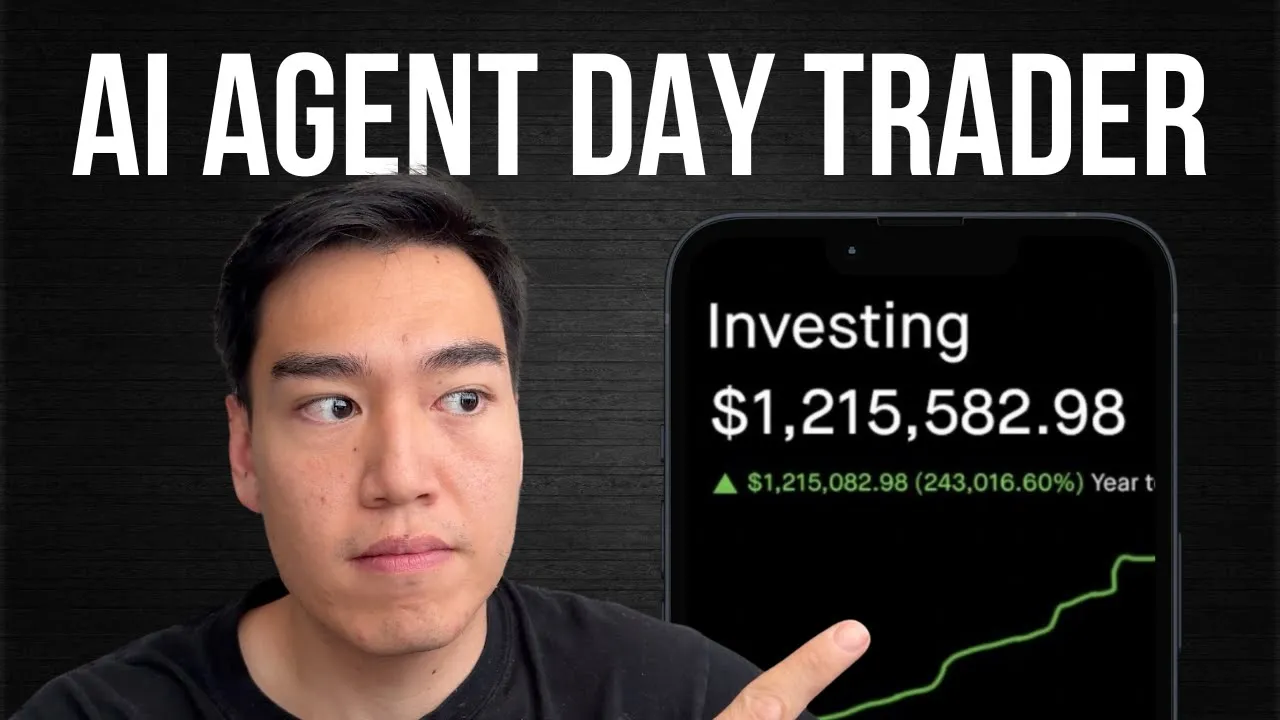
AI Pathways · @AIPathwaysChannel
Where viewers went back to watch this video again, from YouTube's public Most replayed graph, lined up with what was said at that moment.
Most replayed moment #1
2:025.4x the video's typical replay level
you in the beginning of the video, we'll use Telegram. So, go ahead and select on message. And I've typed in test on Telegram. So, if we test this step, we should see test as the text right here. Now, what we need to do is get live market data for that stock ticker. And the way we do this is through an API called the
Said at 1:55
Most replayed moment #2
7:015.1x the video's typical replay level
custom JavaScript code. But again, it's completely optional. You only really need it if you are a little bit worried about how the AI model is going to ingest basically 300 data points of financial data. And this just makes it a little bit easier on them so that they know how everything is properly labeled.
Said at 6:54
Most replayed moment #3
10:203.8x the video's typical replay level
because they're cheap and effective. And then for the model here, I typically always do GPT41 mini. So let's wait for this to load and select 4.1 Mini. Next, let's go ahead and add a system prompt so the AI model knows what to actually do. But what I've written is that you're
Said at 10:14
The graph counts replays. It does not show where viewers stopped watching.
Words
4,128
Runtime
18:28
Speaking pace
224wpm
Reading time
17min
224 words per minute, above the 201 75th percentile of 349 measured videos. That distribution comes from the 349-video hook study.
Opening (first 30 seconds)
Here's how I built my own profitable AI agent day trader completely within NINDN. Now, here's how the agent works. We can send over any stock ticker like Tesla here. And once we click enter, the agent will first get all the candlestick data as well as recent news sentiments to recommend us a trade. Here we can see that it's recommending for us to sell Tesla at an entry price of 325. We also have a stop loss in case the price does raise a bit too high. And we also have a target and exit price at 322. Next, I'll be going over how this agent actually works in the
112 words, the words spoken in the first 30 seconds at 224 words per minute.
Free, no signup. See how the first 30 seconds hold attention, with rewrites.
Sentence shape
| Measure | This transcript |
|---|---|
| Sentences | 272 |
| Average words per sentence | 15.2 |
| Longest sentence | 82 words |
| Questions asked | 1 |
| Sentences containing a number | 49 |
Most used terms
Filler phrases
54 in total: like 29 · actually 13 · kind of 4 · basically 3 · uh 3 · literally 1 · you know 1.
A literal whole-word count of the same phrase list the Prepublish browser extension uses, so a phrase inside another word is not counted and a phrase used in its ordinary sense still is. It is a count and not a judgement.
What this transcript is
Every word below is the caption track YouTube publishes for this video, pulled from the video itself and reproduced unchanged. It is not Prepublish's writing, not a summary, and not a re-transcription: it is the video's own published captions. English captions, generated automatically by YouTube, in the video’s original language. Source: the video on YouTube. A channel that would rather this page did not exist can ask for its removal through the contact page, and it is removed.
Here's how I built my own profitable AI agent day trader completely within NINDN. Now, here's how the agent works. We can send over any stock ticker like Tesla here. And once we click enter, the agent will first get all the candlestick data as well as recent news sentiments to recommend us a trade. Here we can see that it's recommending for us to sell Tesla at an entry price of 325. We also have a stop loss in case the price does raise a bit too high.
And we also have a target and exit price at 322. Next, I'll be going over how this agent actually works in the back end. and make sure to stay till the end and I'll show you how to build this from scratch so that you can implement it yourself in your own trading. So now let's go ahead and do a deeper dive into our NAND AI agent workflow. So starting off, we're going to communicate with Telegram, meaning that we're going to send the tickers over via Telegram and we'll get the analyses back via Telegram as well.
And the way this AI is going to help us generate trades is through two different data points. The first is this 1 minute 15-minute and 1 hour candlestick data. So all we're doing is taking the last 100 minutes, the last 115 minutes, and then the last 100 hours. And then once we have all that data, we're going to combine it with any recent stock news articles for the past day. And this way, we can get a complete view of both any technical indicators as well as any macro events that could be happening regarding the stock.
Then after all that's done, we're going to clean up all the data, merge the two data sources. We're going to aggregate it, send it over into an AI agent, which is going to help us form the final trade opinion. And again, everything is data focused, so there's no bias at all. All it's looking at is literally the prices of every minute, hour, and every 15 minutes. It's able to see all the volume levels as well. It's going to be able to calculate its own technical indicators.
And then finally, it sees some outside opinion via news sentiment. And from there, it'll form a final opinion that we can view in Telegram and decide whether we want to take the trade or not. Now, before we continue, if you want to get this template, as well as join an active community of AI builders with full in-depth guides on AI agents, make sure to click the link in the description. Now, let's go ahead and build this from scratch in NAN.
So, let's add the first step, which is going to be the trigger that starts this entire workflow. And just like I showed you in the beginning of the video, we'll use Telegram. So, go ahead and select on message. And I've typed in test on Telegram. So, if we test this step, we should see test as the text right here. Now, what we need to do is get live market data for that stock ticker. And the way we do this is through an API called the 12 data.
So, all you need to do, which is completely free, is sign up for an account and then head over to your API keys. Now, this API lets you use this 800 times every single month, as well as eight times a minute. So, you basically will never run out of credits unless you're running this like an absolute madman, but I'm assuming most of you should be completely fine with the free account on this plan. So, once you get your API key, head back to Naden and we can begin with the HTTP request where we'll actually get the market data.
So, go ahead and select the HTTP request here. And like I mentioned in the beginning of the video, we'll separate this out by 1 minute candles, 15minute candles, as well as 1 hour candles. So the first one will be 1 minute. And then feel free to copy this URL exactly. All you need to do is type in api.2data.com/times series since we do want the time series candles on the stocks. Next, we'll need to refine our searches.
So we'll go ahead and click the send query parameters button. And this is where we'll be able to tell the API what exactly we want. to like what ticker, what type of candles, and just any other data or information. So, first and the most important obviously is that we need to know what symbol to use. So, go ahead and type in symbol as the name. And then we'll just drag over the text from Telegram. Now, I wrote test here, which obviously wouldn't actually be a symbol.
So, let me go back to Telegram and just type in Apple so we can continue on here. So, all I did quickly was type in Apple to the Telegram chat. So now we can reference this AAPL stock ticker inside this HTTP request. So double clicking into this, what we need to do now is drag over the symbol. So let me do this one more time so you can see how this works. We head over into our Telegram trigger. We can see inside chat what we typed in for the text is Apple.
So just simply drag this in. And again, this is depending on what you write. I wrote Apple, but if you want to do Tesla, just type in TSLA and it'll analyze Tesla for you. Next, we need to know the interval for the candles. And like I mentioned, we're going to do 1 minute first. So add this parameter type in interval and then the value here will be 1 minute. Next we want to know how many one minute candles to actually get.
So we'll first select output size and this can be depending on how thorough of an analysis you want. But I find that 100 candles is plenty more than enough to kind of get an accurate trade signal as to what you should do for a certain stock. So I'll type in 100 here. And then finally we need to validate our account. So we'll type in API key. And this is where you'll paste in your API key that I told you to get from your free account.
And then after testing step, we can see that there's an invalid interval. And the reason for this is because this needs to be 1 minute, not just 1 M. So now test once again. And it should provide all the 1 minute candles for Apple. And these are going to be 100 1 minute candles. So we can see this is the date, time, open, high, low, close, and volume for 359, 358, 357. And it's going to do this 100 times. So the past 100 minutes will have all the financial data for.
Next, all we'll need to do is copy and paste this two more times. But rather than 1 minute, we'll do 15 minutes and then 1 hour. So I just pasted this two other times. Let's click into the second one. And we'll change this to 15 minutes. And then we don't need to change anything else here. All we need to change is this interval. So rather than 1 minute, this will now be 15 minutes. And then making sure that it can actually read the stock ticker.
We can wire this up to our Telegram trigger. And let's wire this one up to our final one below. And this is going to be 1 hour. So rename this appropriately. And then rather than 1 minute, we'll do 1 hour here. And just to see that this works, we can test this step. And we have all the 1 hour candles for Apple. So this is at 3:30, 2:30, 1:30, 12:30, 11:30. You understand the drill. Next, we'll just want to combine all these data sources with a merge node.
So super simple, just click this little plus here, and we can type in merge. And then for the number of inputs, we'll select this to be three. And then let's go ahead and wire all these up together. So now we have the one minute candles, 15 minute, and 1 hour candles all combined. So now testing out this workflow, we can see that we have three items from this merge node. So the 1 minute, 15-inut, and 1 hour candles. And to make this a bit more organized, we can combine these three items first into one item instead.
So go ahead and click this add here. And then we'll just aggregate all these nodes. So we'll select all item data into a single list. We'll test this step and it's going to be the same exact data, but rather than having three separate items, we're just going to have one item that has everything in here. Now, if we look at this, the way this is structured is kind of messy. Says symbol, interval, currency. We have a bunch of data points we don't need and we don't need to write apple every single time.
So, a way we can do this is by cleaning it up with a code node. Now, this is completely optional, but I find this helps the AI model understand and digest all of these data sources a bit easier. So what you can do is add one additional node here and we'll type in code. And this is where we can run custom JavaScript code. But again, it's completely optional. You only really need it if you are a little bit worried about how the AI model is going to ingest basically 300 data points of financial data.
And this just makes it a little bit easier on them so that they know how everything is properly labeled. So I've just pasted in some really quick JavaScript code here if you want to pause the video and see how this looks like. But this is super simple. All we're doing is structuring this output. We're not actually changing any data. So rather than this looking like symbol, interval, currency, etc. All we have is the ticker and then we have the candles for the 1 minute.
Then if we scroll down, we have the candles for the 15 minutes and then candles for the 1 hour. So the way this looks is just a lot neater for the AI model to understand all these data points. Now you can consider all this data gathering portion of the candlestick data as finished. And what we can do as kind of just like a cherry on top is get some news sentiment based on all the news around the stock ticker. So Apple for example, we can search for all the recent news articles about Apple in the past 24 hours to see how this will impact the stock moving forward.
So let's go ahead and add a fourth HTTP request here below. Once again, just type in HTTP request. And this time we're going to use a news API because again we want to get all the news articles for this specific ticker. So what you want to do is just head over to newsapi.org org and get your free API key. Again, completely free. Definitely do not pay for any news related APIs. This is going to be super simple to integrate with your NAN uh workflow.
After this, we can paste in this URL, which is newspapi.org/v2. And then just like before, we're going to want to send query parameters because we want to tell the API what to actually search for. In our case is the ticker, which is Apple. But again, if we typed in Tesla, this should now switch to all Tesla news articles. So for the first query parameter here, just type in a Q. And then for the value, head over to schema, scroll down, and then we just want the text.
So Q just means value here. So it's going to search for all news articles that includes the text APL. And it's important here that whenever you're writing these tickers in Telegram, you're actually writing the ticker and not Apple. Like if you just type in a and then we try to run this HTTP request, it's going to find a bunch of news articles on apples. You obviously don't care about the actual fruit apple and that's why we always want to reference the stock ticker which again comes from telegram.
So inside telegram just always type the ticker not the actual company name. And then next what we want is the date. So like I mentioned we want all the news articles from the past 24 hours. So this name will be called from and then you can just paste in this value exactly. But what I've written here is just today minus one day. So feel free to copy this format in JavaScript. Today is June 14th. So a day prior from this would be June 13th, 2025.
And then finally, just like last time, we need to input our API key. So type in API key there. We'll paste this in. And then let's test this step. And it should now provide all the news articles from Apple on the past 24 hours. So here we can see Apple risks falling behind because of AI revealed disappointments. Pretty standard news recently. So just a bunch of analyst reports on the actual stock. And then next, what we want to do is take those news articles and have an AI model read through them and provide us a sentiment of whether it's positive or negative in the short term.
So just add in another node here and we'll type in OpenAI. And then we'll just want to message a model, but you can use any other chat model like I've mentioned in my previous videos. I just like OpenAI's models because they're cheap and effective. And then for the model here, I typically always do GPT41 mini. So let's wait for this to load and select 4.1 Mini. Next, let's go ahead and add a system prompt so the AI model knows what to actually do.
But what I've written is that you're a highly intelligent and accurate sentiment analyzer in the financial markets. We want them to read all the news and then evaluate the immediate market reaction. We want a sentiment category of either positive, neutral, or negative. And then this is something a bit more standard with a sentiment analysis, but we want to calculate a numerical score between either extremely negative or extremely positive in terms of the ticker.
And then finally a concise rationale as to why it's negative or positive. And this way we can feed all this information to kind of like the big main AI agent node that has this background information. So it has all the candlestick data but also has this rationale as to why these new sentiments are positive or negative. And then finally we want to make sure that this is outputed as JSON so that it's easier for the AI model to read.
So we said that the output should look like this. Short-term sentiment we have the category score and then rationale. And then finally, we can drag over the articles. So from here, just simply drag over articles. And then right here, it'll say object. So to fix this, we can just stringify all this text. So just type in JSON.stringify. And then once you close the parenthesis, you should see all the text here below. So these are all the news articles that they can read through.
And then finally, you just want to make sure that you're outputting the contents as JSON. So that's going to be forced to output it inside this specific format. And then testing the step. We'll wait for this to load. And we can see that we have first the category. Right now it's neutral on Apple, the score of zero. And then we have this rationale which is pretty long, but we'll be able to send this to the AI model later on.
So they know why this rational is neutral. So if you were to only say neutral with the score of zero, the AI model later on will be like but why? You know, they want to they haven't read the news articles. So they need to know some reasoning. But by having this brief rationale, we can have more accurate trade signals moving forward for our stock tickers. Now, let's get to the exciting part and begin to wrap up this workflow so that we can combine all these data sources together to actually get our trade analysis.
So, just like before, we'll add in another merge node, but this time we're going to merge the two main data sources. So, type in merge here. I'm sure you're an expert already, but we'll set this as the first input. And then our new sentiments here will be the second input. And then after the merge, just like before, we want to aggregate into one single item. So right now this is going to produce two items but we want one because we want to feed one item to the AI agent all at once.
So add in another node here and then type in aggregate and then just like before we'll do all item data into a single list and then let's test the step and we can see that we go from two items to one made item here and then on this output we first start with the ticker which is Apple and then we have the one minute candles and then scrolling down a little bit more we have the 15-minute candles here. So now if we look at the time it goes from 10:30 10:45 and then we have the last 115minut candles and then finally here we've arrived at 1 hour candles.
So now it goes from it looks like 2:30 3:30 4:30 5:30 etc. And then at the end of all of this we have the short-term sentiment based on news articles from the past 24 hours. So here we can see the categories neutral the score zero and then we have the rationale. So again, this just combines everything so that they know essentially all the info that they could possibly know to help us develop a trade strategy. So now as basically the final step, we want to feed all this information to an AI agent.
So add in a final node here. Click on this advanced AI and then what we want to select is AI agent. And then for the source for prompt, we want to make our own prompt. So click define below here. And then you can copy my prompt exactly. I've written that you're an expert day trader. and then use the data below to give a single unified trade recommendation to either buy, sell, or hold based on all the candles as well as 24-hour sentiment.
And the only things they're supposed to output is first the technical recommendation to buy, sell, or hold, the entry price, stop-loss if the price doesn't go the way we want, and then the target or exit price. And then after this, we can have them actually read the data because this is important. If we were to just say this, but not paste in the data, they wouldn't know what they're looking at. So I just dragged in aggregate data zero which is all the candles.
So if you expand this it says ticker apple we have the one minute candles here 15-minute candles below and then the 1 hour candles here. So this data zero has all this information aggregated. So drag this over and then we want to stringify. So if we go here to the right we can see that under technical data candles we have all the one minute candles 15-minute and 1 hour candles and then below this we have the sentiment analysis for the past 24 hours.
So again, rather than data zero, we're just going to drag over data one here because this has the neutral zero and the rationale. And then below this, I've just written that each candle object has a time frame as well as candles for open, high, low, close, and volume. We want the agent to first group the candles by time frame. And then we want them to calculate their own indicators like RSI, MACD, or just trend lines for optimal entries.
And then we want them to confirm the trends with the 1 hour data, which is a bit more longer term. And then based on all this information as well as the sentiment analysis, we want them to either tell us to buy, sell or hold. And then this is the response format that they should have. So the technical recommendation, entry price, stop-loss, and then the exit price. And then finally, we can add an overall system message to make sure our output is neat and tidy for Telegram.
So go ahead and click add option here. And then we want to click system message. So what I've written in system message is that you're an expert day trader. only output exactly the lines below with no rationale and no extra commentary. So, we want the response format for either technical recommendation, entry price, stop-loss, target exit, and hold. This again just confirms that we're not setting any other information to Telegram.
This is all we care about whether we're buying, selling, or holding. And then finally, what we need to do with this AI agent is to actually connect an AI model cuz right now it doesn't have any intelligence. There's no AI model connected. So, just select open AI chat model. And then once again, instead of GPT 4.1 mini, I like 4.1 because we want the smartest model available that also doesn't break the bank like 01 or 03.
So now let's go ahead and test out this AI agent and see how this magic works. And awesome, we have the technical recommendation for Apple, which is the hold. We have the entry price not available because we're holding. And obviously, if you don't hold any Apple, then just don't buy. uh stop loss not available because it's telling you to just sit on your hands and no target or exit price either because again sometimes the best move is to make no move at all.
And then as a final final final step, I feel like I've said final step like three times already, but we just want to output the contents of this back to Telegram. So click add this here, select Telegram, and we just want to show this exact output that we have on this right hand side here inside our Telegram account. From Telegram, we just want to select uh send a text message right here. And then we just want to reference our chat ID from the beginning.
So collapse all of these data sources. These are all steps or nodes inside our workflow. All we care about right now is this Telegram trigger. And then drag over the chat ID. And then for the text, which is the text that we're going to see in Telegram, we want the output from our AI agent. So drag over this output. We want this to show the technical recommendation to hold entry price, stop-loss, target, yada yada. Test the step.
And this should now show up inside our Telegram account. And just to show you that they've actually sent this over inside Telegram, we have our message exactly here. We have the technical recommendation to hold. Entry price not available, stop loss not available, target price not available. Now, this concludes our day trader AI agent built completely within NADN. Now, if you found this video helpful or of any value, make sure to like, comment, and subscribe as it greatly helps the channel and we focus primarily on building AI agents either for businesses or for individual use.
And like I mentioned in the beginning of the video, if you want to join an AI agent community, click the link in the description.
The words are the caption track's own and nothing is reworded or re-transcribed. Paragraph breaks are placed between sentences so the text reads as prose.
Free tools for your own script. No signup, no login.
Paste your draft and see where viewers are likely to drop off, with a rewrite for each weak line.
Paste the first 30 seconds of your own draft for a hook score and rewrites.
Check your draft against YouTube's advertiser-friendly guidelines before you record it.
Read this channel's public videos and transcripts, and download a writing brief for it.