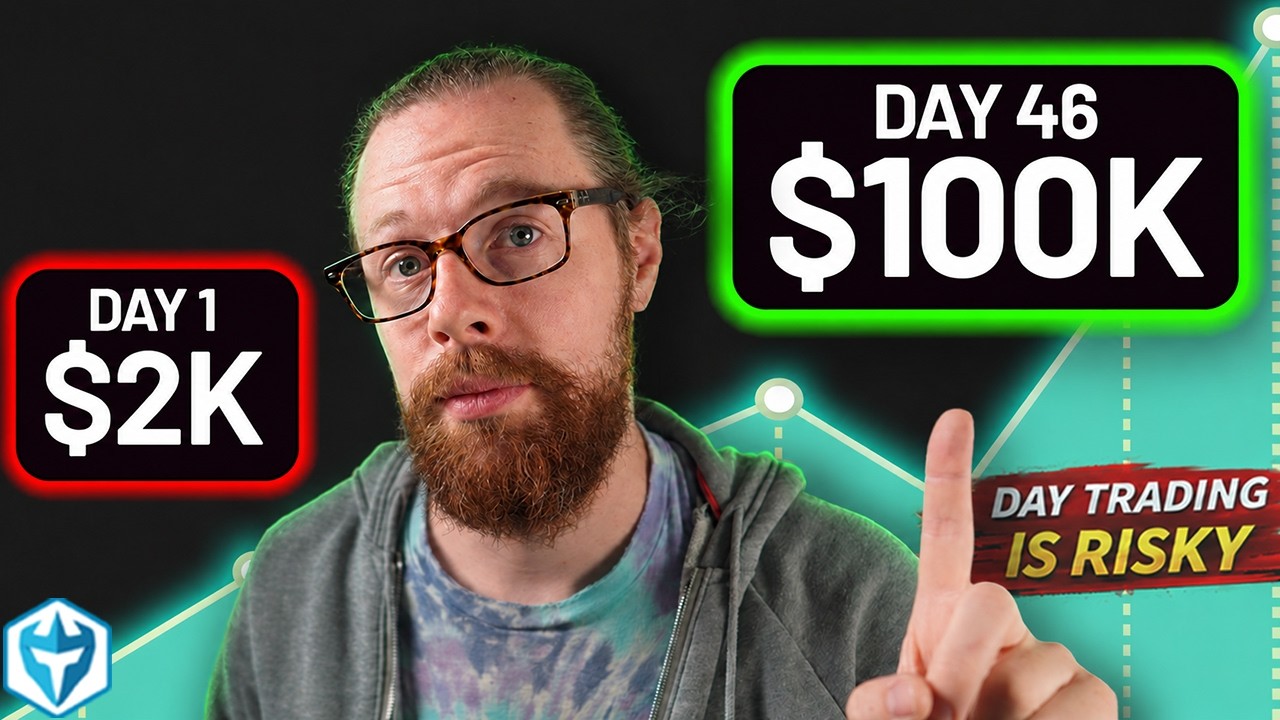
How I Turned $2,000 into $105,951.28 in 46 Days (Day Trading Strategy) transcript
Ross Cameron - Warrior Trading · @DaytradeWarrior
Words
11,284
Runtime
59:38
Speaking pace
189wpm
Reading time
47min
189 words per minute, between the 181 median and the 201 75th percentile of 349 measured videos. That distribution comes from the 349-video hook study.
Opening (first 30 seconds)
In today's episode, I'm going to teach you the day trading strategy that I use to turn a $2,000 account into over $100,000 in 46 days. In this episode, I'm going to share with you the three simple steps that I follow each day. These are steps that you can implement in your own trading, but I want you to make me a promise. I do not want you to put real money on the line until you first proven you can follow these steps consistently. and profitably in a trading simulator. I don't want
95 words, the words spoken in the first 30 seconds at 189 words per minute.
Sentence shape
| Measure | This transcript |
|---|---|
| Sentences | 694 |
| Average words per sentence | 16.3 |
| Longest sentence | 97 words |
| Questions asked | 20 |
| Sentences containing a number | 137 |
Most used terms
- stock69
- trading58
- day45
- challenge40
- um38
- account37
- uh34
- volume34
- candle32
- trade31
- five29
- big28
Filler phrases
168 in total: um 38 · uh 34 · like 31 · you know 25 · actually 22 · sort of 7 · kind of 5 · right? 5 · basically 1.
A literal whole-word count of the same phrase list the Prepublish browser extension uses, so a phrase inside another word is not counted and a phrase used in its ordinary sense still is. It is a count and not a judgement.
What this transcript is
Every word below is the caption track YouTube publishes for this video, pulled from the video itself and reproduced unchanged. It is not Prepublish's writing, not a summary, and not a re-transcription: it is the video's own published captions. English captions, published by the channel, in the video’s original language. Source: the video on YouTube. A channel that would rather this page did not exist can ask for its removal through the contact page, and it is removed.
Transcript
In today's episode, I'm going to teach you the day trading strategy that I use to turn a $2,000 account into over $100,000 in 46 days. In this episode, I'm going to share with you the three simple steps that I follow each day. These are steps that you can implement in your own trading, but I want you to make me a promise. I do not want you to put real money on the line until you first proven you can follow these steps consistently. and profitably in a trading simulator.
I don't want you to assume that my results are typical and that you'll just jump in and make 100 grand in 46 days cuz that's not how it works. I've paid my dues. I funded my first account in 2001, more than 25 years ago. I've been doing this for a long time. But I like to do small account challenges to demonstrate that the strategies even after all these years are the same. So, let's go ahead and jump on the screen share and start breaking it down.
Today is day 46, finally crossing over $100,000. And I will share with you that during this challenge, I made a few mistakes. I'm human and I had a few days where I didn't follow all of the rules that I laid out for myself in terms of stock selection, entries, and exits, and especially knowing when to walk away each day. We'll get into those sort of weak points or weak moments in the challenge during today's class, but we'll also talk about the fact that, you know, as a whole, this challenge was very successful.
I I performed a little bit slower than I did the last time I did one of these challenges. My previous one was a $600 account, just under $600 to $100,000. And I did that one in 44 days. So, that one was a little bit faster, but during that challenge, I was using leverage in my account, which means I was trading on borrowed money. During this challenge, using Charles Schwab as my broker, they didn't extend leverage for pretty much any of these lowerpric stocks.
So, although I was day trading, I was only really trading with the cash that I had available in my account on any particular day. So the growth comparatively is actually better because I wasn't using any borrowed money for this challenge. So let's begin by talking about big picture. I produced over $100,000 of profit. I did it on a total of 113 trades and I maintained 70% accuracy. As you can see right here, I had 80 winners, 33 losers, and my average winners were about $2,000 a piece, and my average losers were about $2,000 a piece as well, which means I had a profit to loss ratio of 1 one.
And I want to begin here because I want to start risk first. Trading is risky. That shouldn't be a surprise to hear me say that. And so whenever I'm thinking about trading both in general and on any specific stock, I'm always thinking about how much I'm risking versus how much I stand to gain. And I don't want to risk more than what I stand to gain. So if we just jump on the whiteboard here and think about this very simply, if I risk $2,000 and I stand to gain $2,000, how often do I have to be right in order to break even? 50/50, right?
I got to be right 50% of the time to break even. On the other hand, if I can achieve accuracy of better than just 50% upwards of 70% which is what I was able to maintain, then with this profit to loss ratio of 1 one, I will produce profit over the course of dozens, hundreds, and eventually thousands of trades. Over my career, I've taken over 35,000 trades, and I've maintained a profit to loss ratio of approximately 1 one.
Sometimes it's a little better, sometimes it's a little lower and my accuracy is maintained pretty consistently at about 70%. Now, one of the things I will be sharing with you during this uh class today are the metrics not only from this small account challenge, but also from my previous small account challenge of growing 600 to $100,000 and also from the past 10 years, which all of uh them have been imported into this software right here. these past 10 years, actually 11 years, where you can look at all of my metrics stacked up.
So, this is a really good picture of how I performed consistently over long periods of time. This was the previous small account challenge where I averaged about 74% accuracy uh and got up to about $120,000 in a similar amount of time. And so, we'll have a couple different points of comparison that we can uh dive into. So, because day trading is risky, I always want you to practice in a simulator before you put real money on the line.
And it's very important that you're thinking about how much you stand to gain versus how much you're risking. So if you stand to gain a dollar and you're risking a dollar, 50% is your break even. If you can be better than that with accuracy, you're profitable. If you risk $2 to make only a dollar, you'd have to be right 67% of the time to break even. Which means if I had this inverted or negative profit to loss ratio over the past 46 days, I really wouldn't have produced much profit.
On the other hand, if I could have been risking a dollar to make $2, well, I would have been able to make twice as much money over the same period of time. And so I always look at a trade and I ask myself if I have the potential to at least make what I'm risking, if not more. Because what I've generally found over long periods of time is that when I look at a setup and I think to myself, all right, I think I have the potential on this trade to make, let's say, 50 cents a share.
I rarely capture the full potential of what I think it could do. In fact, typically I capture less than half of that potential. So, in other words, if I saw a setup and I only have the potential to make 10 cents a share on it, then in reality, I probably would only make four or 5 cents a share. And that's really not a trade worth taking because typically I wouldn't be able to set my max loss tight enough to sustain a 1:1 ratio. in which case I would end up losing more on that type of trade on average than I make, which means my accuracy would have to be very high in order to support continuing to trade those types of setups.
So, in the last uh 46 days, we've experienced a big sort of swing in the market from a very very hot market to a very very cold market and then back to a very very hot market. In fact, just today, well, yesterday we had a stock that went up over 2,000%. And that stock continued higher uh this morning. Yesterday was at a low of I'll pull a chart up just so you can see it for context. Uh this stock yesterday had a low of 50 cents a share right down here.
So, this was way back yesterday, actually 35 cents a share. Today, unbelievably, this thing has so far hit a high of over $17 a share. That's an incredible move. And that's certainly not the only one. We've had a number of these big moves today. So, I will of course give you a recap of my trades from today, but I'm also going to walk you through the these three steps I've been following over the past 46 days. So, day trading is risky and risk management is key.
One of the things that I found is certainly true with me and is probably true for a lot of beginner and even experienced traders is that while I have the rules of the strategy, you know, which I lay out as, you know, the one, two, three steps and then each of these have sort of individual steps that you follow. Even though I have this and if I followed it consistently every single day, I would produce an expected result.
What gets in the way is, you know, right up here, my head, I start thinking that I know better. And so this is like it's so classic because I have the rule right in front of me and yet in the moment I think I don't know. I think I'm going to go ahead and take this trade that even though I have a set of rules that say I shouldn't trade it because the price is too high or whatever, whatever. We'll get into the more detail as we go through this class.
I decide to just override that rule and go with my gut. Unfortunately, our gut is not very well tuned to making money in the market. And so what ends up typically happening is that when you follow your gut, you end up giving in to your emotions, which means you end up buying stocks that are really high. Sort of almost like capitulating. Like you just give in to the fear of missing out and you punch the buy button at an obscenely high level.
And then when it starts to drop, you don't want to take the loss and you hold and hold and hold until you emotionally sell at the very bottom of the pullback. And now you're a trader who bought the top, you sold the bottom, and you're losing. And when you do this consistently, you have poor self-confidence, you have increased losses, and you have a poor track record. And this becomes a downward spiral where, ironically, you take increasingly larger positions to try to recoup the money you've lost.
But recouping the money the lo you've lost doing the same thing you've been doing which has been resulting in losing money is only going to fuel that downward spiral. And yet so many traders do it including myself from time to time. And so I found that one of the biggest obstacles between between success between a beginner trader and finding success and profitability is your mental game. So I'm of course going to share with you the three steps that you need to follow, but I also want you to be really thinking about your mindset.
So what I want you to focus on through this episode certainly but in trading with trading in general is high accuracy. If you can focus on having high accuracy that is the beginning of creating a positive feedback loop. So why is that? Well, when you focus on high accuracy, you inevitably eliminate some of the outlier losses that have been drawing down your profit loss ratio and have been hurting your self-confidence.
So improved accuracy means you've eliminated unnecessary losses. You've got a better profit loss ratio, which means you're more consistent. More green days, more green weeks. If you've got more green days, more green weeks, you're going to have a stronger track record. That builds self-confidence. Now, with self-confidence, you have good a good basis to start taking larger position sizes. Larger position sizes, increasing the frequency of trades means more profitability.
And this becomes that positive feedback loop. And you've seen that in my own trading whenever I do these small account challenges. So this is the small account challenge that I had done um previously. This was the last one from uh $600 up to a little over a hundred grand. Let's see. I crossed 100,000. Uh looks like it was somewhere. Oh no, it was right here that I crossed 100,000. So anyways, I think that was in 44 days.
It took me 44 days to grow a $600 account to 100 grand. You can see how the first week was relatively slow growth and then the growth started to really pick up quite quite quickly. Uh it slowed down a little bit here and then as uh as time went on I could just adjust the calendar here to December uh 31. Um let's see over the course of we'll do detail down here and I'll show you this. um you know I had a sort of slow period and then it increased again and then again we stretched this out you know one more year and you can see you know that continued so that's now 2 years of a small account challenge then we go into another two years this is getting into holy smokes what just happened here now we're getting into a period that was unbelievably strong we had a GameStop short squeeze so on and so forth and so over the last uh 46 days I've been doing this charity challenge.
All the profits going to charity. Um, let's see. We'll go year to date here. My focus has been sitting down each day following the rules and the best I can with a couple of exceptions and trying to build that positive feedback loop. And so, if you look at this over the 90-day window here, you can see that the profitability was steady and then it started to really increase quickly here. And I suspect if I continue this challenge for another 46 days, we'll see the profitability go up even faster because I've got the confidence.
It's not enough just to have money in your account. Some people think, "Oh, if I just fund my account with $100,000, I'll have the money to be able to take big trades." Money is not the first order of business. The first order of business is building that strong track record, building your self-confidence because that's your foundation. And this is why it's so important to practice in a simulator before putting real money on the line because it's in the simulator that you build that foundation.
That's where your track record comes from. So, you shouldn't put real money into the market until you've first proven that you can maintain this consistency. Now, as many of you know, this small account challenge has been a charity challenge with all of the profits that I've made being donated to charity. So, we have now raised over $516,000 over the course of the last four small account challenges that I have done. And every time you guys hit the thumbs up on the episodes in this series, I add an extra dollar to how much we donate.
So, that half million is a combination of my trading profits and you guys hitting the thumbs up. And we have successfully donated to 50 children's hospitals across the country. one in each state plus Puerto Rico, Washington DC, Guam, and the US Virgin Islands. So, that was the goal for this challenge, and we have just crossed it right here. And all of the profit that comes from this episode right here and you guys hitting the thumbs up will go to our continued goal of donating to Children's Hospital.
So, thank you so much for being part of this exciting challenge. Step one, stock selection. So every morning when I sit down, my job is to find a stock worthy of trading. I'm using stock scanners to find it. Now the stock scanners that I use are a premium service. It's a software that I actually built. I began building it in 2017. And today we have thousands of traders across the world who are using these scanners to find stocks moving in real time.
We subscribe to real-time market data. We aggregate that data and we search for stocks that meet my five pillars of stock selection that you're about to learn about. So, the first order of business is to find a stock that's moving. Now, what I want to do is I want to give you a PDF that you guys can print out and use in your own trading that outlines not only my stock selection guide, including the five pillars of stock selection, but also outlines my small account strategy, my trading plan, and a trade log that you can begin using in your own trading to track your performance.
There will be a link pinned at the top of the comment where you can download those PDFs for free. We will ask for your email address. We'll give you the email. We'll give you the link where you can download them. We will not share your email address with anyone. We will send you periodic emails to keep you informed at what's going on here at Warrior Trading, new challenges I'm doing, and things like that. But I want you to know that we don't share your email with anyone.
So, please check out these PDFs. You can use them in your own trading. This is a resource that we've put together for you guys and it accompanies this class here today. So these are my five pillars of stock selection. Number one, the stock has to be up at least 10% or more on the day. This is an indicator of demand. Number two, the relative volume needs to be at least five times above average. That means today the stock is trading on five times higher volume than its average volume each day over the last 50 days average.
Number three, the stock should have a news catalyst today, which is the reason it's up 10% and the reason it has five times above average volume. Number four, the stock should be priced between 2 and 20. This price range is not only better for small account challenges, but it's also more popular among retail traders. There's millions of retail traders out there and retail traders generally find trading higher price stocks to obviously require more capital but to also have lighter volume and carry more risk.
Number four sorry number five is the supply. These are the indicator the five pillars of stock selection. The first four are indicators of demand. And in order for a stock to go up 100 200 300% or more there needs to be an imbalance between supply and demand. So supply in this equation is created by the float, the number of shares available to trade. So when a company does its IPO, they sell shares on the open market and those shares are a fixed number and that becomes the pool of shares that we're buying and selling from.
So if you have a stock that has a relatively small pool of shares and they put out a news catalyst and there's suddenly a surge in demand, then the price will move up very quickly as traders are scrambling to buy shares from the limited number of sellers that own shares. Now, these five pillars of stock selection are not just my opinion of what I think probably works. They're actually based on my own trading data. This is my 10-year average.
Over the last 10 years, trading stocks with five times relative volume, five times above average, has produced that much profit. And the rest of my profitability has come from stocks that had slightly less volume. So clear, very clear, five times relative volume is a must when it comes to the pillars of stock selection. During my small account challenge, this is the performance from the from the last 46 days, including today.
Most of the profit by by and by and large was from stocks that had five times relative volume. But you can see I had a few more trades in this lower section which I feel was a bit of a mistake, a little bit of a divergence where I was anticipating that a stock was going to work but in many cases I was wrong and it did not work. So this is an important thing to take note of in terms of mistakes that were made during the challenge.
So um again I'm going to I'm going to admit that there were some mistakes that were made. So, number one, um, trading lower relative volume stocks. That was the first mistake that I made during this challenge at various times. Number two, stocks that have higher volume today. On my 10-year average, I've done better when stocks have had more than 25 million shares of volume today. And consistently, I do better as we have more volume.
That's typically because when a stock has a really good catalyst, there's more people trading it, and so the volume goes up. That was also true with the small account challenge, but I had a few losses down here on stocks with lower volume. So, mistake number two was dipping my toe in on um oops, low volume, sorry, low volume stocks. Low volume stocks uh in many cases are a mistake. This again is me trying to anticipate that the stock is going to work and is going to have a lot of volume that it's going to be popular today.
Perhaps because I just saw the news catalyst come out, but it's often better to wait for the confirmation rather than try to anticipate. Over the last 10 years, trading stocks that have been gapping up more than 2% on the day is where pretty much all of my profit has come from. That means the stock is moving up in either after hours trading or pre-market trading based on news that has come out after the previous close.
This is the the strategy that I trade for the most part is breaking news catalyst and most of those catalysts come out in the after hours session. During my uh 46-day challenge here, most of the profit also came from this sector. Uh but there were a few days where I was trading stocks that had actually gapped down and were reversing and there were a couple that were smaller. These are outliers and again when you're doing a small account challenge and you you know your back is kind of up against the wall, it's better to just focus on the basics and not deviate.
So, let me pose the question. Why would a stock go up on uh five times relative volume, above average volume, up at least 10%. It's because there's a catalyst. So, trading news is important. However, in the last 46 days, we've seen a number of examples of stocks that have actually made enormous moves and there have not been clear catalysts. That has been a challenge. And so, one of the things that I have well, so let me I'm going to talk about that in just a moment.
Before I do that, let's talk about price. I've done the best historically between $2 and $20 and between five and 10 has been a sweet spot. This is over my 10 the last 10 years and this is during the small account challenge. So, this is pretty consistent. Had a couple of exceptions here, but nothing that was really uh too far outside the norm. So, did a good job with price. And then number five was float. And so stocks with a float of less than 20 million shares are the ones that tend to make bigger percentage moves.
And so this column right here on our scanners is showing the float. And so you can see here these are our uh top five six leading gainers in the entire market right now today. And um actually this was a screenshot from the other day. But in any case, you could see clearly that these leading gainers all have lower floats, less than 20 million shares. This one's an exception at 26. And these ones are exceptions as well, but this is generally what we see on any given day.
So if I pull up the scanners from just today as an example, um this is this morning and number one leading gainer right here has a 1.6 million share float. The second, this is up 400%. The second leading gainer actually has a 34 million share float. The third leading gainer has an 11 million share float. The fourth and fifth are both 7 million shares. And then you get one down here that's a little bit higher. So generally speaking, floats of under 20 million are the sweet spot, but there are some ex exceptions.
Now when it comes to news, this is tricky because today is an example where this stock RET, which made an unbelievable move, has actually gone up with absolutely no news whatsoever. It's a Chinese stock and there is no clear catalyst. And this definitely poses a risk for traders. It's hard to understand why a stock would be going up with no news. Generally speaking, traders draw a conclusion that somebody must know something because surely a stock doesn't go up in one day from 50 cents a share, 35 cents a share, whatever it was, all the way up to a high of $8 without some type of catalyst.
But I would argue that what we do know is that with some of these stocks as they start moving higher, there are short sellers that start selling, selling, selling, selling, expect the stock with no news will end up rolling over. And if a certain point that stock pushes past their max loss, they have no choice but to cover. And to cover that position means buying and adding to the long side, which creates this buying volume and this big squeeze.
And so it's very possible that you could actually have a stock with no underlying catalyst. Truly, no fundamental reason for it to go up that high, but because shorts got stubborn, you have what's called a short squeeze. And that's what happened on GameStop in 2021. Did the fundamentals match GameStop being priced at a high of $500 a share? And the answer is no. We we understand that clearly. And yet it became disconnected from its true value because of the dynamics of fear and greed and buying and shortselling.
And so these can represent opportunities. This stock, for example, would meet four out of the five pillars of stock selection. Because it doesn't meet all five, I have to take it with a little bit less risk, recognizing that there's a higher chance that it could fail. However, if it is the leading gainer as it is at this moment right now, it would be a mistake to disregard it simply because there is not a fresh news catalyst.
So, that's an important thing to be aware of. Okay. So, we'll hide that. So my five pillars of stock selection have become uh listed like this. Stocks got to be up 10% needs five times relative volume. There should be a news event should be priced between 2 and 20 and the float should be less than 20 million shares. Okay, so that's very clear. However, within those five pillars, I also have acknowledged that I do better at a certain time of day.
So I do better earlier in the trading session with declining profitability as the day goes on. And that's because most of my trading is on stocks that have breaking news and that news is typically coming out early in the trading session. Now, you can have news catalysts that come out uh later in the trading session in the afternoon. However, I don't typically uh trade later in the day because I feel like there's only a limited amount of time before the market closes.
I would rather trade early because if I make a mistake, I still have time to recover. But if I trade at the end, I don't have much time to recover that mistake. So this was during um this is actually total profits from all time. Let me just um update that slide. And this is so this is um let's see let me just reverse this. So this was the 10-year average right here. And then that's the 10-year average. And this was the small account challenge right here.
So during the small account challenge, I did have a few losses trading a little bit past the open. And in hindsight, I had regretted that. I felt that I had deviated from the time of day where I typically trade the best. So time between 7:00 a.m. and uh really 9:30 for the cleanest action because after the 9:30 opening bell, we have a couple changes in the market. One is the presence of market orders. The other is the presence of stop orders and the third is the present of presence of halt levels.
These all give the market makers the upper hand against us the little guy as the retail traders. So after 9:30 in this current market I find that trading typically becomes more difficult. So the highest quality stocks are even more tightly filtered than the five pillars I just shared with you. I have a minimum that the stock has to be up at least 30% on the day. It should per I would prefer a breaking news headline, but again that can be an exception.
The price between 5 and 10 is my real sweet spot. Five times relative volume, it's a must. The time between 7 a.m. and 10:00 a.m. and the float of under 10 million shares to further reduce the supply, which then means the imbalance between supply and demand will be even bigger. So today's top gainers earlier this morning on day 46 we had ZTG which was up over 300%. This is an incredible move and this was at 7:15 in the morning.
So this is very early. MEEDS was our second leading gainer up 137% as you could see uh when I just pulled up the slides or the uh scans just a moment ago. MEEDS is as of right now up 485%. It's highly volatile. It's making a really big move. ZTG has pulled back a little bit. It's now up 197%. So, these are this is what I was looking at this morning at 7 a.m. as I'm trying to make the decision of which stock should I choose.
I always want to make sure I'm choosing a stock that I feel is obvious that I feel other traders are also likely looking at. So, this was day 46. Now, yesterday, to add context, we had this 2,117% short squeeze, which as we now know, continued later this morning. But at the time at 6:45 7 a.m., I didn't know that this was going to continue. All I knew was that yesterday we had a huge move. And that meant I wanted to pay really close attention to stocks that were similar to this one because after you have a big move, traders are not wanting to miss the next one.
So when you have another stock that pops up that looks similar, traders are going to be quick to jump in it. And so what did this have going for it? It was a foreign listed security priced relatively low that started moving very quickly and in an instant was up over 100%. This morning ZTG hits our scanners. It's also a foreign listed security. Within an instant, it's already up over 100% and it's moving quickly. So, this to me met the profile of being the similar type of stock as our big move in the previous session.
So, how does it meet my five pillars of stock selection? It's already up 150% before I'm considering taking my first trade. It's got 13,000 times higher volume today than its 50-day average. There is no news catalyst, but neither did the one yesterday that made the big move. So, maybe that's even better because it makes it more similar to yesterday's big move. The price is between two and 20. It's a little on the lower side, but but it's right at the cusp, so I'm okay with it.
The float is under 20 million shares. So, this meets four out of the five pillars. The time is right, and it closely aligns with our big move yesterday. It has the China connection. The big move from yesterday was a Chinese listed stock. This is a stock in um Macau. It's a um a special administrative zone of China. I think you could kind of think of it as like the Washington DC of the United States or maybe the Puerto Rico of the United States.
It's a it's a it's a part of China. And so and they they operate um in China. All right. So it's got the China connection and all of a sudden we get this huge move. The stock ends up going up 400% on 50 million shares of volume. So when the stock first hit my scanner right here, I had to make a prediction. Did I believe this stock had the potential to go higher? And I used these five pillars of stock selection to come up with the answer.
And I believe the answer was yes. So I believed the stock had the potential to go higher. That's step one. And I believe the stock was obvious. I I felt at that time it was in fact the most obvious stock in the entire market because it was the leading gainer. And so now the question is where do I take my entry? Right, we've got a stock candidate. Now I've got to decide where to buy. So now we're going to go into step two, which is actually where to press that buy button.
Okay, so for step two, I want to wait for the pullback. I don't want to just slam my order while the stock is in the middle of a squeeze because if I do that, I don't have any basis for nearby support. So, let me give you an example. So, we have a stock that squeezes up right here. Squeezes up right here. And let's say so this is the low of the of the initial pullback or the initial move right down there. So, let's say I just punch my order right here.
If I just jump in right there at the beginning of the move, where's my max loss on that trade? Well, my max loss should be at the most recent level of support, which is right down here. So, that's really far away. Now, if it keeps going higher on the next candle, I might think, oh, no problem. You know, I got out right here. This is a good trade. But it's not really a good trade because I was risking more in risk than I was standing to gain in reward.
Risk and reward. So even if I was profitable on this particular trade, I would need to be right probably 70% of the time in order to consistently take this setup and be profitable. And so that's not very sustainable, especially for a beginner trader. So rather than getting in right there, what I would rather do is be patient and let the stock pull back. So let it experience its first dip right here where we have a little pullback.
And this is now the moment of truth because the stock could come all the way back down and we've certainly seen that happen. We've seen examples of that happening today. So, let's just pull up the scanners and I'll show you an example from this morning. So, let's see. We had um what was one that we had from today? We could scroll back on our scanners a little ways here. Um let's see. We had DLXY. So, this is a good one from earlier.
Although it ended up rebounding, I don't think that's uh really the point at the moment. Um this rallied up. Well, it's not a perfect example. Let me let me switch to the one minute chart. Might be a little clear. So, this one rallied up here and um and then basically it went from 45 to 110 and then back to 60. So, if you just bought it in the middle of this candle here or here, your max loss is way down here. And this came all the way back down.
Now, eventually it came back up and then you got a little pullback here and it pushed a little higher and now after the opening bell, we've gotten a little bit of action here. That's a nice pullback right there. But buying in the middle here, in the middle here, or in the middle of here or here, that doesn't really make a lot of sense because your stops are way back at the low of the previous pullback. So, right here is a particularly extended position to be considering a trade because it's support is so far away.
So, in order for you to get a 2:1 profit to loss ratio on this from this spot, it needs to go like up to here. Your stop is down here. And is it realistic for it to go up 100%. Well, in a day like today where we're seeing a lot of volatility, it's certainly not impossible considering the other stocks that have moved. But it's not a great strategy to require the stock go up 100% in order for you to justify taking the trade.
So, in any case, this is the moment of truth. If it pulls back and then does not go lower, it bases out here, maybe there's a little bottoming tail, whatever, then we would start to look at this as a new area of support because this is where the buyers start to step in and say, I actually think that this stock is going to go higher. So, as that first candle crosses right here, I call that a crossing candle. It's the candle over candle formation.
And this candle signifies a change in trend. So green, green, green going up and then as we have a red going down, we're having a change in trend to the downside. So the trend changes right here and then it changes again right here with this reversal. So this is actually the place right there where I want to be a buyer right here in the middle of that candle. The moment that candle breaks over the red candle, I'm in.
And now I'm looking for a continuation up to the high. Now by taking an entry right here, what's my max loss? It's the low of this pullback. So now this is my risk risk and my profit target is first a retest to the high a day which is at least the same size as the risk but often higher and then if that works we're getting a continuation higher. So often when we hit high a day if I'm being conservative I'll sell half my position and I'll sell more as it goes higher.
If I'm being aggressive I'll hold the whole thing. If I'm being really aggressive I'll actually add here moving my cost basis up to about here and then sell into the extension. But I would only do that if we're in a really hot market. So those are a couple different scenarios. That is the pullback that I look for and that's exactly what I traded on ZTG this morning. So ZTG pops up right here and it hits the scanners, right?
So I'm seeing it hitting the scanners. Ding, ding, ding, ding, ding. We're seeing the volume increasing. It pulls back and right there I punched it. So I was waiting for the pullback. I added right there. Now, in this case, I was a little bit more aggressive, which I'll show you in a moment. Waiting for the pullback is so important. One of the other mistakes I made during this challenge was being at times impatient. So, I was impatient and I did not wait for the pullback, not waiting.
So, I would jump in something that was too extended. This is sort of giving into FOMO. And I think part of this was because, you know, I felt like I really want to grow this account quickly. I want to be trading every day. I have this goal of donating to 50 children's hospitals across the country. I'm and and I, you know, I didn't want to miss opportunities and so I was being a little too aggressive at times and so I wasn't as always always as good at waiting for this setup to form and sometimes I would jump in a little prematurely up here or even somewhere in the beginning of the move because I didn't want to miss out.
However, waiting for the setup to come to you will yield better results than being impatient. So, this is the formation, the rally up, the pullback, the first candle to make a new high, that's our crossing candle, then the retest through the high a day, and the extension higher. And so, this morning, that's exactly what we got on ZTG. And so my first entry on it was right down here at $155 and $161 right in this area looking for that break through the high.
That was my entry. Okay. So now I've taken my position. Now you'll say Ross there's there h what what if let's say just for the sake of argument uh what about right here? You know this ends up going higher but that doesn't really look exactly the same. That's a little more complicated. You're right. That's a slightly more complicated strategy. Later in this episode, I'm going to share with you some recommended reading.
Two of the books that I'm going to recommend. Um, one of them, Thinking in Bets by Annie Duke. The other Quit: The Power of Knowing When to Walk Away, also by Annie Duke. These are great books. You can listen to them on audio tape. They're not very visual, so just listen to them while you're driving or something. But, um, one of the things that Annie Duke talks about, she was a professional poker player, made millions of dollars playing poker, and her brother taught her how to play.
And the way he taught her was he taught her first just a few sets of hands to play. And he said, "Only play these. When you get these cards, play that hand. Everything else just fold. Don't play it." And as a beginner trader, I would encourage you to do the same thing. Just focus on a couple of really good setups. And this is my favorite. Get good at this. And then later, once you've got your bread and butter, then you can start venturing out to some of these more risky setups.
This is not as clean right here. While it did work, it was not as clean, which meant it carried more risk. So for the small account, this first pullback right here was the spot to be a buyer. So now there's a question of when to sell. All right, you know when to buy. Now we got to figure out when to sell. It's very important to respect exit indicators. A big seller appearing on the level two is an exit indicator. Level two is our market data.
So that's where we see all the buyers and all the sellers. So if we're watching a stock that's moving higher and suddenly we have let's just say for the sake of argument we'll create a little level two window here. So let's see we'll make um make the level two window. So on the left we have our bid and on the right we have our ask. And let's say we have an order here at 550 for 1,000 shares and then we have an order at 555 for 100,000 shares.
That is a large sell order. So if I'm in a position and let's say this was 555 right here and I see that big sell order, I'm going to recognize that that sell order is going to create at the very least shortterm resistance on this stock because in order for the price to go higher, there'll have to be 100,000 shares of buying that buy up that seller. And having 100,000 shares of buying with something that's already extended is not as likely.
In fact, if you were a short seller, you probably wouldn't cover your short seeing that you've got this resistance right overhead. And so, the only people that would be buying would be someone who's long. Well, who's buying to the long side way up here at the middle of the candle? That's not really a good spot to buy long either. So, typically a big seller on an extended stock will result in a pullback. Now, that pullback might be just a moderate pullback down to here, something like that, and then we make way for another leg higher.
That's certainly possible. We could have another crossing candle, but for right now, the seller is in the way. And so when I see a big seller, I jump out of the way, especially if I've just gotten into the trade and I don't have a very big cushion. Number two, the obvious appearance of a hidden seller. A hidden seller is when there's buy orders going through. So in this case, there's lots of people buying at 555, buying, buying, buying, buying, buying, but the price isn't budging.
That tells us that someone is unloading at 555 and they're using a hidden order. This is something that market makers can do, but so can more experienced traders using specialty boutique brokers. So, if you see a lot of buying and the price isn't moving higher, that's a warning sign. Number three, a large burst of red on the tape can indicate a surge of selling. It does indicate that and a and a possible false breakout or a reversal.
Number four, if we initially have a pop, so a big squeeze, but then a dramatic reversal, it'll form a topping tail. Topping tails are bearish. So, if we do a mini lesson here on um candlesticks, we've got a candlestick right here, and this is the open. I'm going to switch here. This is the open of the candlestick. This is the close. And then this is the top of the candle wick. This is the bottom of the candle wick. So, the most bullish candlestick would be a candle that opens at the bottom, it never goes lower, and it closes all the way up at the top.
That's the most bullish. What would be a little bit less bullish? Well, maybe if it opened, it sold off and then it came up because that would tell us that while it closed strong, it was weak at the beginning of the candle. What would be a little less bullish? What if it opened, it went lower, then it went up, it hit this high, and then it sold off a little bit. So, it closed down here. This now tells us it closed a little lower than the high.
So, inside the candle, what essentially happened was the price opened. It tick tick tick tick tick down, then tick tick tick tick tick tick tock up, and then closed. If this is a one minute long candle, then within those 60 seconds, that was what happened to the price. And so that's a little bit more bearish than this move here where it opens and just goes straight up as you can imagine. Now certainly there's um even more extreme examples of this where you have a stock that opens it goes way down like this which means in the moments where we were dip dip dip dip dipping down this was actually a red candle right and then the price reverses.
So all of a sudden we squeeze up to way up here. And so in that moment this becomes a green candle with just the bottom candle wick because the open price stays the the same through the whole period. This was the open. It closes here. Now it looks like oh we're in good shape. But wait, no, just before the close all of a sudden there's a big surge of sellers that come in and it comes down like that. So then what do we have?
We have a candle that looks like this. And this is called a dogee. When you have a really tiny body like that, this is a candle of indecision. It communicates a struggle between buyers and sellers. You don't want to see buyers and sellers struggling on a stock that is in this position right here because this is a stock that previously was very bullish, but now suddenly we're having at the very top of this move. We'll just erase this just so I can kind of show this to you.
We have at the top of this move, we have a big dogee candle like that. That is a reversal indicator. What often happens is the next candle opens at the same price, begins to go lower here, and then we have a drop down like this. Now, on the other hand, down here, if you've got that bottoming tail, that bottoming tail is bullish for the next rally back up because it shows that while it was weak, buyers bought it up, we rally back up, we rally back up again, and then let's say we get another dogee at the top, candle of indecision, preparing for a dip back down.
So in the case this morning and these are the areas that I pay a lot of attention to as a trader the changes in trend. So I look at the candle shape around these changes and I look at those topping tails to signify weakness or the bottoming tails to signify strength and I also check the volume profile. So that's a number of shares traded on each of these candles. So what we like to see is a volume profile of increasing volume.
So volume is going higher and higher and higher. What we wouldn't want is for volume to be doing the opposite. If volume starts high and is getting progressively lower as the price goes higher, we call that a divergence. A divergence often indicates that while the price is going higher, there's less strength behind the move and we're likely to roll over. Now, for those of you guys that are brand new traders, you might be thinking, "Wow, this is a lot of information to process in in real time." And I agree it is.
I find this at this point in my career to be fairly straightforward. This is pattern recognition. This is a visual language of the financial markets. And just as if you looked at um a picture of a dog and a cat, you can immediately recognize these are domestic animals. They're pets. Uh, let's say the dog is a golden retriever. So now you're associating all these positive connotations you have with golden retrievers. They're big, dumb, happy dogs.
They're friendly. They're probably not going to bite you, right? And you see the cat and let's say it's a Siamese cat. You're like, "Oh, I better not go near that cat. It might scratch me, right?" So you have these connotations that you associate just by looking at the pattern, the visual shape, right, in the picture, and you draw all these conclusions. The same thing happens with candlestick charts. You look at this shape and all of a sudden you draw all these conclusions about what's going on behind the scenes.
What's helpful as a beginner trader is to have a translator. So what I do every day in at Warrior Trading is I provide my market commentary and I'm in the role of being a translator. I'm sharing with you what I'm seeing and I'm putting it into layman's terms. I'm articulating the volume profile. I'm commenting on the topping tales. I'm pulling together all of these different data points and giving them back to you in a way that's easier for you to understand.
And the hope is that the more you listen and the more you go through the classes and rewatch archives of my trading, the better you'll get at assimilating all that data so you actually process it yourself. And that's just like learning any other language that you listen to other people speaking the language, you study it, and the more you immerse yourself in that uh language, the the the the quicker you will pick it up.
And so I do have links, of course, um at the bottom of this um episode or and in the comments where you can download the small account uh challenge PDFs. So the PDFs accompany this class, but you can also do a two-eek trial. And when you guys do a two-eek trial, you can actually listen and watch over my shoulder as I'm trading. That two week trial is 20 bucks. So for $20, you get to spend two weeks with me listening to me provide my market commentary, giving you, you know, 25 plus years of educated intuition.
And you also get to use this software right here for scanning, charting, and for searching the breaking news feed. So this is what you get as part of that twoe trial. So make sure you guys check that out if you haven't already. Okay. So, respecting my exit indicators is probably one of the biggest challenges that traders face in my opinion. And I take this with a grain of salt because I've been trading for a long time, but my opinion is that it's not very difficult to choose which stocks are obvious.
I look at the scanners each day and I'm typically trading the the top two or three leading gainers. It's it's fairly straightforward. These stocks usually meet my five pillars of stock selection. By understanding those five pillars, you better understand why these stocks have the potential to move. But usually, I'm trading and focusing on the leading gainers each day. So, that's fairly straightforward. Waiting for the first pullback, that can be challenging.
So, you know, you've got to wait for the first pullback and it can be a challenge to have the patience and discipline to wait for it. But if you can, you know, then that's where you can be in a good spot. But where a lot of traders get tripped up is on the exit indicators. Ultimately holding losers too long which brings down your average loss or it increases your average loss, right? It brings it also hurts your accuracy if you let a winner turn into a loser.
So holding losers too long and also selling winners too soon. A lot of beginner traders do this. You get in, you probably take a little too much size at the beginning of the trade and so you're immediately testing your kind of emotional comfort zone. you're like, "Oh my gosh, if this doesn't work, I'm I'm going to get be smoked on this thing." So, as soon as it goes up a little bit, you're like, "I'm out." And now what you've done is you've capped your winner.
You might have had the right idea down here, but you know, you took instead of maybe you should just take a 100 shares. You took 10,000 shares and you're all of a sudden down, you know, 8 cents a share, you're down 800 bucks. You're like, "Oh my gosh, that's so much money." And then it pops up and you're up 800 bucks. You're like, "I'm selling the whole thing." and you get out right here and then the stock ends up going up 75 cents a share.
That would have been 75 cents a share times, you know, 10,000 shares is $7,500. But you're a beginner trader. You shouldn't be trading with this kind of size. So by trading with size that's too big, you're becoming emotionally respon you're you're emotionally activated essentially. And that's another reason that I'm a big fan of practicing in a simulator. So you're in that safe environment. And this is it would have saved me so much heartache if I had just practiced in a simulator instead of putting real money on the line.
So in any case, what a lot of beginner traders do is when they're in even a winning position, they sell too soon. So now they're reducing the size of their average winners, but when they're in a loser, they don't want to cut the loss. And I'm I'm saying they, but it's me, too, because I've been there myself. So don't feel bad. This is how most traders and most humans are in the market. We're not at birth trained with the mental aptitude to be a good trader.
We have to train ourselves to be good traders. And that means having a system like the three steps I'm sharing with you and also training yourself to have the discipline to follow the rules of this system or this strategy. So, one of my challenges this um in these past 46 days, certainly being impatient and not waiting for the right entry and then also getting stubborn and holding losers too long. And it was 100% the result of being emotionally compromised.
In that moment, I was not following the rules of when to exit. I held, I hoped, and I got stubborn. And so no one is completely immune to this. Even after years of experience in the market, you could still find yourself getting stubborn. So that's very important. Respect your exit indicators. And it's far easier to do it when you're trading with smaller share size. These are the three clear exit indicators I had on my trade today.
Number one, red on the tape. So all this red, that was the burst of selling. Number two, we had a big seller that came in. I was already selling by that point. and we had the formation of a topping tail candle. And so I took my exit partial off the table up around 260, which was great. And then 230, 223, and 212 as it was coming back down. And that was the toppingtail candle that formed right there. It was the right decision to take some profit off the table.
Now, it went from about 280, back down to $2, then it goes up to 320, then back down to 240, then up to 360. And so for me, the way I trade is I want to get in and get out. Now, my entry here was actually on the 10-second chart, and it was in that little micro pullback. Now, of course, during this challenge, I was using Charles Schwab, and I would say that Charles Schwab is a decent broker, but they are not as fast as a direct access broker.
There's two different types of brokers in the United States. There's commissionfree brokers and there's direct access brokers. Commissionfree brokers use a wholesaler to route your orders. The wholesaler makes a profit on your order flow which allows and they pay some of that profit to the broker which is what allows you to have commission free trading. But in that relationship, the wholesaler filling your order on their own internal pool of shares unfortunately creates a little bit of latency.
And this was something that created a little bit of an emotional challenge with my small account challenge that I felt at times that I needed to be in a little ahead of the move because I was worried if I waited for confirmation I'd be behind. And when I had to get out, I was worried that if I wasn't selling early, I'd be selling into a big red candle. And so the limitations of the platform created some changes in the way I trade.
And I don't think that's really a good thing. I think it's better if you could trade on a platform that is so fast that you're not changing your style to accommodate a slightly slower broker. Other alternatives, unfortunately, would be a broker that charges commission. And that's the biggest downside. When you're doing a small account, you don't want to spend money on commissions. And the commissions can be hundreds of dollars a day potentially.
So, if you're trading in a small account and your goal is 200 a day, you want to keep as much of that as you can. So, my belief is that the small account um challenges are best at a commission-free broker. So, from $2,000 or less than that up to, you know, 25,000, 50,000, you know, maybe a h 100,000. But at a certain point, I find that the uh the limitations of the broker start creating issues where I can start to have diminishing returns.
Now, I don't know exactly where that line is. I don't it's not at 100,000 as we can see, but there's somewhere there's a line. It's already causing some issues. So, what I actually think is a good idea is trading with a commission free broker from $2,000 up to, you know, 50K or maybe a little higher and then at that point considering to switch to a um direct access broker like the one that I use, which is called Lightseed Trading.
So, I use Lightseed, which is a broker um that I've been using for more than a decade. And although they charge commissions, they allow me to enter and exit positions so quickly that during those really hot markets, I can be doing really fast trades and making some serious money that I wouldn't be able to do at Schwab or Weeble or any of the other commission free brokers. So, however, if you started here with a $2,000 account, then you're paying a disproportionate percentage of your profit in fees and commissions because the fees and commissions for most traders are $3 per trade per ticket.
So, it doesn't matter if you're doing a 100 shares, you're doing a,000. Um, and to be honest, once you're doing 10,000, it's it makes even more sense. But, if you're trading only a 100 or a,000 shares, speed may not be quite as big of a factor, arguably. So that's where this is sort of most appropriate for phase one and then into phase two scaling to a more sophisticated broker when you get there. Now an important lesson that I struggled with um during this challenge is knowing when to walk away.
There were a number of days where I stayed far longer than I should have. I should have just gotten out, called it a day, and I kept pushing it. So, it's important to know that on any particular day, if I give back half my profit, I need to walk. Because by giving back half my profit, I'm almost inevitably, invariably, emotionally compromised. I have to walk away. If I hit my max loss, accept that I've hit it and try again tomorrow.
If the window in terms of the time of day when I trade the best is closed, I got to stop. If there are no longer any Aquality setups, I've got to stop. If the theme of the day is bearish, it's just a weak day, a colder market, I've got to stop. And I do not want to come back after I've left, which means I have to stop watching because if I stop, if I keep watching on my phone the price action, I'll just get FOMO if something moves and then I'll try to come back, try to overcompensate, and I just usually end up making a mistake and making the bad day worse.
So, it was very clear that um I had a number of days where I didn't walk away soon enough um and I traded lower quality setups. And these were both um issues related to being emotionally compromised and being impatient or giving into FOMO. So, this is something that um I acknowledge I struggled with during the challenge and I continue to struggle with in my trading today. And you know, I could have capped all these losses at a much smaller amount, but I got stubborn. my emotions got the best of me.
Now, the recommended reading includes the two books I already suggested, thinking in bets and quit, the power of knowing when to walk away. But I would also add trade mindfully. And these three books all cover the topic of trading psychology, which is one of the most um one of the most important things to master after you've gotten down the basic, you know, mechanics of trading, understanding stock selection, entry points, and exit indicators.
Today is day 46 of the small account challenge and I locked up over $11,000 of profit which has pushed my account now up over $15,000. This has been an incredible challenge. I've been really grateful that we had such incredible momentum the last couple of days. Uh the account's now up over 5,000% from when I started on day one, maintaining 70% accuracy, which is a little above average. And uh the profit loss ratio around 1:1 was a little lower than I was hoping, but this has been a really good challenge.
And for those of you guys that want to continue studying and want to keep learning, I encourage you to download the PDF worksheets I've put together for you or check out the twoeek trial here at Warrior Trading where you can actually see what it's like trading in this community using this software every single day. So, I hope you join us. And remember, as always, when you guys hit the thumbs up, I'm adding an extra dollar to how much I'm donating to charity as part of this small account challenge series.
So, thank you for helping make this challenge possible. This has been so exciting. And now there's a big question of what happens next. So, leave your comments down below with what you'd like to see me do uh as I've now crossed this big milestone. Reminder, as always, trading is risky. My results are not typical and there's no guarantee you'll find success whether you trade with me or you learn on your own. So, please manage your risk and always practice in a simulator before putting real money online.
With that, I'll see you for the next episode real soon. And I'll be streaming bright and early tomorrow morning at 7
The words are the caption track's own and nothing is reworded or re-transcribed. Paragraph breaks are placed between sentences so the text reads as prose.
Use this transcript
Three free tools that work on the material around a video like this one. No signup, no login.
Hook Analyzer
Paste the first 30 seconds of your own draft for a hook score and rewrites.
Policy Pre-Flight
Check your draft against YouTube's advertiser-friendly guidelines before you record it.
Channel Skill Generator
Read this channel's public videos and transcripts, and download a writing brief for it.