Getting the transcript
Reading the captions from YouTube. A video nobody has opened here before takes 10 to 30 seconds; this page fills in on its own.
Getting the transcript
Reading the captions from YouTube. A video nobody has opened here before takes 10 to 30 seconds; this page fills in on its own.
IQCapital · @IQCapital_io
This video has no Most replayed graph yet: YouTube shows one only once a video has enough views. These are the moments viewers replayed most in IQCapital's most watched videos.
Most replayed moment at 40:02
87.2x that video's typical replay level
platforms out there. You got ATAS, you got deep charts, you have all these things available to you to go on replay mode to test things out, to kind of get the reps in. Um, but really, being a profitable trader uh doesn't really come down to that. What it comes down to more
Said at 39:54
The graph counts replays. It does not show where viewers stopped watching.
Words
17,180
Runtime
1:14:33
Speaking pace
230wpm
Reading time
72min
230 words per minute, above the 201 75th percentile of 349 measured videos. That distribution comes from the 349-video hook study.
Opening (first 30 seconds)
This is Mike Babayan aka Nitro Trades. At just 15, Mike dreamed of being a trader, financially free, traveling the world, and being his own boss. And after going through years of struggle and lessons, he actually figured it out. Now he's one of the youngest trading millionaires in the world. And yes, he brought proof, a lot of it. But what surprises me the most is he owes most of his success to a simple three candle strategy. And in this episode, he's breaking down that exact setup step by step so anyone can identify it. >> How much is this setup personally made you? >> So for me personally with this strategy, I've
115 words, the words spoken in the first 30 seconds at 230 words per minute.
Free, no signup. See how the first 30 seconds hold attention, with rewrites.
Sentence shape
| Measure | This transcript |
|---|---|
| Sentences | 1,419 |
| Average words per sentence | 12.1 |
| Longest sentence | 134 words |
| Questions asked | 321 |
| Sentences containing a number | 132 |
Most used terms
Filler phrases
545 in total: like 187 · right? 167 · uh 44 · kind of 32 · actually 28 · um 26 · you know 25 · literally 17 · I mean 15 · basically 4.
A literal whole-word count of the same phrase list the Prepublish browser extension uses, so a phrase inside another word is not counted and a phrase used in its ordinary sense still is. It is a count and not a judgement.
What this transcript is
Every word below is the caption track YouTube publishes for this video, pulled from the video itself and reproduced unchanged. It is not Prepublish's writing, not a summary, and not a re-transcription: it is the video's own published captions. English captions, generated automatically by YouTube, in the video’s original language. Source: the video on YouTube. A channel that would rather this page did not exist can ask for its removal through the contact page, and it is removed.
This is Mike Babayan aka Nitro Trades. At just 15, Mike dreamed of being a trader, financially free, traveling the world, and being his own boss. And after going through years of struggle and lessons, he actually figured it out. Now he's one of the youngest trading millionaires in the world. And yes, he brought proof, a lot of it. But what surprises me the most is he owes most of his success to a simple three candle strategy.
And in this episode, he's breaking down that exact setup step by step so anyone can identify it. >> How much is this setup personally made you? >> So for me personally with this strategy, I've reached about 350 to about like 400K 400K. >> Yeah. But the strategy runs on the idea that if we pick up buyers orders, we need to deliver it to somebody, right? We're not just going to hold on to them. We need to move to the sellers.
And if we're picking up sellers orders, we need to move over to the buyers. >> Mike uses higher time frame levels to establish direction, waits for a specific three candle CRT setup to form, then chooses between two entry variations. The direct break or a lower time frame re-break when the market calls for more confirmation. But what's most impressive is that he keeps his risk management obsessively consistent. If I play on the direct breakout, chance I'm I get stopped out because it's it's still a lot of selling pressure at these highs.
If I wait for that rebreak, I get the best possible entry. But the beauty of the strategy is it forces you to do a 1.5 risk-to-reward every single time. It doesn't have this weird situation where it's like, well, one trade I was risking like 3R and then the other one was 3.5R and so forth. No, we want to have a strict system, consistent every single day. In this episode, Mike breaks down the simple candle range theory strategy that helped him become one of the most successful traders in the industry.
Starting on the whiteboard first, then straight to the chart. Nothing in this video is financial advice. These are just the insights of a retail trader who actually broke through and found the success he dreamed of before he ever placed [music] his first trade. Now, let's see what Mike is made of. Mike, you've been trading for eight years. You've tried hundreds of strategies, and you're telling me what you're about to show is the best strategy in the game.
Why? >> Yeah, it absolutely is. Cuz like I said, I mean, I've been doing this since 2018. We're coming up on eight years now. And I've tried literally everything you can think of. I've traded different strategies. I've done everything. And there's nothing that like even comes close to the simplicity and the ease of learning to this strategy. Honestly, like nothing is even close to it at all. >> Yeah. Well, it's time to show me. >> Beautiful.
Let's do it. So, I'm gonna I'm gonna break down a little bit more in depth on the strategy today. So, I want to kind of break down the understanding of why it works number one and all these different things. So, the first thing we'll start off with is understanding um why the market even or how it even operates, right? The market is literally just an auction. It's literally imagine me and you are sitting here, right?
And we're in a situation where we're just trying to compete and see which of us can rip higher and which of us can uh rip lower. So constantly, if you really break it down to its core fundamentals, it's literally like, let's say you own a grocery store, right? In that grocery store, you got bananas. You're priced at $8. Someone's going to come in and be like, "Yo, why on earth is this price $8? I'm not paying that much.
I'll pay four." Right? And you're constantly just trying to find the balance of what's a fair price for something. Okay? So, and in order to understand this, there's two sections in the market. All right? Buyers. So, we'll have our buyers and we'll have our sellers. Now, we need to pick up orders for buyers. for example, in most cases, let's say at like a low or any key area in the market and we need to deliver that to sellers and vice versa.
If we pick up a bunch of selling orders, we need to pick up and deliver it back to our buyers. Okay? So, that's kind of what the strategy is going to run on, and we'll get into it in a second uh when I explain exactly what it is. But the strategy is runs on the idea that if we pick up buyers orders, we need to deliver it to somebody, right? We're not just going to hold on to them. We need to move to the sellers. And if we're picking up sellers orders, we need to move over to the buyers.
And it's just that constant constant cycle in the market that we can kind of use to understand where price wants to go every single day. Right? So that's number one. We have to understand that part. Now number two, the beauty of the strategy is the fact that in my opinion it is one of the simplest and easiest ways to become profitable. Right? After everything that I've really tested, it's beautiful because it provides a constant risk management and everything.
So the ease of being profitable, just write that out right there. Then we'll just put that. There we go. So, the ease of being profitable, and I'll explain why. Because with a lot of strategies, yes, you'll get the strategy. Sure, you got that down. But the big problem you're going to run into is, all right, what about my risk management? What about all the different issues in trading, right? Cuz people overtrade, people uh can't handle their emotions, people move their stop losses, and all these different things.
But the beauty of the strategies, it's not just strategy. It's literally the whole system in one. It literally puts the idea of what the market's going to do with the fact of the matter that price is essentially in order to be profitable long term. If your risk management is off by even a little bit, you can have the best strategy on this planet. You can have a 90% win rate. You're not going to be profitable, >> right?
So, this is what I did. I optimized it to essentially have the ability to say, look, prop firms need you to be consistent 24/7. They if you mess up even a little bit, you're done, right? Even on a regular account, you mess up one day. Like, literally, I've been profitable for six years. I've been trading for eight, but six has been profitable. If I mess up bad one day, I can wipe out everything. You know what I mean?
And a lot of people don't realize that they have they do great for a month or two and whatever and then they just wipe things out. So, the ease of profitability is the big thing with the strategy. It genuinely is. And we're going to get into that with all the risk management and uh everything that goes into it and fixing honestly what everybody struggles with. Like I said, the overtrading and uh all those big things all in one.
Okay, so that's the big thing right there. And then the last thing we really want to talk about with uh the strategy is essentially the fact of the matter that the strategy doesn't really have anything complicated. It's a strategy that you can literally watch a video, hop on the charts tomorrow, and literally understand and see that exact same setup any anytime. >> How long did it take you to build this? >> So, I've been trading the setup since 2023.
But the thing is to make it to the point where I'm at like right now with the risk management everything because I initially I was just showing the strategy and then I realized people are messing up on the actual things that matter. So I built out the entire system over 3 years to essentially be the perfect all-in-one package to literally pass your props and whatever you need. >> Okay. >> Yeah. So now if we really take a look at the last thing a little bit far right there but you can come over here.
But uh the last thing we really want to talk about with the strategy that I'm going to cover is the scalability, >> right? And this is another big thing that we really want to cover because scalability when it comes to trading is all that really matters. Okay, what essentially happens is how do you go from 5K a month to 10K to 20 to 30 to 40? Because a lot of you guys can get to maybe 5K and just sit at 5K forever. But how do you go from 5 to 50 to 100 and so forth, right?
Because again, my whole big thing has been trading has a lot of fluctuations, right? And a lot of people lose their mind. They see 40k month and then you might have like a 5k month and then a 60 and then a 10 and so forth. But that's where this comes in and it just says, you know what, trust the process throughout the end of the year. I don't worry about one week or one day or whatever. I worry about 6 months, 12 months, 24 months.
That's what really matters to me. So, we're going to cover the auction. We'll cover the ease of profitability and then we'll go straight into scalability and showing you how you can actually lock the system in and then scale to whatever you need to. >> Just to be clear, this is an all-in-one system. You're saying there's no information that you'll leave out of this that a trader would have to figure out on their own. >> No, there you literally watch this by the end of this video, you'll have literally to the tea an entire system. >> Okay, >> beautiful.
So, let's go ahead and talk about what the actual setup itself is. So, let's draw that out real quick. and get into it. So the setup is going to be a very simple idea, right? Each candle that we really have is going to look like this. This you have the wicks, you have the candle itself, and then you have another wick to usually the opposite, right? And in the market you have a lot of different looking setups, but in general, the idea is we're simply just going on one of three time frames, which is going to be the 1 hour, okay, the 30 minute, or the 15-inut, okay?
And you can do it. There's certain ways you can set it up. So if you're on Trading View, you can have it all on one screen. There's like a free indicator called ICT Htf candles and you can uh just put them all on one screen. So that's one way that you can do that. >> Now Mike, why specifically these three time frames though? >> So these are the ones that are most commonly used, right? In terms of intraday moves because this strategy is for intraday, right?
It's not necessarily for swing trading. can technically do it for swing trading but the ones with the most bulk orders will be the 1 hour 30 minute and 15 right >> what do you mean by bulk orders though >> so the areas where like for example if I look on the hourly time frame this one candle has so much action packed into one if I look at the 1 minute one little one minute candle is nothing you know what I mean it doesn't really tell me too much but the 1 hour the 30 and the 15 the intervals of 15 that we really have are essentially where we're packed in with so much orders on one candle that it's really significant right so if if a high gets swept on this 1 hour time frame.
That's such a significant level being swept because this is a whole hour of data you're talking about, >> right? These are extreme highs and lows in the market that we're really seeing. >> Mike, just to be clear, too, real quick. So, for these three time frames, did you figure out these three are the best through experience, through testing, through theory? >> Yeah, I have tested out other time frames like 2 hour, 4 hour, you know, some like 10 minute and so forth.
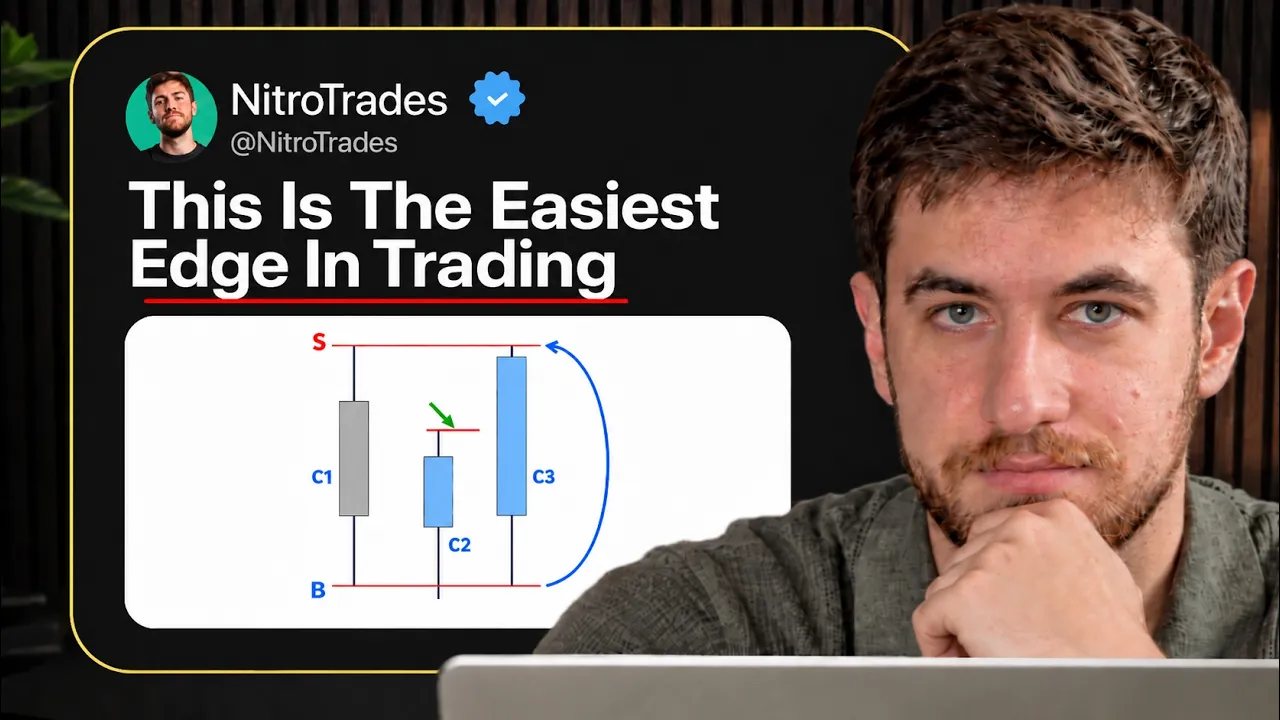
But what I've really found is that the highest win rates you're really going to get is going to be through the 1530 and one, right? Does that mean you can't use the other ones? No. But it just means that the best results will come from these three essentially. Okay. So, let's really understand something real quick with the strategy. So, let's say we're on the 1 hour time frame right now. Okay. There's three candles for this sequence.
There's going to be C1, which is candle number one that we're going to have first initially. And all I'm doing for this one is very simply just doing one thing. Mark out the extreme high and the extreme low. That's all I'm doing. All right. So from wick to wick. Just mark that out. Do absolutely nothing else. Okay. And let's say this candle is a let's just mark it out. This is a red candle. Let's just color that in a little bit.
Okay. So let's say that's a red candle. We come back to our idea of what the auction is, right? What does this essentially mean? There is buyers sitting at this low and this is tons of buyers sitting at this low, right? And we have a bunch of sellers that are sitting at this high. So what do we understand? If we have a situation where the buyers are there, we would pick up those orders, the market would then have to what?
Deliver it to the sellers. Correct? So, this is where candle number two comes in. With candle number two, what I want to see is for price to come and break the low, okay? Or the high. It doesn't matter which direction it is really, but we want to see that price comes in and sweeps that low right there, but the actual body of the candle closes back above the low. Okay? and it closes back inside that range between the high and the low.
Does make sense? >> So now this is what candle number two will look like. Let's say this one is a green candle. We obviously don't have green, but let's just color it as a blue. What do we understand now? If we just picked up those buyers orders essentially this is candle number two. Let me also mark that out for us so we understand that. This is candle number two. What do I expect to happen on candle number three? If we just picked up all these buyers orders essentially what I expect delivered to the sellers, right?
Okay. So, I'm expecting a full reversal to complete this and come to our sellers right here. Okay. >> You know, Mike, this is extremely interesting. I want to unpack what exactly you mean by deliver it to the sellers. So, what just happened is >> all these limit order buys just got swept is what you're saying. >> Absolutely. Yeah. So, let's let's put in perspective like this. Another example that I can really give, right?
Let's say you're a delivery driver. Okay. As a delivery driver, you go to the base, you pick up your deliveries. Okay, but if I'm just staying at the same place I am, I'm not delivering to anybody, then what's the point of me doing that, right? Same thing goes into the market. If I pick up my orders, I need to find out where I can find my sellers at, right? If price wants to move higher, it's going to go directly to this level and complete it where the rest of the sellers are sitting, right?
Because the market has these strong limit orders sitting at these key lows and key highs. So the idea behind it is essentially if we rejected hard off this range, I can expect more sellers that are sitting there, right? And price wants to push and give those sellers what they want, give them their order. Does that make sense? So that's the idea behind it. Now, does that mean that it's always going to do that? No. Cuz there are situations where the candle will come in and then it will break and it will close way lower.
The body of the candle closes way lower. That means the buyers were not strong enough to come and deliver it to the sellers. The sellers were in control. They said, "Screw it. You're not doing anything. We're we're just going to keep dumping right there. Make sense? >> Yeah. >> Okay. So now candle number three will make a reversal essentially like this. Okay. And uh it will deliver to these sellers itself. Now this is where our biggest focus is going to be.
Candle number two and candle number three. Candle number two once we have the fact that it swept and it closed back inside the range. We understand that. Great. Candle number three is the one that actually delivers. Okay. Where does the entry come in now? Because, okay, do I enter here? Do I enter here? Wherever. The way that I enter the trade is when price comes in and it breaks candle number two's high right over here.
Okay? So, the moment candle number three breaks candle number two, two's high is where you will look to enter the trade. Okay? And we'll get a little bit more in depth into that. So, that is all the setup essentially is though, right? >> Okay. >> And that is going to basically be that same three candle sequence that you see practically every day. and it's going to function almost every single and again after after this video is really like people watch it they can go back and back test it and see like yeah you're seeing this formation play out every single day and it's really crazy >> well Mike I have to ask why specifically when it breaks the high why is that an important event >> so with trading I I trade on a lot based on uh confirmation right essentially how do I know that we genuinely have that much strength yes we see that candle number two has that strength don't get me wrong but how do I genuinely confirm that there is enough strength to actually break above the previous high and continue higher.
Right? So my idea is essentially if the last area where we had a bunch of sellers was let's say there's a price range. Okay, let's say this is 30K right here. This is 29 and this is 295. What essentially I see is okay we tested 295 on the last hourly candle and we rejected. So sellers are there. They're ready to go. But now we just came back and tested it again and we took all those sellers that were at 295, we picked up their orders and we're gone.
So that's why candle number three's confirmation comes in and says, you know what, we cleared it and we are good to go to our next level which is right over here. Make sense? >> Yep. So, and there's more to unpack and I'll try to get into edge cases here later, but this formation looks like it could happen quite frequently. Yeah. >> So, is there a filtration method that you have here with this? Absolutely. >> Because I feel like this could definitely get overtraded and you wrote overt trading over here too.
So, >> uh, if you want to unpack that later, we can, but >> that would be my question right now. >> Absolutely. Yeah, we'll cover that in a second as well because the setup does show up, I want to say like 15 times a day, 10 times a day, whatever it is, right? But >> the way I go about it is the highest quality one that you'll ever find is usually the first one of the day in the New York session, right? Or depending on which session you're trading.
But let's say if you're doing New York, and there's two sessions I really do trade for this, or three occasionally. Uh, New York will be 9:30 a.m. Eastern time. Wrote that wrong. 9:30 to about like 12:00 p.m. Okay. So, that will be the New York session. So, A.M. right here. And then 12:00 p.m. is where we kind of cut off for the day. If I don't see anything until 12:00, I'm good to go. Now, Asian session, which is the evening session, is going to be around 8 to 10:00 p.m.
Eastern time. Okay? And again, during that time is when I start looking whatever the first one forms. So, let's say we open and the market forms the CRT at 9:40, for example, right? Then I'll take it and I'll be done, right? Or maybe if you're taking two, that's your setup. But the worst case scenario you'll see me take is like two trades realistically. I don't try to go too too much over that. There's some cases where you might go into three if it's like crazy, but usually it's going to be one to two trades a day because the more you fire at the market, the more you're exposing yourself to risk, right?
I want to catch that one or two clean moves of the day and just call it and just whatever I'm at. >> And just to be clear, so you said in these time ranges through these sessions, this is when the setup is most applicable. >> Yeah, 100%. >> Why these? >> So, the most volume in the market is usually going to be around this range, right? Because most people usually trade the market open until around like an hour or two in, right?
After that comes in lunch hour. After that comes in the market just like nobody's really sticking around all day trading, right? So the volume starts dying off crazy. >> So the best followthrough that you will see we need volume for a push like this. We genuinely do because if we don't then there's no sellers, there's no buyers and what are we what are we really doing here? >> So that's why the best volume will come in from market open until about like a little bit midway of the day.
And and then outside of these sessions, yeah, >> the setup doesn't work as well. >> It does. It does. So you can also do London session which is going to be like uh towards the night. But the issue with that is then you come across two problems. Number one, the volume is absolutely going to be way lower, right? But number two, when do I stop? Then I can go for New York, then I can go for Asian, then I can go for London.
So I say you just choose one or two of them and just call it a day. But it will be a little lower quality than New York is, right? if you're trading London session or whatever it may be. >> Okay. >> A little bit. >> Please continue. >> Yeah. So, absolutely. So, now let's talk about how do I know where I'm taking the entry? We already got that part figured out on the breakout, right? Where do I actually take my profits and where do I take my stop loss?
So, the beauty of the system is we get rid of the risk management aspect, right? So, essentially the way I enter it is for example, let's say I enter the trade right here. Let me draw this out for us. So, if I enter on the break, the first thing I will do is I will drag my takerit. So, I know I'm going to take profits exactly at that high. I'm not taking it midway here, here, here. I don't care. This is where a lot of people mess up because you see a little bit of green and I think almost everybody watching this video can really under has done this at least a few times.
You see a little bit of green and you're like, "Oh my goodness, if I don't sell right now, I'm screwed. Like, I'm going to lose." Right? So, you end up selling your position right here. Okay? What you don't realize is, okay, if you do that over time, you take a little bit of green, a little bit of green, little bit of green, $200 win, another $200 win, and then when you take a loss, all of a sudden you're talking like a minus,000 loss, right?
And that's where you guys really mess up. And a lot of people don't catch that ever. They just think, "Wow, but if I didn't sell the position, it would have came back down, right?" So, what the strategy does is it forces you to say, "Listen, if it's not hitting exactly at this high, okay, absolutely nothing else matters. I don't care what you're thinking. I don't care what you're seeing. If you're not hitting that TP, then you do absolutely nothing. >> So, there is nothing that can make you close early or change your idea to okay, maybe I'm wrong. >> No, even if I see it, because the thing is while I'm in a trade, I can give myself a million reasons why I think the trade won't work and I can give myself a million reasons why it will work.
Right? So, both of those ideas are there. Okay? And if you really let that get to your head, then okay, you can mess up every single trade you have. Even if it's super clean, even if it's a super messy setup, just let it do its thing. >> That's the big thing. And the beauty of the strategy is it's a very high it's a really high win rate, right? So, >> what win rate? >> It's about 70 to 80. >> What riskreward? >> 1.5. >> It's quite exceptional. >> It is.
It is. That's why that's why it's one of the best ones, right? We can really find cuz in trading, you really have either a really high win rate >> and a low RR, which which is kind of what this is. >> It's a symbiotic relationship. Yeah. >> Either you have it's one of the two, right? So, I chose the win rate because I don't want to watch my trades go like out of every 10 trades I'm losing eight of them, but I also have like a 10R.
Like, not my type of thing, you know? So, even if you're wrong on the one or two setups, who cares because the rest of them will get the follow through. You'll have a pretty high win rate with the strategy. >> So, take profit part is simple, right? We know wherever you are from uh candle two to candle number three, we just take the entry and let it ride, right? >> What about stop-loss? Now, this is the big thing that people don't understand.
So, with the stop-loss, it's essentially going to look like this. Okay, when you are dragging your takeprofit, it's not necessarily based on a monetary uh kind of or like an actual level, price level. Because the issue is, let's say, where where am I going to really base my stop loss off of? It's a different every single time. But the beauty of the strategy is it forces you to do a 1.5 risk-to-reward every single time.
It doesn't have this weird situation where it's like, well, one trade I was risking like 3R and then the other one was 3.5R and so forth. No, we want to have a strict system consistent every single day. So, what I will do after I figure out my TP is I will drag my stop loss using the uh riskreward tool until I see that it is a 1.5 R for every single trade. Now, the stop-loss part you can play around with a little bit if you want to, but the best way to do it is like this to essentially know that your risk management never gets messed up.
Okay? >> Right? And again, that's just the thing of it. It's not a necessarily like price level that we're basing it off of. We're just basing it off the fact, hey, if price has this much range to get to the highs, then we'll give it about 1.5 of that to get to the lows. >> Okay, make >> sense. >> Yeah. So why why specifically though target is level based? Yeah. >> Right. And >> stop isn't level based. Now you want to achieve a specific RR, but what made you figure out >> this is the best version of this strategy? >> So after all the testing I've really done, I've tried two and two is too tight, right? one is a little too loose.
It doesn't give you too much range to really play with, but 1.5 just meets in the middle perfectly, right? Some people have done 1.3 because there's a lot of people that trade my strategy out there that do like 1.1 or 1.2, whatever. That works. I just find the perfect medium of everything. The best results that I've gotten have been at a 1.5. >> Okay, if that makes sense. >> It there's no market structure or context where you change this rule. for instance, stop is up here above the low of the C1 or oh, it's down here on the next trade or oh, it's below this, you know, very important low or none of this matters.
Just stick to the 1.5. >> So, in most cases, yes, the only time you'll see me really adjust it is let's say if the range is like super tight, for example, like let's say if the candle's high was right here, >> right? >> And it's like a super tight range. I'll say, you know what, let me give that a little extra room of like 1.3 instead of 1.5. But that's very rare for me to do because what I'm doing is I'm messing around with my riskreward.
Now >> the loss would be a little more than I would usually want to see and so forth, right? And the same idea goes for prop firms that we always talk about because if you're doing 1.5R, usually the other way to do it is have a consistent dollar amount, right? So let's say every single trade I aim for, let's say like $700. I don't know which profit account people have per se, but let's say you have a 50k account. What people will essentially do is you'll go for something consistent again, right?
So, if you want to focus on the monetary value versus just the number, >> yeah, >> per se, >> you can essentially do $700 win per trade minus $500, $400 loss, whatever you want to do for that side. And that again is a beautiful way to go about it for your prop firms, right? >> Okay. Yeah. >> Yeah. And the one thing that people need to understand is 1.5R is different every single time. Maybe 1.5R is like, I don't know, the high is right here.
So this looks like I don't know crazy crazy range. >> So you just have to adjust it. Maybe for this one I'd have to do like eight contracts to meet my goal of $700 and $500 loss. >> Mhm. >> And for this one I'd have to do like two because it's a much wider range. Right. So that's that's where we have like a little bit of um >> things to focus on. >> And it's just really plays out perfectly when you really put it together. >> And Mike, there's a ton of stuff that we'll go over on the chart as well when we get in there, more practical questions.
But I did want to ask specifically for this setup and maybe you're going to get into it later. So if you are just tell me but that first candle I cannot get it out of my mind how >> how do we know I know traders are going to look at the chart with this setup >> and see it everywhere. How do we know when that first candle forms? Okay, this setup just potentially started. Now let's wait for C2C3. Yeah, >> you know what I mean?
So, candle one itself really doesn't have much. So, I'll put something in perspective essentially if I move over a little bit here. >> Um, let's say this is our session open. This is 9:30 a.m. Eastern time. Okay. So, this is 9:30 a.m. Eastern time. And for candle one, I'm not essentially focused on anything. But what I'm doing is let's say this is candle number one right here. Let me draw it out of black actually. So, let's say this is candle number one right over here.
And what I'm doing is I see it. Okay. I'll just mark out the high and the low. This is the first candle. Let's say for example what I'll wait now is for candle number two to come in and see what the reaction is. Let's say candle number two comes in and just dumps the body of the candle just closes below the low whatever. There's no setup there. >> Yeah. >> Cool. So then what we'll do is we'll move on to candle number two that right here.
And this now becomes our candle number one. >> Yep. >> Does that make sense? >> Mhm. And then all of a sudden on candle number two, that that initial one of the day, what happens is this one gets swept, right? So then now I can think about a CRT. So candle number one, I'm just essentially moving it over and over and over >> until I see the setup start forming on candle number two. >> Does that make sense? >> So each candle, we just move the next one.
If this does nothing as well, then we just move on to the next one and so forth for the day. >> Edge case wise though, Mike, let's say candle number one here is really small. Yeah. But this setup actually fulfills itself. Yeah. >> Inside a very narrow range candles uh three three-piece sequence. >> Yeah. >> Is this still eligible? >> So that was actually the trade that I took today which we'll take a look at in a second.
But it's eligible but you need to be a lot more careful with that because what happens is with these super tight ranges like essentially if it looks like this where it's like okay here's your candle, here's your high low. Next candle I don't know does this like for example and the range is literally just this much right? like this is very tight. The issue is this one's a lot more riskier cuz essentially the issue you're running into is like one little tick can stop you out. >> Maybe before it gets TP, your 1.5 from here to here is like this small, >> right? >> So, it's still eligible and you'll still see me play it and that we'll get into in a second with how we play the second entry method for CRT.
We'll talk about that in a second. >> Yeah. >> Um, so it's actually it's a good point that you brought up so I can actually talk about that which is the way higher win rate to trade the strategy. So the first one we talked about is just like okay breaks hop in that's easy that's simple. The second way I enter the trade is something called a rebreak. So we talked about the 1 hour 30 minute and 15. So we got that down.
Where does the lower time frame come in play? The 1 minute because that is where I spend most of my time. I'm always on the one minute time frame. So let's understand why and how that comes into play. So what you'll see me do a lot of times is if I actually let me just clear these ones so we have a little bit more room. Mhm. >> But um what you'll see me do a lot with my CRT specifically is place something called a rebreak, right?
So it's kind of in the name. You can probably already like tell what the idea behind it is. >> Mhm. >> Um but with a rebreak, essentially it's going to look something like this. Let's say this is the higher time frame setup. Okay. And you've got whatever price sweeps the low and then you've got the next setup coming in right there. Nice. And then let's mark out our high and low. So this is our setup on the higher time frame.
Let's say this is a 30 minute just for any example. So again what I will look for in this situation on the lower time frame is not to enter on the direct break the moment it breaks. If it's especially if it's a tighter range you'll see me do something different. I'll wait for price to break the first time around. So let's say this is now the one minute time frame right here one minute. Okay on the one minute let's say whatever you got your little push.
This is your high and low whatever whatever whatever and then your CRT and so forth. So, let's say this is your CRT low and this is going to be the high that we're targeting, right? This is going to be the middle uh midpoint where we actually entered the trade for candle number two and mark that out real quick. Instead of entering on the first break, if it's a tight range, I'll wait for price to break it, pull back >> and then on the second time it comes up to that midpoint again, that's when I enter. >> Why?
Why spec? Why is that sequence important? Why is that confirmation? Why why how did you figure out that works? Essentially, the reason behind this is there could still be a bunch of sellers sitting here that I don't see. >> Right? So, what I want to do is I want to wait for price to come and take out the rest of those selling orders, pull back, and then the second time it rips up, there's not as many sellers that were sitting there as the first time initially had. >> Okay? >> Does that make sense?
So, I want to clear that out the way. And this will give you a way higher win rate when trading the setup. The issue is that what if it doesn't pull back? What if it just gone? Yeah. >> Right. So you will miss a lot more setups, but I think with the highest win rate that you can get is going to be definitely using the rebreak with without a doubt. But both one both of them are fine. No problem. >> What is the win rate of the rebreak? >> This is the one that you have to use if you want to get to those 80 or 70 like very high 70% >> with the same RR. >> Same exact RR, >> but you get less trades. >> Yeah, less trades.
You do miss a lot of very clean, beautiful setups, >> but at the same time, you're taking the highest quality setups. You know what I mean? But there's some that you will miss for sure. >> Just to clarify for anyone who missed this, >> this system can work on the 15, 30, or 1 hour. >> Absolutely. Yeah. >> So, it's not multi-time frame in a sense. You're just saying this these are the time frames where it's applicable. >> Yeah.
So, the idea behind it is essentially um I look for where it forms first. So, if I'm if I'm looking at all three time frames and I see that the 15-minute formed first, let's say the first CRT of the day, >> that's the one I put. Does that make sense? Mhm. >> If the 30 minutes is the one that formed it first, that's the one I play. If the 1 hour formed first, that's the one I play. But essentially, that's kind of the way it goes is I watch which one of these three time frames.
It has to be on one of these three, but I don't care which one it is. I just care that it's going to be which one's the first one. >> Okay, makes >> sense. Well, do you have any advice for someone? Is there any idiosyncrasies in this setup across those three time frames that someone should be aware of or is this just going to perfectly replicate itself without any minor deviation across all three of these time frames?
So, they all kind of operate the same. I'll be honest. Um, there isn't anything crazy. It's just the 1 hour time frame itself is probably the hardest one because this one takes a lot longer to play out, right? Because, okay, this one candle is a whole hour of trading. Mhm. >> So there's situations where let's say candle number three itself just comes up until here and then the fourth candle after that is the one that gets to move.
Right? So it's not always going to be candle number three that gets directly to TP on things like the 1 hour. It might take two or three candles or whatever it is. Right? But you enter your trade and just let that thing whatever happens. You can literally walk away from the screen, come back later and see what happened. >> Now that's the only thing to be careful with. This is not going to be quick usually on the 1 hour time frame.
It will take a little bit longer like maybe three or four candles versus 15 which usually just hits. Okay, >> that's the only difference that I would say, but they all have almost the same exact. >> Which one's easiest? >> 15, no doubt. Because the 15 is pretty quick moves, pretty small, smaller ranges, not anything too crazy. I would say 15 is the one that would really help out the most. >> Which one's the best for prop trading? >> That's a good one.
I think 30 minute would provide you with some of the best riskreward to be honest because uh there are situations that we did talk about where 1.5 is obviously the kind of like the general idea >> but 30 minute I've found is the like let's say if the CRT kind of forms here um let's say this is where your low is and essentially if instead of placing my stop loss all the way down like here which is no reason it's already breaking the candle number two low >> sometimes with the 30 minute you can kind of go like for example right under the low and that would give you like a five R for example, right?
But it's not something that I really recommend people worry about until they get way more advanced. So, I won't really break it down too much so it doesn't get confusing. But I would say 30 and 15 are going to be the best ones for passing your props. >> Okay, understood. And if everyone under if everyone actually understood everything you just said, which you explained it very coherently, so they should, but if everyone understood what you just said and they still failed with this setup, what would probably be the reason? >> So there's a lot of things that it can be wrong.
So for example, a lot of it usually is, like I said, the overtrading, right? Where you're just firing at something for the sake of firing. Um, another thing is that you don't necessarily understand the actual setup, right? because I know a lot of people um do comment on my post sometimes like, "Dude, how did this one not work?" And they show me the setup. I'm like, "What am I looking at?" Like, "This is not the setup at all." So, that could be another big thing.
But another one is there's days where the market just isn't clean. For example, no news Mondays and all these different things. You open up the market, you see it's a mess, and people just for the sake of firing just fire at it, right? And you're going to lower your win rate by a ton. Your riskreward is going to get screwed over. It's it's not really beneficial. So that's one little piece of advice I'll give is if you see the market sucks, you see it's not moving clean, like every candle, let's say, is just looking like massive wick, tiny body wick, another one comes in, same exact thing and same exact thing.
Why? It's not really worth it. You can always come back tomorrow and just do the same thing, right? >> So two questions then. News you had mentioned, would this ever prevent you from taking this setup? >> Um, 100%. Yeah. Yeah. So, if I go to a day and I see that it's like a Monday, for example, Mondays are the days that I usually skip because they're notorious for just not having too much movement, right? >> And for me, usually any day that doesn't have news is one that I'm kind of hesitant on trading in general, right?
So, let's say it's a Wednesday and one week it has news, like bunch of red folder news, but the next week the Wednesday has literally nothing. I go into that Wednesday with the mindset, okay, if the price action is also moving bad on top of that, just come back Thursday. It's not that middle. >> Well, Mike, you've been trading a long time. You have a trained eye, but a lot of people who will be watching will not be anywhere near as advanced.
How can they know price action sucks? Don't touch this. >> So, that's where the lower time frames come into play, right? to like the 1 minute. And this is something that does take a lot of time to really pick up on, but the general idea of it is if I open up the one minute time frame, okay? And I see we just got a massive green candle. Bang, we're good to go. Right? Next candle comes in, massive red candle, and then you're right back up all of a sudden.
Massive green candle, right? Or you have another type of price action that sucks, right? Which is you get a massive push, but it wicks like crazy. Okay? And then we reject, and then you wick to the downside as well. Okay? Then you get the next push, and then you wick again. these two, one of these two, if you see this during the day, that is not normal. If price is really that strong and you get a massive green candle, you're going to continue ripping.
You're going to continue pushing higher and higher and higher, right? Yes, you'll have pullbacks. That will make sense, sure, but it should never be massive green candle, massive red, massive green, massive red. That should never happen. That's a sign of chop. Same thing over here. If you're really that strong, okay, in this case, for example, you push, you wicked, okay, you're weak. You come in and you get this weird wick to the downside.
Okay. So, you're not weak, you're not strong. Which one is it? Then you come in, you push, and then you wick again. All right. Now, it's kind of obvious that we're just going to chop around. >> So, you're saying the word chop. So, just to be clear, this setup is not as compatible with a choppy market environment. >> Absolutely not. No, because you do need followthrough, right? In order to get the delivery of those orders, you need price to actually move, right?
There's quite a bit of a range to really cover. So, if you're just moving sideways the whole entire day, how do we expect to get this push all the way higher? Right? So, this not going to be this is going to be when you find the lowest quality setups, right? And a lot of people might have like one day or two days that they know sucks and then they shoot like seven like tries at it on that specific day cuz they're frustrated.
They're like, "Damn, why did this one not work? The next one should work, right?" And they keep firing and firing, but nothing's going to work that day. Yeah. >> They're just firing. >> So, then Mike, uh, just to be clear as well, is there any rule? You had just mentioned here one way to distinguish chop. >> Is there any simple rule that you could pass other than this? Are you just identifying chop based on your experience? >> It's mainly off experience, but I think if you really see the exact candle uh thing and again when we hop on charts later, I'll show you specifically because today was a really good example of that uh where the the movement was just off.
Right. One more little thing I'll tell you is if we're constantly breaking highs and lows of days, like for example, this is the high. Okay, this is the low and we're just trading in between that, right? And every single time what happens is I break the high, fail. Okay, I come down to the lows, fail, and so forth. That's another that's not as significant, I'll be honest, as these two. This one's just like it's just showing that there isn't too much fall through.
That's fine still. But the big focus is massive red and green candles back to back every single time for about two hours. That is disgusting. Same thing over here. Massive wicks to both directions with zero movement to either one. Absolutely disgusting. So, these are the unacceptable ones. Like, you see this, call it a day. This one's like whatever. Like, it's just maybe sometimes we'll skip it. >> Okay. Mike, one more question I have about this, too.
And if you don't mind, I'll I'll take a marker. >> So, this is the long setup. Yeah. >> The short setup would just be if >> basically it happens in inverse where candle 2 sweeps the high, closes back within And then your candle three is um where you would take your short when it breaks the low here. Yeah. Right. >> So, exact same thing just flipped. >> Okay. And we'll see that on the chart. Right. Now, let's say for the long setup, >> price is doing this. >> Yeah. >> Just falling.
And the long setup forms what looks to be at the bottom. >> Mhm. >> Of an absolute falling knife relative to the volatility of the session. Yeah. >> Are you still taking this? Ever thought about getting into prop trading? Perfect timing. Right now, we have the perfect offer for you. You can grab a futures challenge or crypto challenge for just 9 bucks. Links in the description below. Now, back to the video. >> That's a wonderful question cuz that's what I wanted to actually get into right now, which is a biggest part of the strategy is all right, market opens.
It's amazing that perfect timing on that. Um, well, what if I have one that forms to the upside and one to the downside? Which which one do I play? Right. So, this is where another key thing comes in. Let me kind of clear these off the things. >> Yeah, you can clear my little >> Oh, you're good. >> Whatever that is. >> Get these ones off. But, uh, essentially the idea is something called bias and trend, right? So, if I'm looking and the market's on just straight straight selling pressure. >> I try to long that thing.
Probably going to get destroyed. >> Yeah. >> Right. Because the market is just in seller territory. Now, what I do is based on the same idea for what we were talking about with sweeps over here on higher time frame. But let's say this is the 1 hour time frame with price just moving higher and lower and then same thing across the board, right? So what I'm doing is let's say there's a CRT setup here. What I'm essentially doing is if it sweeps a low or something along those lines, then I'll play it, right?
So for example, price comes in and it takes out the hourly low and then bang, we start seeing some buying pressure picked up here, then I can go for a long one. >> Oh, okay. Yeah. So, this one definitely I need to slow down on. Now, >> just to be clear, inside of this is the three candle CRT. This is all the three candle CRT right here. >> No, no, no. So, this is basically, let's say, uh 1 hour time frame, >> but I'm not necessarily using this one for CRT right now. >> What I'm looking for is these key highs and lows in the market to understand direction.
Okay, that that's all I'm interested in. Right? So, CRT for now, nothing. But let's say this is, I don't know, a 1 hour uh time frame that I'm looking at, and there's a 15-minute CRT that forms in here. Here, I'm not playing anything because essentially we're just in a massive downtrend, and there's a long CRT, but there's no level that price has picked up buying orders to show me that it wants to continue higher. So, this whole entire time before we take out this low right here, I don't care.
There's only bearish CRTs that I'll put, right? But after we come in and take out the previous low, reverse back up and I see like let's say a 15-minute CRT here, now I'm okay to play. >> Right? So now if I see a 15-minute CRT, I can understand that we can have some more room to the highs. Same thing goes over here. We come into the highs and I see it breaks and then boom, just starts dumping. What direction will I be interested in?
Only shorts. I don't really care for longs if price takes out these highs and fails. >> Mhm. Okay. >> Yeah. Yeah, Mike, I understand. I just feel like this would be very difficult for someone to see what we just did and be and have it click in their head and be able to follow it. >> Yeah. >> You know, >> I mean, I'll put it like in a little bit of a simpler like explanation cuz for me it's like when you have it like already locked in, it's like uh you're explaining fast, right?
So, it's like >> because I understand what you're saying. I'm just thinking, okay, if someone wanted to turn that into a rule set and start applying it, are they getting >> is it clear enough? >> Yeah. So, the exact path to really go into this is every single morning, let's say this is you wake up, right? Mhm. >> First thing I will ever do is go on the higher time frame. So higher time frame will be number one. Okay.
Higher time frame 1 hour, 2, 4, whatever you want to use. For me, it's always personally 1 hour, right? I open up that chart and all I'm doing simply is let's say again we have our levels, lows, highs, whatever. This is all getting figured out in the market. So, all I'll do number one is simply just mark out my lows, my very extreme swing lows and extreme swing highs and so forth. That's all I'm really marking out at the moment.
Okay? And then what happens is I watch for what price has done. So, I'm watching right now, as of right now, we're just making lower highs every single time, struggling with highs, and we're in a uh downtrend. Okay? So, I'm watching number one, which direction the market is moving. If we're failing at the highs every single time, we're just making lower highs and everything. only a bearish setup. >> I don't care for a long right now.
But then the moment we come in and we take out a low right over here and we reverse back up, >> then I start thinking now we've shifted a little bit. Now we just picked up those same buy orders. So it's essentially if you put into perspective what the CRT model is itself is also exact same thing I'm looking for because the market again >> runs on this entire auction idea, right? This is going to apply to everything essentially.
It doesn't have to just be our little setup that we have here, but it's the exact same idea. We came and pick up those orders. So, I understand that the market probably wants to make a move a little bit higher, right? And that is where I start looking and say, you know what, now I can start looking for a 15-minut or 30 minute or 1 hour CRT, then I'm good to go. Right? The obviously easy way to play it, which is not going to give you the highest result, which is probably going to give you like a 60 65% win rate, which is still not bad at all, but you could just take the first one in general of the day, right?
But if you want to get your highest highest win rate that you can, it's going to be that rebreak I mentioned and using your higher time frame levels, right? So, a lot of people will get confused and if you do get confused, don't worry. Take your time at first. Just trade the first one only until you get more advanced. But to achieve the best possible setup that you really can has to be this way, >> okay? And you can show us an example of this then on the chart later. >> Yeah, absolutely.
I took a trade with this exact same uh >> because this will make it way easier. >> Awesome. So yeah, please continue then if >> Yeah, but that's pretty much it. So if you really break it down, I mean, we just packed unpacked a lot of information right there. But if you really break it down to its core concept, there really isn't too much that we really uh cover with the strat. You have your setup, great. You have your riskreward consistent every single day.
You have your overt trading down, wonderful. What else is really left? If you get your higher time frame levels down as well, that makes you a way better trader at the setup. The rest of it is just optimized for passing prop firms. being profitable is just as perfect as you can really get. But simple and you also have your times that we talked about. Everything else is good. >> How much has this setup personally made you? >> So for me personally with this strategy, I've reached about 350 to about like 400K. >> 350 400K with this setup over how much time? >> Over about two and a half years that I've been really trading it like consist not really too consistently.
This year has been the one that I've been focused like heavily >> on it because I'm always an options trader and a futures trader, right? So, my main goal this whole time had been to get my options numbers up and then now that I've started dialing in on futures, that's when we've really been focusing. So, >> so, so this is good on uh US traditional futures, ES, NASDAQ, the minis. >> Yeah. Yeah. So, it'll be on uh MEES that I trade or ES, whichever one you want to do.
NQ and um MGC is another one that I really trade often. Those are the big ones. >> Where does it work best? >> Um I would say NQ is the one that gives the most folder. So, NQ is number one. I'll put yes number two and then number three will be right here. >> Gold. I hate gold. >> Gold is a disgusting one for sure. Yeah. >> So Mike, this is one of the best strategies then that you used to help you become a millionaire trader. >> Yeah, 100%.
No doubt it's up there. >> And I think we still have to talk about scalability, right? >> So this is the big one that we really want to talk about because the beauty of it is that it's the same fundamental, right? and you're just building on that fundamental over and over again, which is more sizing, more accounts, more copy trading, and all that stuff. So, essentially what you guys want to do in order to get the best kind of scalability that you can out of this, let me just clear these off the screen real quick so we can uh draw that out.
But I'll explain kind of like you guys know me, for example, if you're watching this video and you haven't heard of me. I do two things. Number one is options, right? We always talked about and also futures. And the same idea applies to everything. my option strategy itself too. All I did was get my system down, my risk management, everything and then I got from 10K to 50 to 100 and now trying to go for 200, right? But the system itself should stay the same.
I've never changed anything in my actual option system ever in my life. Right? Same with futures. Once I got that strategy down, what you want to do is, for example, prop firms, if you have prop firms for this, start at one account. Okay? Just get to your first payout. That's number one. Let's just get to our first payout. pass your first eval, do everything, then you can go to two accounts, then you can go to three and so forth.
And you you can just infinitely scale this. Then you get on to a live account. Same idea. You get on and you can add more sizing over and over and over again, right? But the eventual goal with futures would be to have 20 or however many accounts you want to have and take that same setup every single day, make $1,000 on, let's say, one of the accounts, copy that over to 20, you're talking 20K. And the riskreward obviously with those prop firms is insanity.
How many people in the world are doing 20k days and all that? Not a lot realistically, right? >> So that's the beauty of it. The foundation is down, >> right? There's nothing you ever touch ever again with the strategy or your risk management or anything. The only thing you do now is get down to perfecting the strategy for yourself, right? Obviously, because you need to actually do it in the live markets. As much as I show it, you need to actually get in there and like see it.
For example, you can watch 5 million videos on how to shoot a basketball, but if you don't go in there and actually get repetition and shots in, you're not going to know how to do it yourself. >> And just to be clear, how does someone know they're improving with this system, though? >> The biggest way is obviously if you journal and you keep track of your stats and you'll see month by month because I'm going to be honest with you, a lot of people will watch this.
First week or two are probably be like tough to like kind of spot it and be like, "Oh, where is it? Where what am I looking at?" Right? But um if you journal over time, you'll notice your stats get cleaner. You're overall getting less trades in all these different things because easier said than done is obviously a much you know it's a really big thing because I can tell you don't overtrade but you're still probably going to do it if you're newer, right?
I can tell you don't uh FOMO into setups. You're still going to do it. So it's all these things like that that take time and you will notice whenever you get better at holding your trade completely through and through, right? Whenever you see that your numbers are the same across every day. If you open up your calendar and you take a look like you'll see for example with me, I don't have any days, for example, where it's like if I made 3K today, right, I I usually don't have a day where I come in and I'm like minus 8K, right?
It's either going to be a decent win or it's a loss because again, I'm not doing any sell halfway or anything like that. Straight TP or straight stop loss and every day is the same repeatable numbers. Make sense? So, it's usually it's going to be like that. And when you notice that a lot of people have like 4K win, 5K win, so forth, but a minus 20k loss one day, that's where you get screwed over, right? And that's when you notice you're improving when none of that shows up.
You don't have 20 trades on your chart. You don't have all these different things. >> Okay? >> Make sense? >> Yeah. >> It's the biggest thing right there. So that scalability again is keep this core foundation. So essentially for the rest of your life, no matter what market condition we get into, whatever happens, this will stay with you for the rest of your life. >> How does someone know they're ready to scale up to an additional account? >> Yeah.
So I usually say once you get your first payout or your second one, if you really want to be sure, once you've done it one time, you have the systems to do it again because nothing's really going to change. Maybe the market conditions are a little worse, whatever, but if you follow your system through and through, you're going to be profitable using your um system in place, right? That's the that's very likely that you can possibly pull off a uh essentially you'll be able to have a good chance of really getting profitable if you follow your system through and through, right?
So, with that, if I see I got two payouts here, great. Right? Then I can move on to getting two accounts. Now, you don't want to do like one account straight to 20. Obviously, that's that's insane. What I want to do is one to two, two to three to four, whatever it is. And slowly, if I'm doing well on two or three, I'll give you an idea, for example, with my options, too. Uh, with options, what I did was like 2023, I was at like 10k sizing per trade.
And I noticed I was like, okay, I'm having really consistent months, three months in a row. Let's go up to 15. And then from 15 went up to 20 and so forth. And I'm just seeing if I'm constantly able to do the same thing on the same size and I'm comfortable with it, move a little higher. and move a little bit more higher next time and so forth. And now I'm sitting around the 50k range, right? If I see I'm comfortable around 50k for the next three months, I'll move easily to 60 or 65, whatever it is. >> See how I'm doing.
And >> and so just to be clear then also, Mike, you had mentioned explicitly a 70 to 80% win rate or an 85% win rate with the rebreak system. Yeah. Yeah. >> So, if someone's trading this pattern, this setup, and they have a lower win rate, does that mean they're not doing something right or they have to give it more time? How can someone have confidence that they should keep going with this setup even if the numbers you gave me earlier aren't exactly being met immediately?
So, a lot of people do ask me that, but it depends on a lot of things because it's like, okay, maybe some months it's a little lower because you have some months that it might get up to 90, you have some months might go down to 60. It just depends on the movement as well. Number two, um you're obviously not going to go crazy and hit like 80% if you're just trading, right? There's a lot of things to learn. There's a lot of things to filter out and see what works and what doesn't.
But you can watch, for example, even if you search up the setup like anywhere, you'll literally see all the people talking about it. They're averaging that 70 to 80%. But these people have been doing the setup every single day for months and years, right? So if you're just getting into it and you're like, uh, how am I at like 60 or 50 and then someone else is at like 70? I mean, regardless, even if you were at 50, you're still deeply profitable at some point.
But even then, you just need to tweak little things. It's just a difference between like out of 10 trades, one or two, right? So that's what I really tell people is I've personally like and me and like thousands of people like really trade the setup and we love it and we have that same exact stat. If you're messing up somewhere, sit down, journal it, figure out what is it that's really stopping me. What did everybody else do this day with the setup?
Watch the charts. Maybe it was the direction you're reading in correctly. Maybe it was very choppy. There's little components that can make a very big difference. They just got to really get under control, which takes months, weeks, depends on each person. >> And you'll be able to show maybe some examples of these little components or common failures when we get on the chart. >> 100%. >> Oh, are you ready to go to the chart? >> I'm ready to go.
Yeah. >> Let's go to the charts. Mike, it's time to focus on the pragmatic. I want to see some setups where this works. Maybe one where it failed and then look at some of the edge cases or extreme conditions that might make beginners mess up or question the setup and try to clarify them if possible. >> Beautiful. So yeah, so as we talked about earlier, uh the first thing I will show you is obviously where the setup is present.
Right? So again on my chart, I have the three time frames. You can see 1530 and 1 all figured out right there. Now you see on the hourly time frame, bang, we have a CRT right over there. That's the first one that we really have that formed for the day. And very simple setup, right? Again, you have candle number one, you have candle number two, and then once candle number two closes, obviously candle number three will come in.
But before I even do anything with the setup, how do I know that I'm playing this bullish setup and not something to the downside here or here? Right? So, let's figure that part out. First, we go on the hourly time frame. And notice this whole time on MNQ, it's been dumping non-stop. It's just been dump dump dump. Whatever. If it would have came and broken this low and reversed immediately back up, okay, then at that point, I would have thought, let's play maybe longs all the way up here.
But since it didn't, it broke through it and it kept dumping, dumping, dumping. >> This whole time has been bearish CRTs, just bearish to the downside. >> Now, what happens is, >> and real quick, why that low though specifically? I mean, there's a low here, there's a low here, here. All these could break and do the same thing. So, why that one? >> So, we want to play the isolated one specifically, which is like if it's packed with a bunch of lows like this, like one here, one here, one here, one here, one, whatever.
I go for the most extreme one. So in this case, the lowest of the low that we really have is right over here. Correct? >> Could you technically count any of these lows if it comes in and it reacts to any of these? You could in theory look at it, but the most significant level will be the extreme low and the extreme highs. But the way I usually go about it, you can mix in these lows as well. You just have to wait and see what price reacts to.
So for example, right here, if it comes in and sweeps this one, right, you can play a bullish CRT in this little area that we're at, but the overall trend is still messy, right? still kind of mixed where it's like it's bearish, but we did sweep a low, so it's it's a little tricky. It's a little bit a lot to unpack, but when we take a look at the examples, >> okay, >> it'll uh make more sense. But first thing that you'll see right here is what happens.
We took out this hourly low right over here, right? It broke and bang, we are right back up. So, how come I'm looking to play a bullish CRT? I'm not interested in anything to the downside, right? Because this is one of those tricky cases where if you look at the previous candle, do you see how there was a one to the downside right before it? Mhm. >> Right before this long setup. And this is where people get messed up because they look at it and they're like, "Well, technically we're coming down the whole entire time." But great, we just took out the hourly low, so it's no longer me interested in the downside setup angle. >> Yeah. >> Does that kind of make sense? >> Yep. >> So, people would have maybe played this one to the downside and taken a loss, but I waited.
I looked at the higher time frame and then when we go over onto the uh lower time frame here, then I can worry about, hey, now let's watch for the setup and play. Okay. So, we have that figured out, right? The higher time frame was the number one thing we start off with. I take a look and I see, okay, we just took out a key level. Great. We got that out of the way. I understand my direction. So, number one, we find direction.
And now we're going to now we're going to actually look at the setup itself. So, what do I do now? I'm going to take the look at this high. Okay, here's the takerit on this. And here is the uh stop loss. So, drag it up until this becomes a 1.5. Okay, so around that range. 1.48 is also fine. It's not like that. But um the idea behind it is you place your levels, okay? And when it breaks, again, remember the two ways to enter the trade. >> If I play on the direct breakout, chance I'm I get stopped out because it's it's still a lot of selling pressure at these highs.
If I wait for that rebreak, I get the best possible entry, but there's also a chance that I don't get that rebreak. It just rips right away to TP. >> So, let's take a look at what happens on this one specifically. We're watching this candle come up up until the CRT right here and then we'll go from there. So, let's use the example of let's say you enter on the direct breakout. Okay? For example, uh where is it? Let me get one more candle to get it a little more exact if I can. >> And let me ask this too, Mike.
Obviously, we're getting in on a direct breakout of candle 2's high. >> Yeah. >> Is this on a stop market order or are you just getting in on a market order right when it ticks above? So, I place my order. So, essentially what I'll do is I'll place a stop limit, not a market. Yeah. >> So, it'll be stop limit and then TP and everything is already set at the same exact time. So, there's nothing to really worry about. But this is what we were talking about with that rebreak, right?
Because you would have taken the break on this high of day breakout. >> And notice how it comes back down. >> Yeah. >> But what I do is I wait, let it do that initial break and whatever. The second time we come back around, stop limit order is already set. We're good to go. So, let's say when it breaks that middle point again, great. Great. I mean, right now it's on bar replay, so it's hard to kind of show the exact numbers, per se, but the second time it comes in and breaks.
Now, I'll take my entry. >> Okay? And all you're doing is literally take profit is set, stop loss is set, make sure your numbers are adjusted properly. Like, for example, if it's um you know, you're aiming for $700 win and so forth, >> consistent across every single trade, >> right? >> So, now you just let it do its thing. And just to be crystal clear about the rebreak here. So it's not actually oh the next candle comes back in.
It's actually all in the same bar breaks above [clears throat] intraar comes back down and then breaks above again. All in the same bar. >> Yeah it can sometimes be on the next one if you want to but in 99% of cases it essentially is going to look like this. Like this one broke the high on the one minute. Next candle didn't do anything. Next one dropped and then the fourth candle. So that's a 4-minute that's all happening in four minutes.
Right. The hourly candle itself still has like another 56 minutes to go while this is all happening. Right? Okay. So, that's kind of what it is. I wait for price to pull back deep hard, right? And then I go for the rebreak when it comes back and takes it out. Make sense? At this point on, okay, you're up $200. What do you do? Absolutely nothing, right? You let it do its thing. Continue again. Absolutely nothing. Continue again.
Continue until bang. Get whatever it is. >> Nice. >> Okay. And that's just it's really simple in practice where you really just take a look at the higher time frame, get your bias down, right? Some people do mess up on that point, but you know, it's not really too complicated if you really practice. >> Well then, Mike, I have to ask though. So the rebreak worked here, but the break would have stopped out. >> Yeah. Yeah. >> How should someone know this one is eligible for the break, not weight or you know what, let me do the rebreak on this one.
How does someone know to distinguish between which one is better for the current situation? So, there's two ways to think about it. Number one, you could essentially say, I want to trade one of them and that's it. Like, I only do re-reak or I only do direct break >> and you say with rebreak, I risk missing some setups, but I also get the best quality setups. The other way to know is if you look throughout the entire day today on this specific day, notice the size of each candle, right?
So, you'll get a massive green, massive dump, and then you get this wick right here. So, it's it's a little bit that chop that we were talking about. It's not as extreme because there is actually follow through, but the size of the candles is crazy and all these wicks are also crazy. So, I take a look at that. I'm like, listen, this is a pretty tight range. It can come and stop me out easily. So, I'll wait. I know I can see that almost after every single candle that we had this day, there's rejection with a massive red, red, and then another green and red.
So, I say in this kind of case, if it was just like green, green, green since the morning, the market opens up and it's just been ripping like crazy, whole different story. I'm like, you know what? We're fine. you know, let's just play the direct break. But in this case, I see that the candles are very aggressive, very volatile. They're very dangerous here. So, what I'm doing is saying, you know what, >> I'm almost guaranteed it's going to pull back because I've seen every single candle prior has been massive red, massive green, massive red, massive green.
So, that's what kind of puts into my head that, hey, I'm going to go rebreak instead of direct. >> No. Well, if you had to transfer that knowledge to someone new, though, is there like an easy rule or something that they should follow? >> I would say it's not necessarily easy. As much as I'd love to say that, you know, the setup itself is like simple, but there's little like price action understandings and things like that that you need to pick up on yourself, but the general rule of thumb is just judge how aggressively the candles are moving because every single day is different, right?
Some days you'll have these crazy candles. Some days you have like clean, nice moving candles. There's not anything crazy, but you need to judge based on the movement. These aggressive candles where it's like this much of a shop up and then right back down and then right back up. Very dangerous. And think about in your CRT, okay? If it breaks that, what am I kind of expecting there? A pretty aggressive rejection because I've been seeing that all day >> and that will stop me out if I take the direct break. >> But the second time around, it'll basically mean like, hey, we had sellers there.
The buyers still held us up, so we're strong enough to continue pushing. >> Make sense? >> Yep. Got it. >> It's the idea behind it. Okay. So, that's one example. Uh let's take a look at another one to really get a better idea as well here. So, again, start off on your higher time frame. That's always going to be number one. Um, this one is a little bit of like a weirder situation because what we see here is every time price has came in and took out these highs, failed first time, right?
Taps the high, back down. All right, great. Price comes in, taps the high, back down immediately, right? Comes in and breaks the high again. It hovers around a little bit because the session that it broke it in is a slow session. >> Yeah. >> Right. That's the one thing that people need to understand is okay, >> this London session doesn't have too many big moves to get that instant rejection, but essentially broke out the high and failed again.
Right? So, in this case, I see it's struggling with these highs. I want to play a bearish setup. I don't want to go for long. >> Right? So, a lot of people did go for a long setup here that also played out if you see this 1 hour one right here. >> Mhm. >> But if you go over to the bearish, that's the one that I have my eyes on. Right? So, now what we're going to do is look at this 1 hour time frame. It's forming again that same exact setup but to the opposite end.
Okay, mark out your high and go ahead and mark out your low. Let's just do that real quick. So, we mark that out. And now what I'm waiting for is candle number one, we already got that out of the way. High and low. Candle number two broke. And I need to make sure that candle number two closes the body of the candle underneath the high. So, let's see if it can do that. Okay, so we're going. We're going. We're going. So far, nothing.
Okay, so you see how the candle actually closed underneath. The body's underneath. What is candle number three going to do? I'm expecting a full U-shaped reversal all the way down to these lows. Where will your entry come in? Right, let's talk about this situation right here. We have your TP. So, you you'll enter on the midpoint break right here. Your TP is the first thing you figure out. The other part of it, drag your stop loss until you get to about 1.5, right over here.
Okay. Now, what you'll do is you'll wait for that breakdown. Again, you have the options of doing a rebreak or you have the options of going for direct break. And let's see. In this case, we'll calculate a rebreak. All right. Again, so you'll see the idea. Okay. So, you got your push reverse back up. So, if I can get a little bit more or possibly if it rejects directly off this, I'm good to go. We'll see because it is looking pretty weak.
So, this is one thing that I look for before my entries as well, which is a very advanced idea. The way the price action leads up to the break, like for example, here, candle tries to go green, flips to red, right? try tries to go green, flips to red. Tries to go green, flips to red. That's enough for me to be like, "Hey, I think this is pretty decent enough, right? So, let's try a direct break and a rebreak. Let's see what the differences are between the two and how they look." Again, same exact thing.
Place your stop loss, place your TP. The rest of it does not matter. So, let's see what happens in this situation. Okay, so far, let me add this in. Let's see what happens. Okay, same exact idea. You get your follow through down to a low. I don't care if it runs 5 million% after this or 5,000 points. >> I don't care halfway through taking profits. Like, this is where a lot of people get scared is because, okay, they see a little bit of sideways movement and they're like, "Oh, what if I don't sell right now?" But always remember, >> the whole point of the setup is to force that risk-to-reward, right?
If you don't force a risk-to-reward, then you'll have maybe $200 profit here, 150 there, or whatever, and then you take a loss and you're taking a minus. >> Yeah. And that's never going to work, right? >> And I want to show one more example. This is a trade that I took on Thursday that actually didn't work. And this was a beautiful setup in my eyes. But this is the reason why because no strategy will ever be 100%. You can have the best strategy in the game and it you will still have some that fail, right? >> This is the best strategy in the game, right? >> Yeah.
Absolutely. Yeah. [laughter] So you can have this and you're still going to fail, right? But >> okay, >> the idea behind it is >> we had that hourly low sweep, right, from what we had previously. So, for now, I'm still bullish on the overall time frame, right? Setup looks great. Everything looks great. I come over to the 15-minut time frame, first one of the day. Everything looks wonderful. Okay. And if you really take a look at what happens right over here, well, there we go.
You really take a look at what happens on the setup, right? It looks perfect. I mean, everything's aligning properly for me. My my trend is good. Everything is good. Now, it's just a matter of waiting for your break and go from there. Okay, so this is one of those tricky situations because people see these types of trades and they're like, "Ah, this is why I should have sold before whatever." So, let's see what happens here.
Let's say we take our entry on, I don't know, rebreak or whatever you want to go for here. Let's say direct break. Setup looks wonderful. Everything's aligning properly and looks good. Now, look what happens here. Okay, price starts getting these wild candles. Looks decent. looks great, but eventually what happens is price was just not strong enough to get that follow through and we ended up getting stop loss, right? >> Totally normal, totally part of the game.
There's absolutely nothing that's wrong with it. It's just that even the best strategy, right, this let's say >> you're still going to lose like two or three out of your 10 trades. Yeah. >> And these are going to be the two or three out of the 10 that will be a mess, right? So, it's all part of the game. I take some of these trades, even if you try playing the downside one, this day specifically was just not getting follow.
That's normal. But in general, I will say if you just take the best setups that you possibly can, there's nothing more I can really ask for to really, you know, >> Mike, I do I do have a question then and it's something I should have asked like an hour ago, but >> that third candle, >> if it doesn't break the high to take the long or the low to take the short, >> is the setup over? >> Yeah, it's over. So, this is where some people get confused cuz sometimes the third candle will not do it, but the fourth one will come in. >> But now we're done.
Like honestly, it's already it's already struggling too hard. It feels strong and the photo came and took it out on the third candle. >> Mhm. >> Cuz it still works, sure. But it's just like not going to be high quality. And I love only playing high quality. You know what I mean? >> So that's where the issue really comes in. But >> and then just to also be clear, once you're in the trade, however many candles it takes to hit a target or stop doesn't matter.
Stay in. >> Never close prematurely. uh if it requires you to close your screen and go do whatever you need to do, do your thing. But once you're in, you're in. There's only two directions it can go, nothing else. >> And if you were going to improve this strategy, what would you do? So, that's one thing I'm really working on right now, which is possibly trying to kind of understand um which certain types of price action would perform best with it because I do kind of have an understanding of like, hey, this this price action doesn't work well because of this or whatever, but I want to go more in depth and understand how can I understand that there's too much selling pressure like this situation prior to actually entering the trade.
Right? So, this one looked great until we realized that the sellers are packed there and we just couldn't push through. Right? That's one thing I'm working on right now and understanding u once I do get that down that'll probably make a little bit more of a difference but honestly the setup is already as high win rate as it really can get like there's it's not too much move room to really play with. So what's what's the biggest weak point would you say? >> The biggest weak point I think for everybody is identifying the higher time frame levels, right?
Because a lot of people when they mess up is they read that higher time frame totally incorrectly. Like they don't go on the higher time frame and look and say, "Hey, we took out a low here and we reversed hard. So I'm looking for a bullish setup." They don't do that. They essentially just come in and they're like, "Well, let me just fire at this one right here and then let me fire at this one right here and let me fire one right here, one here." That trend and that bias honestly makes the biggest difference.
Do you do you think you could show me an example of how to read the higher time frame correctly? >> Million% we can. So if we go on for example in this exact scenario, right? What the first thing I'll do is mark out these areas where I see extreme rejections. Okay, to both directions. So massive rejection. This was the last point that we had before price had this massive dump right over here. This is where price got a crazy pivot to highs.
Wonderful. These are the strongest levels. If you go over here as well, you had another one. You're ripping. You were ripping. You're ripping. And then you tap this high right here. And all of a sudden, look how much we dropped. We dropped almost a thousand points, right? >> Same idea goes for this. So, if I continue, continue, continue. For example, we take out this high and we fail. What does that mean? Bear CRT, right?
Uh, let me get that there. So, that's the beauty of that, right? So, a lot of people don't look at these levels and then what happens is you're like, wait, I tried going long. I thought we were I thought we were strong. I thought we were pushing higher. But notice almost every single time that we really come to these levels, price starts struggling and having these tough times. So that's the big thing. So now if price comes over and takes out this high, this whole time I'll be bullish until it takes that and then it reverses back down. >> So then to be clear, how what is the criteria for a level to have been taken?
You know what I mean? >> Yeah. So same idea. I want to see price come and break it. Okay. But has to reverse. Same way the kind of setup itself works where it must break it and then bang just reject that level hard. That's the biggest thing for me. So, for example, in this case at these lows, notice how price breaks it the first time. It's not really a crazy reversal. So, I'm still like whatever. I'm iffy on it. Again, not really crazy, but this fourth candle really solidifies that, hey, we just got a ton of buyers sitting at this low, right?
Same thing over here. This is kind of like this first candle is like whatever broken and wicked, not that crazy, but that crazy rejection kind of starts solidifying and so forth. So if I have seen a bearish CRT there, I probably would have played that one even though it kind of started reversing higher. >> Yeah. >> So that's kind of the idea behind it is essentially I want to see the break. I want to see something that proves to me that buyers are actually there or sellers are actually there and that will be my bias. >> So another quick question then when the level does break though.
So if this level breaks and I point at the screen like everyone can see but they can't. But if this level breaks where yeah where your mouse is, >> how do we know? Do you have a specific criteria where you say okay this level it got broken resistance is done >> anything like that and just to give you an example condition let's say two full candle closes above maybe that's the way someone quantifies it do you have a method like that >> yeah so essentially once it's already gone like for example in this case broke it the first time didn't get the craziest rejection second time it comes and breaks one two three four five candles level's gone honestly honestly that's that's the way I look about it if if it holds like one or two fullbodied candles above, level's gone. >> Okay. >> Honestly, in my eyes, you know what I mean? >> Um, but it's not like set in stone, per se.
It's just like if I if I even got that and I got this crazy dump afterwards, >> Mhm. >> I'd still be fine with it. But in general, the idea is if we break it and it just keeps pushing pushing pushing like for hours, I'm done with that. So would you say then you characterize direction or the >> we can say the longer term trend or drift is better based on how price reacted at the most recent key level. >> Yeah. Yeah. Absolutely.
Because those recent key levels the more fresh those orders are. So essentially it's like okay someone's got an order from I don't know how long ago most likely that order is not necessarily sitting there anymore. I mean like let's say it's a large order that pushed the market down. Doesn't mean that that order is still sitting there but this one's fresh right? All right. So, if he did a few hours ago, that order could still be sitting there. >> Yeah. >> So, that's why I look at that.
Um, so the idea behind it is essentially, look, these areas will have the strongest reactions in the market because where do people place their orders? At these highs and these lows. Nobody's really trying to place their orders in the middle of nowhere, >> right? They're looking for these extreme points so they can get their limit orders filled and their buy orders filled. And that's why we base it off those levels. Does that make sense? >> Yeah.
Okay. Well, is there anything else that I might have missed that really that you're hiding from me or? >> No, nothing that I'm really thinking of off the top of my head because I think the setup is so simple really that it's just not much to really go deep into. But it's all really trial and error. I would say like for everybody that's watching it, I would say just go and test it out yourself, right? The charts are open.
Test it out and see how often does it play out. What works best? What doesn't work best? What's best for my prop firm or my account or whatever it is, right? But in general, the setup itself is the core of it. The risk management is the core of it. If you have that down, the rest of it, play around as much as you want. Just don't touch the setup itself. Or that's actual risk management and the rules that you need to follow.
The rest of it, play around. See, this works best for me. This doesn't. Maybe it works great for me, but for somebody else, they like a different way. That's the only thing I would really say. Rest is pretty simple. >> Oh, Mike, I I think that's pretty much it. >> Yeah. Yeah, I think. >> Hey, we're both from California. How why are we doing this interview in Dubai? >> Crazy, right? We I met up with him and I was like, "Hey, I heard the accent." I was like, "You're from California, aren't you?" [laughter] >> From the US. >> I don't know why we're here, but here we are.
Um, >> okay, Mike, thank you so much, man. I really appreciate it. Thanks for having me on. >> Seriously. Of course. Absolutely. >> IQ Capital, you can start your first challenge for as little as $9. Terms and conditions apply. Check the link in the description below for more details. Built by traders for traders.
The words are the caption track's own and nothing is reworded or re-transcribed. Paragraph breaks are placed between sentences so the text reads as prose.
Free tools for your own script. No signup, no login.
Paste your draft and see where viewers are likely to drop off, with a rewrite for each weak line.
Paste the first 30 seconds of your own draft for a hook score and rewrites.
Check your draft against YouTube's advertiser-friendly guidelines before you record it.
Read this channel's public videos and transcripts, and download a writing brief for it.