Getting the transcript
Reading the captions from YouTube. A video nobody has opened here before takes 10 to 30 seconds; this page fills in on its own.
Getting the transcript
Reading the captions from YouTube. A video nobody has opened here before takes 10 to 30 seconds; this page fills in on its own.
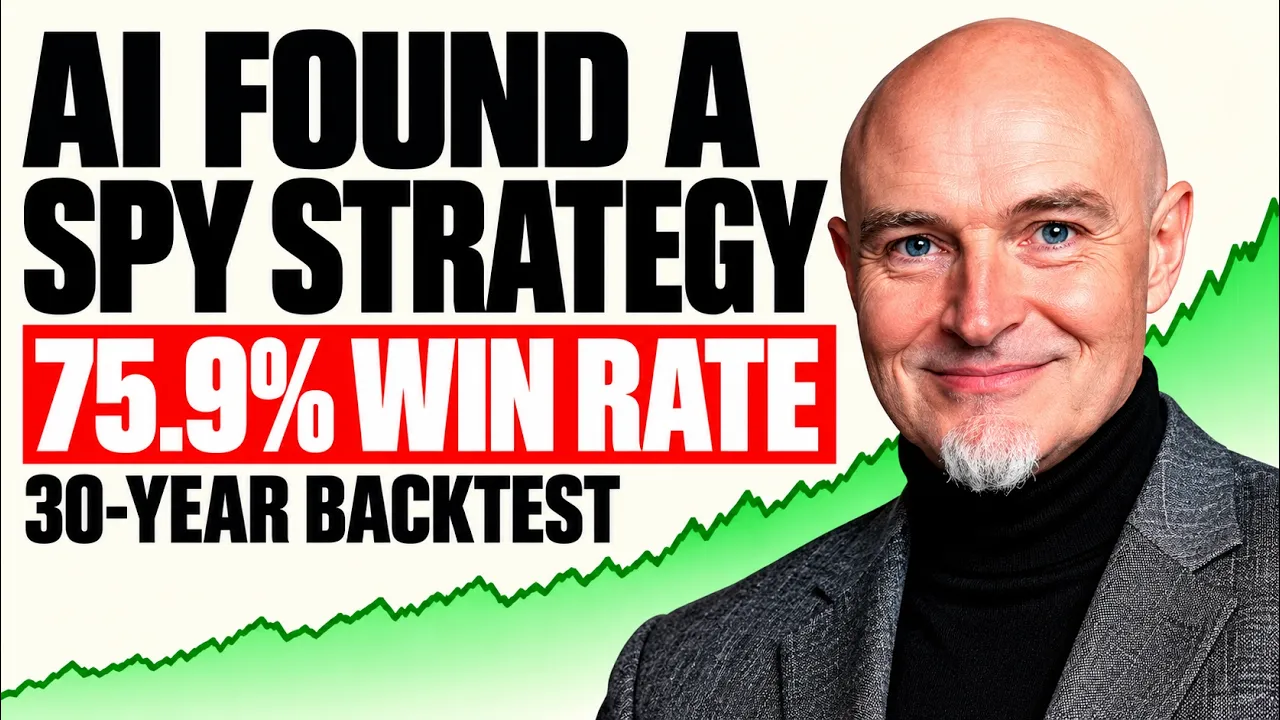
Quantified Strategies · @QuantifiedStrategies
Words
523
Runtime
3:45
Speaking pace
139wpm
Reading time
2min
139 words per minute, below the 160 25th percentile of 349 measured videos. That distribution comes from the 349-video hook study.
Opening (first 30 seconds)
AI found a profitable SPY strategy in 30 seconds, then we tried to break it. The rules were intentionally simple. SPY above its 200-day moving average, RSI 3 below 20 by next open, and exit after a rebound. I wanted to be fair to the idea, so we froze those rules before touching the later data. No tuning after the fact. At first, it looked excellent. 253 trades, 75.9% winners,
70 words, the words spoken in the first 30 seconds at 139 words per minute.
Free, no signup. See how the first 30 seconds hold attention, with rewrites.
Sentence shape
| Measure | This transcript |
|---|---|
| Sentences | 54 |
| Average words per sentence | 9.7 |
| Longest sentence | 24 words |
| Questions asked | 1 |
| Sentences containing a number | 14 |
Most used terms
Filler phrases
6 in total: like 4 · actually 1 · kind of 1.
A literal whole-word count of the same phrase list the Prepublish browser extension uses, so a phrase inside another word is not counted and a phrase used in its ordinary sense still is. It is a count and not a judgement.
Run the check on the words above: where attention is likely to drop, with a rewrite for each weak line. The free check shows the scores and the one issue costing the most.
What this transcript is
Every word below is the caption track YouTube publishes for this video, pulled from the video itself and reproduced unchanged. It is not Prepublish's writing, not a summary, and not a re-transcription: it is the video's own published captions. English captions, generated automatically by YouTube, in the video’s original language. Source: the video on YouTube. A channel that would rather this page did not exist can ask for its removal through the contact page, and it is removed.
No Script X-ray for this video: YouTube shows a Most replayed graph only once a video has enough views.
AI found a profitable SPY strategy in 30 seconds, then we tried to break it. The rules were intentionally simple. SPY above its 200-day moving average, RSI 3 below 20 by next open, and exit after a rebound. I wanted to be fair to the idea, so we froze those rules before touching the later data. No tuning after the fact. At first, it looked excellent. 253 trades, 75.9% winners, a 2.60 profit factor, and an average trade of 0.60% $10,000 compounded across the closed trades grew to roughly 44,000.
But, the pretty equity curve was not the point. The real test was what happened next. First, we split the history. From 1993 through 2014, profit factor was 2.93. From 2015 onward, it dropped to 2.18. That is weaker, but still solid across 104 trades. I actually like seeing some deterioration here. Perfect validation would make me more suspicious, not less. This is a retrospective holdout, not a live test. Next came the overfitting test I care about most.
We changed the RSI length and the entry threshold. All 20 nearby combinations remained profitable. Some were better, some worse, and the strongest cells had fewer trades. But, there was no single magic setting holding the whole strategy together. The profitable area was broad. We also moved the trend filter from 150 to 250 days. The full sample profit factor stayed between 2.58 and 2.73, and the later period stayed above two.
Again, no cliff around the original 200-day setting. That is what you want to see from a simple rule. Then, we changed the exit completely. One day, three days, five days, 10 days, 21 days, and the original rebound exit. Every version stayed profitable. The original exit was best, but the other exits still worked. That suggests the entry condition itself may contain a real historical tendency rather than the result depending on one clever exit.
Then we deliberately made execution worse. At 10 basis points of round trip friction, profit factor was still 2.25. Even at 20 basis points, it was 1.94. For SPY, that is a deliberately harsh stress test. Costs hurt the result as they should, but they did not erase it. Finally, we split the test into four market eras. The weakest was 2010 to 2019 with a profit factor of 1.85. That is the number I care about here. It tells us the full result was not created by one lucky decade.
The strategy was not equally strong everywhere, but every major period remained profitable. So, did the AI strategy survive? Under these tests, yes, but not perfectly. Later data was weaker. Costs reduced the edge. Some periods were mediocre. That is exactly why I find the result interesting. It looks less like a perfect back test and more like something that deserves further research. AI can generate ideas incredibly fast.
The difficult part is still deciding which ideas deserve any trust. Historical tendency, not a forecast. If you like this kind of rule-based research, you are very welcome to join our school community, rule-based trading. We publish one new strategy every day. The link is school.com/rulebasedtrading.
The words are the caption track's own and nothing is reworded or re-transcribed. Paragraph breaks are placed between sentences so the text reads as prose.
Free tools for your own script: paste a draft and see where it stands before you record it.
Paste your draft and see where viewers are likely to drop off, with a rewrite for each weak line.
Paste the first 30 seconds of your own draft for a hook score and rewrites.
Check your draft against YouTube's advertiser-friendly guidelines before you record it.
Read this channel's public videos and transcripts, and download a writing brief for it.