Getting the transcript
Reading the captions from YouTube. A video nobody has opened here before takes 10 to 30 seconds; this page fills in on its own.
Getting the transcript
Reading the captions from YouTube. A video nobody has opened here before takes 10 to 30 seconds; this page fills in on its own.
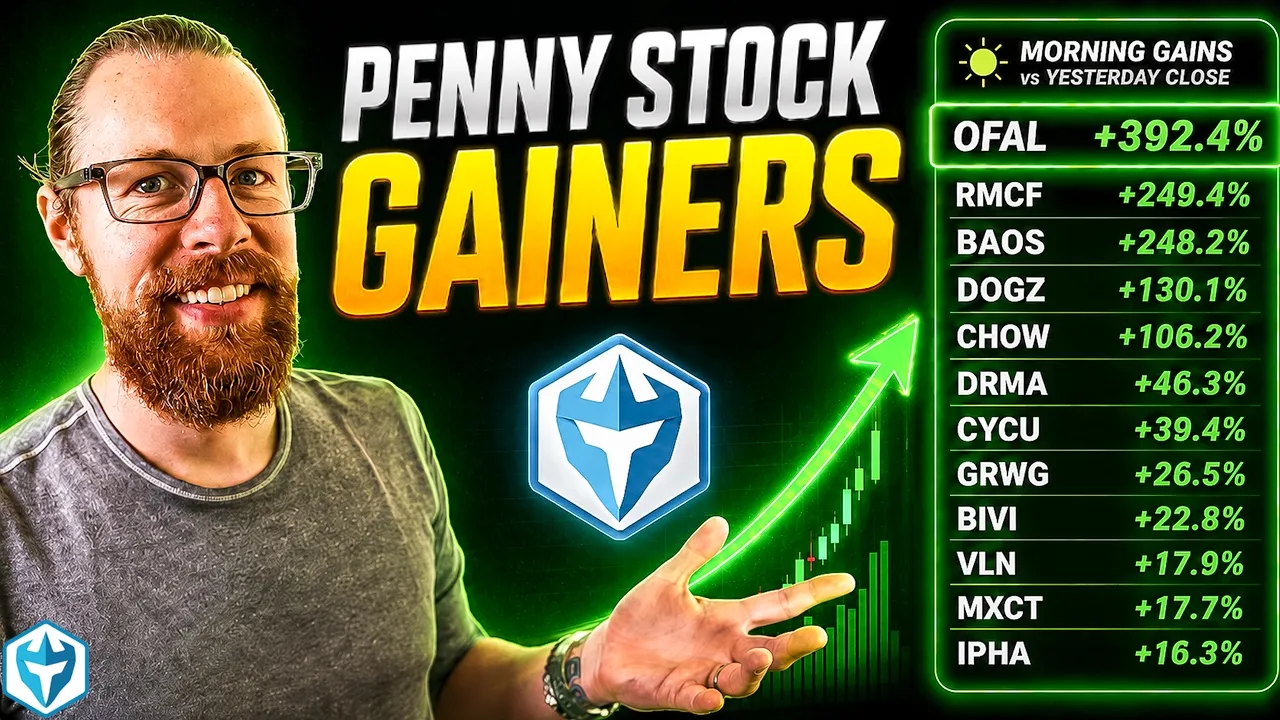
Ross Cameron - Warrior Trading · @DaytradeWarrior
This video has no Most replayed graph yet: YouTube shows one only once a video has enough views. These are the moments viewers replayed most in Ross Cameron - Warrior Trading's most watched videos.
Most replayed moment at 51:28
4.1x that video's typical replay level
take any trades there. Uh, that was a no trade day. What am I talking about? So, in any case, um, I had traded on Monday and then today's Wednesday. So, nonetheless, I've had about one no trade day per week. So, yes, there will be days where there are not a quality setups and if that's the case,
Said at 51:22
Most replayed moment at 12:26
11.2x that video's typical replay level
take a trade both in my small account and in my big account. So, this unbelievably does a false breakout right here, and literally drops $2 a share from 740 down to $5.40.
Said at 12:18
Most replayed moment at 1:34
7.6x that video's typical replay level
at about ten dollars and 35 cents for that squeeze through the high. And we got to move all the way up to just under 12 and I made 25 thousand dollars on that trade right there. Looking back, I wish I had just taken it off the table and said, "That's it. I'm
Said at 1:28
The graph counts replays. It does not show where viewers stopped watching.
Words
3,718
Runtime
20:12
Speaking pace
184wpm
Reading time
16min
184 words per minute, just over the 181 median of 349 measured videos. That distribution comes from the 349-video hook study.
Opening (first 30 seconds)
What's up, everyone? All right, in today's episode, I'm going to break down my trades from the morning. The theme yesterday was false breakouts. We had so many stocks, I lost count, that squeezed up and then did this dramatic false breakout and ultimately ended up being a complete round trip. A round trip is when we have a stock that rallies up and then comes all the way back down to basically the same price where it started. Now, the false That's round trip. Now, the false breakouts that we had
92 words, the words spoken in the first 30 seconds at 184 words per minute.
Free, no signup. See how the first 30 seconds hold attention, with rewrites.
Sentence shape
| Measure | This transcript |
|---|---|
| Sentences | 269 |
| Average words per sentence | 13.8 |
| Longest sentence | 67 words |
| Questions asked | 16 |
| Sentences containing a number | 69 |
Most used terms
Filler phrases
90 in total: um 28 · like 15 · you know 12 · actually 11 · uh 9 · basically 4 · sort of 4 · kind of 3 · right? 3 · I mean 1.
A literal whole-word count of the same phrase list the Prepublish browser extension uses, so a phrase inside another word is not counted and a phrase used in its ordinary sense still is. It is a count and not a judgement.
Run the check on the words above: where attention is likely to drop, with a rewrite for each weak line. The free check shows the scores and the one issue costing the most.
What this transcript is
Every word below is the caption track YouTube publishes for this video, pulled from the video itself and reproduced unchanged. It is not Prepublish's writing, not a summary, and not a re-transcription: it is the video's own published captions. English captions, published by the channel, in the video’s original language. Source: the video on YouTube. A channel that would rather this page did not exist can ask for its removal through the contact page, and it is removed.
What's up, everyone? All right, in today's episode, I'm going to break down my trades from the morning. The theme yesterday was false breakouts. We had so many stocks, I lost count, that squeezed up and then did this dramatic false breakout and ultimately ended up being a complete round trip. A round trip is when we have a stock that rallies up and then comes all the way back down to basically the same price where it started.
Now, the false That's round trip. Now, the false breakouts that we had yesterday looked a little bit more like this. We had a stock that would squeeze up. It would then dip down for a moment. I was like, "Okay." Looking for that first candle to make a new high. This candle opens. It starts squeezing up. Then it breaks the high of the previous candle. It pushes a little higher. And then suddenly, out of nowhere, we get this big sweep of selling, maybe short sellers, and it flushes back down.
And by the end of the candlestick period, closes down here, which changes the candle from being green to having a big topping tail and being a red shooting star. And the problem with a candle like that is that typically it's also on high volume. You've got high volume on the move up, which is what we like. Light volume on those first two red candles. And then here, during the moments when this candle was green, it had high volume cuz people were buying.
But as it reverses, all of a sudden people are bailing out. And so now you've got a high volume rejection. So, we don't like seeing those big rejections. It's a false breakout. And we had a lot of them yesterday. Now, yesterday I was attributing those false breakouts to the fact that we had dispersed attention. It was hard to tell which stock was really obvious. We had from yesterday, if we jump on the screen share, WXM, which had been the biggest leading gainer of the day.
We'll scroll out here so you could see it. I'll make this a little bit bigger on the 5-minute chart. So, we had this really big move on WXM here, where we rallied up, we pulled back, we popped up. But one of the challenges with it, really from the very beginning, as you can see are the topping tails. So, it kept popping up squeezing higher. It was looking really good and then all of a sudden this dramatic false breakout.
So, right there this goes all the way up to 10 then it comes all the way back down making it not quite a round trip, but darn near close. If we looked at it on the 1-minute chart, it's even more dramatic. Then you've got a couple more topping tails on this. So, we had this one, we had this one, we had this one, we had this one, and we had this one and then it just continued to go lower. So, this was the obvious stock yesterday, but it was not easy to trade.
But you know what became the number one stock yesterday? It was PLAG. Look at this thing. From 60-70 cents a share, it rallies up to a dollar 50, halts up, then dollar 70, halts up, halts up two more times, three more times in a row, then it drops, then two more halts up, 1 2 3 4. Then this is such an unusual pattern right here. Look at this. It It halts up at 380, 390. It opens lower and then halts up. Then it opens lower and pops up and then halts down.
Then it opens lower and halts up right here at three, and then it resumes at 520. What in the world? Then it goes 1 2 3 4 more halts up, three halts down, back up. You know, the person who came up with the idea of circuit breaker halts never envisioned that happening. That was not the intended consequence. The intention of a circuit breaker halt, initially, was to prevent flash crashes. So, for those of you guys who aren't already uh well-versed in circuit breaker halt, there there's actually a lot to learn about them.
And one of the things that I have always found interesting is that the halt levels can be different even when you have two stocks that are the exact same price, your halt levels can be uh can be substantially different. And that makes it really confusing. So, a lot of beginner traders struggle with these halt bands. Now, I've done a a bunch of episodes on circuit breaker halts. Um so, what I'll do here um I'll I'll give you a little crash course on how they work.
So, why was this stock, for instance, halting as frequently as it was? And the reason it was halting as much as it was is because it was priced in the previous day below $0.75 a share at the close. So, I've got this blog post I'll just show you right here. This is on WarriorTrading.com. So, um we're going to scroll down here. And right through here, you can see um this table. This breaks down the way the halts work. It's a little confusing on that, so I'm just going to jump on the whiteboard and and make it a little easier to understand.
Because this actually continued to be an issue. We'll just jump back on the screen share for 1 second. This continued to be an issue at the opening bell today on OFAL. OFAL ends up having the same kind of thing. Halt, halt, halt, halt, halt, halt. Three halts up, four halts down. It's It makes it very difficult to trade. Five halts down, actually. So, this is the way the halts work. Okay. So, if you have a stock, so we're going to just do circuit breaker halts.
Forgive my fast, messy handwriting. I should have started over here, but that's all right. Okay, so if a stock um on the prior close was below $0.75 per share, the stock will halt every $0.15 going up or down if it happens within 5 minutes. So, within basically a 5-minute spike uh would create this halt if a if the spike went up $0.75. A stock above $0.75 cents up to $3 a share will halt every 20%. That's very different.
And a stock above $3.00 a share will halt every 10%. And then you've got tier one securities which halt at 5% increments, but we don't usually trade those. Um so I'm going to not going to include that right now. So here's the interesting scenario. You could actually have a stock you could have two stocks side by side that are both trading at um three let's just say $3.00 per share right now. And on the first stock, they're both at $3.00 a share.
The first stock, the prior close was $0.74 and the other one was $0.76. So basically one was just below the cusp right here and one was just above it. So the one that was just below it, the halt going up, so I'm going to do limit um LULD limit down limit up. Um the halt up is um 3.15 and the um halt down LULD is um 2.85. All right. So 15 cent halt bands. So if the stock squeezes up 15 cents within less than 5 minutes, then it will halt.
Now you I could go into a bit more detail about how that reference price is calculated. It's the average price over the last 5 minutes, but basically if a stock spikes up within about 5 minutes or less um then it'll halt. This stock was at $0.76. So it's in that second tier right here, which means it's every 20%, which means the halt up at even though they're both trading currently at $3.00 a share, they're both up similar percentages.
This one will halt at $3.60 and this one and then it'll halt down at $2.40. Wow. So that can move a whole lot more before halting versus the first example. And then we have this one here which let's just say uh yesterday was $3.01 and it will halt. It's still at $3.00 at 3:30 and going up or uh $2.70 going down. So, here you've got three stocks all the exact same price, but because of the circuit breaker rules will halt up and down at different levels because of these thresholds.
So, if you don't understand how halts work, well, hopefully you do now after after just watching this. It'll give you better understanding. If you didn't understand how halts work, you would be confused about why you could have stocks of similar price that halt at different areas. Now that you know, you're empowered. So, between the hours of 9:30 a.m. and 4:00 p.m., which is when circuit breaker halts are active, you've got to be really careful trading a stock when the previous day's close was below $0.75 because they will halt very quickly.
And as you can see from the case um of OFAL today, but even better from PL AG yesterday, you could have a stock that halts up at $2.80 right there and resumes at $5. That went up 100% during the halt and there was nothing you could do. If you were short, there was nothing you could do to get out sooner. If you're long, there was nothing you could do to take profit sooner. It simply resumed at $5.00 a share. What was happening while the stock was halted is there was an auction going on behind the scenes.
And so, likely what happened was initially it halts up at three an unrealized P&L of the $4 resumption, and if they're in 100,000 shares, or you know, whatever at a $3 average, they're down 100 grand. Let's say that presents them with a margin call. The broker now takes over their account and puts out buy orders to cover. And so now you've got buy orders going out at 4, 410, 415, 425, 450. Are there actual long bias traders getting in up here and adding?
I can't imagine they would. So this is fueled, essentially, that move by short covering. And so shorts get squeezed and it goes all the way from $2.80, whatever, up to $6 a share. Now, on the one hand, this is clearly a big win if you were into the long side, but it's also a bit of a gamble because you just don't know what's going to happen while the stock is halted. You could have a halt up as we had right here at 385, and then it shows a resumption down here at 334 330.
You don't know why. All of a sudden, a market maker, or whoever, puts out a big sell order to dump shares. Could be an insider, we don't know. And so, unfortunately, trading during halts presents an additional level of risk. There are times where I'm okay with it, um but on lower priced stocks like this, it's especially difficult because of how quickly the stock will halt it will will get halted. So at this point here, it's a $6 per share stock, right?
But it's still halting every 15 cents up or 15 cents down because of the halt bands, which are calculated by the previous day's closing price. They don't change during the trading session. So this could have gone all the way to $100 a share in theory and still been halting every 15 cents, which would make it nearly impossible to get in or get out of the trade before you're stuck in another halt. So for that reason, it wouldn't surprise you that I actually prefer trading in the pre-market session when there's no halts and in the after-hours session when there's no halts.
Although it did mean yesterday I missed this entire move on PLAG, which was fueled by short a short squeeze. So, there are times where I see these moves and I'm like, "Oh, I really missed out." But, let me give you a little hint. Check the volume. Notice how the volume declines as it goes higher. Because there's not enough liquidity when you're halting back-to-back that quickly to really move in and out with any reasonable share size.
And so, the volume was actually the highest during the pre-market and declined as the day went on. WXM yesterday, we had higher volume pre-market, one high volume candle at the open, and then it declined. Today, OFAL, we had higher volume pre-market right here, and volume declined after the open. So, right even though it went higher, and that's a divergence. The price went higher even though the volume was declining, and I usually consider that to be a red flag to take my foot off the gas and slow down, which is exactly what I did.
So, on OFAL today, this was not the first stock I traded. It was actually it was the last stock I traded, however. And OFAL did give us one nasty false breakout right there. So, we'll break down this stock first because it's sort of the most interesting. Okay, so, this stock ends up being up a little bit in after hours yesterday on relatively light volume. So, one of the scans I use here is my after hours top gainers scanner.
So, you can see OFAL, where was it? Let's sort by sort by float. OFAL, maybe it wasn't up enough. Let's just double check on the double check on the chart how much it was actually up. There was a teeny bit of volume there, that 100,000 shares. But, let's see, the total percentage change after hours, we were up as much as 18%, but then, yeah, by the end of after hours it was only like 8%. So, not much of a gain. And then all of a sudden, boom, 6:05 a.m., this thing starts ripping.
Chinese Hong Kong stock with no news. Starts ripping, starts squeezing. And if you remember, of course, we had Socket on Monday, SCKT, and that was it Monday or Tuesday? I can't remember. Was this just yesterday? No, it was it was Monday, I guess. But anyways, so SCKT, we had this move from $0.50 a share to $4 a share, also starting at, you know, kind of Well, this one actually started at 9:00 a.m. But nonetheless, this one actually had news.
Um OFAL didn't, but in any case, OFAL starts the squeeze, traders are thinking about Socket from Monday, wanting to catch that next big move, and they jump on it quickly. And so you end up getting a pullback, a pop, a pullback, a pop, a pullback, a pop, a pullback, a squeeze all the way up here to 260, and all the way up to 280. So you get this really nice move, and at 7:00 a.m. I said, you know, topping tail, topping tail, topping tail.
I think I'm going to just wait. Ends up doing a little bit of an inverted head and shoulders pattern here and selling off. And then we had resistance at 220. I was watching that level closely, and I said, if 220 breaks, that's where I want to be a buyer. I was very clear about that. It comes up here, we get a break just for a second, I had my hand on the buy button, but it stalls out, and so it kind of it almost went, but I said here, you know, my issue at that point, and I said I was clear about this as well, was that, you know, we've already had um sort of this rally back up.
I'm just I'm worried that it's going to reject here because it's it just feels a little extended. So I really wasn't sure it was going to work right in this area. So anyways, it goes up there, it sells off again, it comes back up here, double tops, and this essentially is an inverted um head and shoulders pattern. As we broke right there, it was game time. And so that was my first trade on OFAL. We got this squeeze here from uh 220, roughly, all the way up to a high of $3.50.
And I was adding into that squeeze. I took a bigger position, I sized up pretty heavily, and we got a nice move. We had about 7 million shares of volume in 2 minutes. It dips back down here, and then I added back 60,000 shares right here because I had a cushion on the stock, and it does a nasty rejection. It drops down, and with that, I flipped from green on it to red. This is my P&L for the day. $17,617 as you can see.
And this trade right here on this last trade was a 60,000 share position where I sized up heavily looking for that move higher, and well, that didn't end up working very well. So, it ends up going sideways here, dipping down, and then the open halts up 1 2 3 times, and then 1 2 3 4 5 times down. Now, we're halted back up. And so, even in the halt right now, it halted at $2.26 and showing a $2.43 resumption. So, the problem with that is that, you know, you just while these are halted, you can't do anything.
You're stuck. So, that makes it very difficult. And if you're short, you can certainly be in a real jam. So, anyways, OFAL a bit choppy, but for those of you guys that that traded it in this candle, that was your cleanest candle. And congratulations if you got green on it cuz that was a really nice move. So, I thought this thing was going to really keep going. At that point, it was the leading gainer and whatever. So, that was OFAL.
Now, we also had RMCF. RMCF is a Hong Kong tech stock? Nope, it's Rocky Mountain Chocolate Factory. Wait, Rocky Mountain Chocolate Factory? This thing went up like 150%? Yeah, you mean the same one you see like in the airports and stuff? Yeah, the same one. So, this thing ends up making this huge move here up 268% and I traded it. I punched it, locked up about $18,000 on that move. Now, this one I traded a little bit differently.
So, this one, rather than trading on on OFAL, I wouldn't say I was trading the backside. It was above volume weight average price, but I was trading a curl back up. That's a curling setup. On RMCF, instead, I was trading really the very front of the move right here as it was still cranking higher. And the way I approached it was I noticed the 200 moving average was at about a $1.70 resistance. That's what I sort of thought.
And so, as it came up here to a $1.70, I was like, "Well, it's probably not going to hold." Let me show you on the 10-second chart. Um and then all of a sudden we saw uh big bidders at about a $1.66 to $1.68. And I thought, "You know, uh I think this is going to hold." And so, then I started adding right here. Adding, adding. It goes all the way up to 230, 240. Selling, selling, selling, taking profit. It ends up coming back up to a high of 250, which was awesome.
And just with that move I booked $17,000 of profit right there. I didn't go back for it. Um actually, is that Now, where was it? Um I was right in here watching for a possible curl like OFAL. Um and it came up to 190, but it wasn't quite able to do it. And as you can see, a little bit later it tried again, but I was just like, "I don't know." My issue with this one was that unfortunately big shooting star candle, right?
I love that ascending volume, but then it topped out. And then on the 5-minute chart, it was a giant shooting star. So, I felt like this rally here, these topping tails and this curl was all sort of in the shadow of that. But I saw I thought the same thing about Socket on Monday. And you know, that did go higher. Right? So, we'll switch this one to the 1-minute chart so you can just see it better. So, on Monday we had this initial pop.
Um now, it didn't rally all the way back up, but it it went to four, then dropped back down to $1.60, and we got this curl back up to $3, which was still 100% right in there. But again, that initial topping tail is is pretty bearish. So, in any case, um Um, RMCF, those were the big moves. And then SPRC, $300 scalp on that. Just tried to break the ice, but it didn't really work. The theme today was definitely penny stocks.
Not necessarily true pennies below a dollar share, but stocks that were cheaper and um, that was where the focus was. And I think that was really driven by the move on PLAG yesterday. So, with that, I'm locking up a green day here. I'm grateful for it. No trades in my small account today. Um, not I mean, I could have. I just I wasn't totally confident these would work. So, uh, you know, and by the time some of them were working, I was like, well, I can't really add in in my small account up here.
So, anyways, that's fine, but um, a good day here and we'll be back at it first thing tomorrow morning. Reminder, as always, trading is risky and my results are not typical. So, please manage your risk by practicing in a simulator before you ever put real money on the line. With that, I'll see you guys at 7:00 a.m. Eastern Standard Time tomorrow morning.
The words are the caption track's own and nothing is reworded or re-transcribed. Paragraph breaks are placed between sentences so the text reads as prose.
Free tools for your own script: paste a draft and see where it stands before you record it.
Paste your draft and see where viewers are likely to drop off, with a rewrite for each weak line.
Paste the first 30 seconds of your own draft for a hook score and rewrites.
Check your draft against YouTube's advertiser-friendly guidelines before you record it.
Read this channel's public videos and transcripts, and download a writing brief for it.