Getting the transcript
Reading the captions from YouTube. A video nobody has opened here before takes 10 to 30 seconds; this page fills in on its own.
Getting the transcript
Reading the captions from YouTube. A video nobody has opened here before takes 10 to 30 seconds; this page fills in on its own.
The Inner Circle Trader · @InnerCircleTrader
This video has no Most replayed graph yet: YouTube shows one only once a video has enough views. These are the moments viewers replayed most in The Inner Circle Trader's most watched videos.
Most replayed moment at 51:50
3.7x that video's typical replay level
Okay? So, now we have two points of reference. Now, when I have this like that, I have two little sweet spots in the previous day's range and to the left of that, why? Cuz we're going to go back 3 days.
Said at 51:44
Most replayed moment at 10:06
3.2x that video's typical replay level
towards that of this buy side imbalance or side inefficiency, which is a suspension block, which has a volume imbalance on the high end and a volume imbalance on the low end. All right, so let's move into the lower time frames now. So, we're at a 1-minute chart.
Said at 9:58
The graph counts replays. It does not show where viewers stopped watching.
Words
9,408
Runtime
1:01:23
Speaking pace
153wpm
Reading time
39min
153 words per minute, below the 160 25th percentile of 349 measured videos. That distribution comes from the 349-video hook study.
Opening (first 30 seconds)
Good evening folks. Welcome back. I appreciate your patience. Sometimes life gets in the way as I mentioned on hacks before posting here. So, we're in part three of how new students should begin and what they should do and what's the what's the most important things. You see a lot of hype around certain things in this industry like heat map, liquidity maps, um things that uh populate your chart. It makes the chart like really
77 words, the words spoken in the first 30 seconds at 153 words per minute.
Free, no signup. See how the first 30 seconds hold attention, with rewrites.
Sentence shape
| Measure | This transcript |
|---|---|
| Sentences | 815 |
| Average words per sentence | 11.5 |
| Longest sentence | 93 words |
| Questions asked | 91 |
| Sentences containing a number | 67 |
Most used terms
Filler phrases
137 in total: like 60 · uh 27 · um 19 · you know 13 · kind of 7 · I mean 5 · actually 2 · basically 2 · literally 1 · right? 1.
A literal whole-word count of the same phrase list the Prepublish browser extension uses, so a phrase inside another word is not counted and a phrase used in its ordinary sense still is. It is a count and not a judgement.
What this transcript is
Every word below is the caption track YouTube publishes for this video, pulled from the video itself and reproduced unchanged. It is not Prepublish's writing, not a summary, and not a re-transcription: it is the video's own published captions. English captions, generated automatically by YouTube, in the video’s original language. Source: the video on YouTube. A channel that would rather this page did not exist can ask for its removal through the contact page, and it is removed.
Good evening folks. Welcome back. I appreciate your patience. Sometimes life gets in the way as I mentioned on hacks before posting here. So, we're in part three of how new students should begin and what they should do and what's the what's the most important things. You see a lot of hype around certain things in this industry like heat map, liquidity maps, um things that uh populate your chart. It makes the chart like really busy, really difficult to read and like what information is useful.
And I kind of wanted to show you what you probably have suffered yourself because you didn't listen in the lectures where I said you have to be a good manager of the information and the data. All right. All right. So, what data am I referring to? Key levels, PDAs, high time frame, macro perspectives. I'm going to go through a really brief video here. And I can make this into a very long long video and bore you, but I want this to be number one straight to the point.
That way, you know what to do, how to do it yourself. Each day, each week, each month, everything is the same continuous pattern. It's a regimen. So you do XYZ to get ABC123 data. Okay. And these reference points are what we use to call price moves, measure price moves continu uh continually on a continual basis to see whether or not there is um basically the likelihood of seeing a price move continue. So, we're measuring the strength or the weakness of a a price run and its continuity.
So, if you're like most students that come to me and they listen to everything that I teach and they say, "Wow, there's I have all these lines on my chart. I have all these things on my chart and it probably looks very close to this." Now, I forced myself in front of Caleb the other day and you saw the recording for part one and part two. [sighs] The idea was to show him what most of you are probably doing and you're having so many things on your chart and it's hard to navigate.
Which is the most important thing to be worrying about right now. How do you use this information? And more specifically, what information are we referring to? Okay, so I'm going to kind of go through that now. Um, we're going to talk about what matters most first. So, we're going to go to the little tab up here. Now, you should be able to see everything with the border here. This is you. I'm using Trading View. Now, you can do the same thing withever platform you use.
You don't you don't have to use Trading View. You can use whatever you want to use, but preferably you want to have some kind of means of creating a workspace or a layout and keep them individually separate from one another. Otherwise, you'll have to deal with a chart like this. Now, I can navigate this. It's a little cumbersome. It's It gets on my nerves a little bit because there's so many things, you know, pining for my attention because of the things that's annotated here.
But everything on this chart is exactly what's on my notepad. Okay, my notepad has everything you see here. So, to answer the question that people always say, can you show me what's on your notepad? Yeah, I get it all the time. Every time I mention I have a notepad next to me, invariably I'm going to see comments. Can you show us what you have written down? It's everything you see here on this chart. Everything with the exception of what I'm going to show you now.
Go up here to layouts. Okay. So we have the open tab and we'll go down. These are all specific layouts that I use. Okay. Some of them I use for specific series like the notes and things I want to keep in that specific venue or or topical study. Uh I I'll save it as a space so that way I can come back to it and all the notes that I had in the last video in the last you know production of that continuing series everything will be germanine so I don't lose anything.
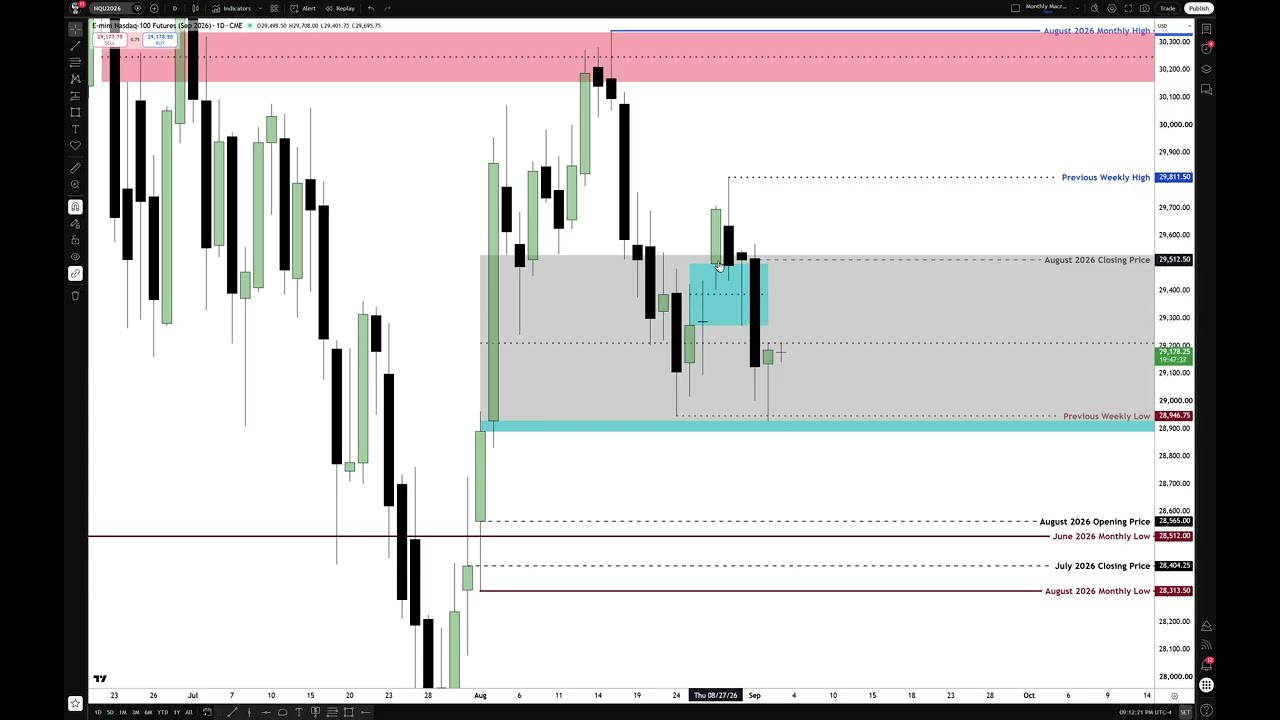
Okay. And what you want to do is you want to create a space like this. Okay? And what it is is very simple. We're going to go up to the monthly chart. Okay. Now, by zooming in right away, you can see it's very simplistic. Very, very simple. Only thing I'm doing is I'm highlighting the last three months. Okay, so right now we're in September. Man, did this year fly already, didn't it? Here's August highest high and annotated as August 2026 monthly high.
Then here is monthly closing price. It's an up close candle for August. August 2026 closing price. Opening price for August annotated here. The the low of August. August 2026 monthly low. And the same thing going back to July. We have July's lowest low, July's opening price, I'm sorry, closing price, opening price for July, and the high for July. And then going back to June, you want to go back three months. Okay? So, three months worth of high, low, open, high, low, and close on the monthly chart.
So we have the high for June, open on June, the close on June, and the low on the June contract or the data for June. [snorts] Now, what's the importance of having this information? Like what's the big deal? Okay, where are you at in reference to that entire range over the last three year uh three months? Not three years, three three months. Well, you have June's high and you have July's low. So where are we at in reference to that range?
Okay, this is how you manage the information. Notice I have nothing else on this chart. I have no reference points to fair value gaps, order blocks, breakers. I don't have anything like first presented fair value gaps, new week opening gaps, new day opening gaps. None of that is here. None of it is here. Okay? So you want to have a very higher time frame macro perspective where you can just simply look at where we're at in the in the last three months, where are we at in the last month and where are we at in reference to the year if you want to go back to you know a full calendar year go back 12 months where are we at in that as well.
So are we in a discount or a premium relative to that range? So the last three months since I teach in the mentorship if you go on the 2016 2017 mentorship playlists you eventually you'll get to a point where I'm talking about quarterly shifts. Okay, quarterly shifts are heavily linked to seasonal tendencies. They're the big moves. Okay, they're the very large swing trader perspectives. They're not down in the one minute charts like you see me doing majority of the time every single day.
You proving there's something you can do every single day. by understanding what the seasonal tendencies are and by understanding what the next quarterly shift is likely to do. In other words, where is it likely to go over the next month to 3 months by having that macro perspective, which is why it's labeled here, monthly macro keys. keys being we're determining where we're at in reference to a specific range over the last three months inside a calendar year.
Okay? And right now if you look at it, if we measure, you can work real easily on this time frame. You can see we're at halfway point right here. We we are sitting basically at if we closed for the month, which obviously we're not going to. We just finished the second day of trading for September 2026. Right now, we're sitting at half of the last 3 months range. So, we're running right inside of equilibrium of the last three months.
So, we're going to demand that the weekly in the daily chart gives us more intel, more insight. Okay. When we're in the upper portion of it here, we're in a premium. When we're below 50% of it, we're in a discount. Okay? So, if you want to be trading with a short-term traders mentality, like getting in for a day or two or 3 days, maybe for one shot, one kill, you're going to use that type of logic to frame your trade.
Very simple, isn't it? Now, most of you didn't even write that down, but you're going to wonder why you forgot it [laughter] months and years from now. You'll swear if you watch this video again, oh, he did say that stuff. Yes, I did. So, real quick, that's short and sweet. Now, there are several ways you can go through this. Uh, I like to go in to a monthly chart and I highlight the actual key levels, open, high, low, and close.
And if you look real close, you'll see that the previous week high and the previous week low is there. See that? I keep it on this because I want to see with the monthly charts where that is as well in difference to the monthly charts. So everything here, the the weekly highs, the monthly highs, they're in blue. Okay. The opening prices, I want them in black and I want them in a dashed line. Dashed line. Dash line. Previous week's high and low.
You're only keeping one reference of that. That's not something you got to do too much of. Okay? So, it's just what was last week's highest high and what was last week's lowest low between Monday and Friday. Okay? Now, you can be a stickler if you want. You can incorporate um Sunday if your your platform allows you to populate a chart separate. Uh if they don't compress the data Sunday and Monday, uh some platforms omit Sundays.
So you'll you'll have to figure that part out on your on your own. But I I want to see what the weekly range was the previous week. So you're only tracking what? monthly highs, lows, open high and lows for each month, and previous week's high, previous week's low. Right away, that should remove a great deal of confusion about how much you're supposed to be spending on these monthly and and weekly charts. Okay, th those are the keys that you need to know.
Now, where are we at in reference to previous weeks high and low? we're in the lower portion of it or a discount. Okay. So, now we go into a weekly chart. Here's previous week. Here's previous week's low and high respectively. Okay, we opened in the premium side of that range. How do we know that? We can measure it simply by doing this. Here's equilibrium. We opened in the premium side of it. During a time I told you seasonally, we're entering a time where index futures are usually weak.
September is usually a weak month. Usually, we see lower prices. It doesn't mean that they can't twist this thing around and go against the grain, but generally, as a rule of thumb, September are usually bearish months, okay? Okay. And we usually trade down into some low in September or some low in October. Rare rare rare occurrence. We'll make the seasonal low in November. And then we get some kind of a flurry of action going in towards the end of the year trading up into the first week of February and that's usually the the catalyst.
Okay, that usually generally takes place. But that's not a panacea. It's not a beall end all. It's not a it must be this way because ICT said so. It's just a general rule. Okay. So when you when you do your annotations on here, just get the information. Write down your key levels by measuring previous week's range. What levels are they? Your gradient levels and your octants. Okay. And take that off. Actually, I did the wrong one, didn't I?
Yeah. I want to take the uh the fib off, not the previous week high low. All right. So now that's it. That's all you're done with that specific layout. So you get the key informations in regards to premium to discount relative to previous weeks high and low, relative to last month's high and low, relative to the last three months range. So it gives you an overview, a macro perspective, which is why it's named the macro keys.
That means you know what you're looking for in reference to the real dealing range relative to time key time frames monthly, weekly, and daily. Bringing us down into the daily chart and we'll zoom in here. All right. Now, we are inside of an equilibrium price point just by looking at where we're at here to here. We're halfway point. You don't need to have all this detail, but if you're trying to learn how to do this, this is where you start.
If you are lazy, and I don't mean to be condescending when I say that, but there is so many people that come to me. They say they want to learn how to do this. They say they're going to put the work in, but you have to be do you have to have your due diligence and care about the information management. It It doesn't take a lot of work to do these types of things, but if you're not interested in knowing these reference points, you're not going to learn well here.
You're going to struggle and you're going to blame me. You're going to blame, you know, something outside of yourself when it's just simply you just simply being lazy. Okay? I have had lots of students that came to me over the last 34 years and they literally cannot follow rules generally. So they have to condition themselves to be disciplined, learn to do certain things. It's a day-by-day procedure. Once you have the monthly highs and lows, open, high, low, and close in the previous week's high and low.
The only thing you're going to manage then from that point on is your daytoday analysis. So, I just want to ring this in because it's part of where what we've done recently. Uh, if you recall, I was looking at how price was using this cibby, this consequent encroachment of that wick, and that was likely to be an impact for continuation on the upside and it failed. This was the high of that gap right there. Not going to annotate the chart here, but you you can do these types of things.
You can scribble all over them. Uh, let me do it. It's gonna probably be a longer video because of this stuff. But I mean, most of you don't care about that. You want longer ones. Other ones, give me a fivem minute trainer video. [laughter] So, we have the market reaching to the high of that and then we close outside of it. So, we had confirmation that we're probably going to go lower. We're entering a seasonal tendency where in the last week or so of August, it can be that early.
And I told you that we were going to use this reference point here, including the volume and balance down here up to that. And I told you this is what we're going to do. We're going to shade it like this. See that? So, I told you I want to see it try to get down to that volume of bounce. It failed to do it that day, but up here I told you we're likely to go lower. And we had this area in here, which is it's it's kind of like a volume of bounce.
I mean, if you really want to be a stickler about defining what it is, this is a slightly up close candle. If you look at the open, high, long, close, the open is 288 even. The close is 289.5. So, it's 1.5 handles or six ticks to the upside. It's still an up close candle technically, but if you if you factor that in, it's a small little volume of bounce below it and a volume of bounce to the high of it. When it's like this, I'm just going to call that whole range entire volume of bounce.
And you can do these types of things here. Annotate that up to the body. Draw that out like that. No extension. We want to see all of the levels that would be graded inside this fail to support price. Why? Because we're looking for sellside here. Go back and look at the last two lectures in last week's two. You'll hear it. You'll hear me say this is the sell side. We're likely to draw down into that and the volume imbalance has been the the target for you over a week.
Now if you look at that volume of balance like this. Okay. By having that type of information like this, what do you think price should do when it's trading down through this area here on a daily chart? What do you think should be witnessed in price action? It should do what? Be staggered. Like go down a little bit, has some struggles, go down a little bit, struggle, struggle. No, absolutely not. We have a wick here from Monday and then we have all of this on the daily chart where it's like open space. like there's um there isn't a whole lot of o opposition or obstruction to see price tra uh travel rather rather quickly and easily through that range.
Then on Monday, we opened we traded down through it once and then we had a lot of mipation come in and then on Tuesday we gave up the entire thing overnight and ran right through it. So just let me please let me put this portion in here because that way I re I reviewed what we've done today, Tuesday, Monday in deference to this information. Then I'll finish what you're supposed to be doing as a new student. So, it kind of like brings everything together by having it look like this.
When we go down into a one minute time frame, look what we say here. Look how look how powerful this is. By having you manipulate the data from specific time frames and transpose those ideas into lower time frames, you'll get a clarity that is unrivaled. You don't need heat map. You don't need liquidity maps. You don't need all these other things. Okay? Open, high, low, and close in deference to time will give you everything you need to look for.
It gives you the highest degree of where the big moves are going to come. That's the importance of this lecture. Because everything I teach as a as as an educator using my conceptual ideas, there's nothing I can point to externally to say this is how you use my stuff. So you have to use my stuff the way I designed it. And by having the view of that daily fair value gap that I shaded in blue, remember it's inside of daily chart inside that big gray area which is the bottom of this blue area which is the volume imbalance and this is the high of it.
Now there's a volume bounce up there too but no there isn't actually. Um this shaded area here. Watch what happens when we start to break lower on Tuesday at 3:00 a.m. cascades through it. Was there any real opposition? What about the support and resistance guys here? This should have been support, but it wasn't. How about this? Did it support it? Nope. How about that? Nope. Nope. It just went right on through. Notice that.
Then we came right back up into that same area. But what is it trading to? It's trading to an octant relative to this blue shaded area. So when you have these levels here, when they become salient to what you think price is going to be utilizing right now or if you turn your chart on, it's trading right here at this moment. You simply go into your chart and you go out to a daily chart again, find your your range on that PD array that's building an interaction with.
So, you take your fib, you grade it out from low up to high. Why am I doing these two levels here? Because there's no bodies except for this little tiny little piece here. So, there's a volume of balance there. And as this all the way down to that candlestick's close, it's a huge volume of balance. So, now we have that graded. So, these levels here are inside this gray box. Now, I already know some of your heads are spinning like, "Oh, this is complex.
This is complicated." If you sincerely believe that, okay? If you sincerely believe what I just showed so far is complicated, do yourself the biggest favor and me a favor, too. Unsubscribe. Don't ever watch any of my videos again. And I don't mean that to be arrogant. I want you to understand that you are a problem. You are not trainable or teachable. You your your concern or interest is limited. And if you can't do this much or follow along with just this much, you'll never you'll never make it using my stuff.
And I I mean that sincerely. I mean it wholeheartedly. Go do something else. Find someone else that's going to teach you. And I hope you do very well. Just it's simple as that, folks. But now because we have it graded, remember if it's going to sell off during the season tenant that I told you last week, last week we're going to be entering into that. We're in this big open air space where there shouldn't be a whole lot of opposition on the way down.
See that? Now, with these levels here, every one of these levels here, get a mental note of these, okay? And then we're going to drop down into the one minute again. Look what's occurring. We break lower. This is the highest octant. This is the highest percentile. In other words, that blue shaded area I shaded on the daily chart. This is the high of it. This is the low of it. This is the lowest percentile. The highest percentile.
The highest octant. If you break it up into eighs, upper quadrant, second octant between upper quadrant and consequent quotient or midpoint, lower octant below midpoint, lower quadrant, lowest octant, and then the lowest percentile. Okay, we break through it, come down to the upper quadrant, trade back up to the upper octant, sells off, goes down to lower octant, back up to upper quadrant, breaks lower to and through consequent encroachment, as you would expect.
Why? Because it's inside of a daily area where there's really no candlesticks to build any support on. None. None whatsoever. It slices through that comes down to a lower octant. Now, at this point, if it's weak, it won't return back to consequent encroachment. Is that not what I teach with real order flow? Yes. We break again down to a lower quadrant, then comes right back up to what level? The octant, and you're looking at floor pivots, pivot numbers.
Listen, there's other things going on that the market really uses. It really uses these levels here because it's algorithmic. It's scripted. You're going to tell me that all the buying and selling pressure happens to agree with the logic that I've come up with grading a very specific range. Come on now. Seriously. We break lower and then look how it's using the lowest quadrant there. We break lower to lowest octant. I'm sorry, quadrant rather.
No octa. I'm sorry. My my eyes are failing me. I'm tired. And then we get down here, come back up to the lowest octant, and then finally we leave it. And now we're using the low of that fair value gap on the daily chart. And then what does it do? Trades down into the middle. This dashed line here or dotted line. That's half of that big gray buy center balance sell efficiency on the daily chart. It's this range. This whole big green gray area here and the low of that blue box.
This blue box is that volume imbalance on the daily time frame. I told you it was going to likely go to last week. Got real close to it and then shied away and then ran it up real hard. And then now we've been selling off since. Look how it's behaving around the halfway point of that. Okay. And then we dropped down, come right back up. Look where we're at. Right here. Remember I told you what is it trading to earlier before I went back up to the daily chart?
It's trading to its lowest octant. hits it here, sells off. Bang. There's your lowest um volume and bounce on the daily time frame. The the buy side of balance sell sign efficiency. Then it trades right back up to the middle of that daily buy sign balance sell sign efficiency. That's that dotted line there. Okay, look what it's doing. Hits it again. It's again, it's gyating around in here in no man's land. Why? Because it's hit the objective I told you we would hit for non-farm payroll week.
Be done trading on Wednesdays. If you're brand new trader, a brand new trader needs to be done. By that time, 11:00 a.m. Eastern time, Wednesdays of non-farm payroll weeks. That doesn't mean you as a experienced trader using other things or using my stuff. It doesn't mean you can't take trades. It just means that my responsibility as an educator, I take it very s sincerely and serious. I I can come out here and promise you and not really mean it because I can't promise.
No one can promise that you're going to be profitable. I can do that and be a liar. I can do that. Every one of us are human. We can make those types of errors. I don't do that. I've never promised you profitability. I have promised you and I have delivered a way of reading price action that is unique. It's not like anything else despite what you might think and hear and it will give you a greater degree of clarity and a methodology to follow where you're not lost amongst the time frames.
Now I'm condensing the entire mentorship's focus points that I did in 2016 2017 all in this video now because I'm teaching things conceptually as I go in that mentorship. You're not paying attention to a lot of things I'm saying but I've said all these things here during those 12 months of of teaching. I've said all these things. You're going to take the higher time frame and transpose them down to the lower time frame.
You're going to think in terms of premium and discount. You're going to grade the levels and the inefficiencies and you're going to look for these things and these are your key levels. Key levels and then time. Time is the aspect that's most important. So, if you'll permit me now, I'm going to go back up to the daily chart so I can remove the annotations on here so I can keep my my chart fresh. [snorts] I say that facitiously.
It's always fresh with ICT. So, we take that out here and we'll take the volume and bounce off there. All right. So, we made our way down into Tuesday's I'm sorry, Wednesday's trading, taking out previous week's low. You see that? So, that's how we traded there. Very important information. We have a small little inefficiency between Wednesday's high and Monday's low. So, be mindful of that there. And now we can resume back with the the final portion of this video because I don't want it to go over an hour long.
So, now we've done the monthly macro keys, which is the all the levels I've shown here, and then how you can use that chart. Get your information, draw your little annotations on it, but then go back and clean it all off. So that way you have all your levels with I showed you here. Okay, you have all your information, you have all your all your gradient levels and whatnot, but the next order of business is them now the inefficiencies as it relates to new week opening gaps and new day opening gaps.
So we're going to go over to new equiping gap matrix. We don't want to save any of the changes. So, right away now we have another chart. This is too complex, Michael. I'm not going to do this right. And you're going to fail trying to make my stuff work in your hands if you don't do it. Simple as that. You're going to wonder why you ain't doing it. Why it ain't working for you? Because you're lazy. Okay? And uh yes, I'm going to be a little bit of a drill sergeant in this because I'm reminding you that you are the problem, not me.
I taught these things. This stuff still works. And here you go. So, what are we looking for for new week opening gaps? Okay, which is the opening price at 6 p.m. Eastern time on Sunday, every Sunday. Okay. And the difference between that and where we settled on the previous Friday. Now, if there's a holiday that prevents us from trading on Friday, you'll just simply use Thursday. Okay? So, Sunday's always the beginning of a new week.
It isn't going to change. There it is. So, what I do is I I teach all of you to have at least five of the past five weeks new week opening gaps. And if you scrub through, there they are. 1 2 3 4 5. Okay, you want to label them. And if you see them on here, notice there's nothing else on this chart. I have no additional information. It's just these specific areas where there's a weekly gap and we want to keep a rotating fiveweek display of it.
Okay. Now, it doesn't take long to create this. Put some music on, put some headphones on or whatever. Um, get a nice drink next to you, and just go through. And what you'll do, this is how you do it. You go to regular trading hours. If you want to set this up, you go to regular trading hours like that. And then what you want to do is you want to have, not regular trading hours, what am I saying? [laughter] Electronic trading hours.
And then you want to do a calendar search to like for instance right now it's Wednesday September the 2nd my local time and you want to look at Sunday. So where's the Sunday previous? You got to go back into August. So you go here the 31st. Then you want to go to 1800. 1800 military time is 600 p.m. Eastern time. there. So now when you go to it'll take you to the 31st right here. Sunday. Did I do that right? Why am I getting confused here?
Mon clicked on Monday. So it's Sunday the 30th. I'm sorry. I apologize. I told you before last week when I was talking about this, it's a little wonky. I'm used to seeing my calendar have uh Sunday, not beginning with Monday, but I guess it's, you know, whatever. So, you go to the Sundays. So, the 30th is the previous Sunday of the present week because it's now September the 2nd, 2026. So, Sunday prior to that is the 30th.
Click on this. Make sure it's 1800. Go to So, it takes us right here. And you want to zoom in. Okay. Or since we have this little area over here, click this here. Grab that little area like that. And you want to find Friday. See that? 4:59 p.m. You're anchoring to the close on Friday at 4:59 p.m. That's the last print. And then you're going to take it to Monday or I'm sorry, Sunday's opening price. Since it's a down close candle, you're annotating to that level right there.
So, you're doing that. Anchor to the close on Friday, 4:59 p.m. Drag it up to Sunday 6 p.m. opening price. And then you just simply annotate it by the the date NWG for new week opening gap. August 08 30th. And I guess technically um that makes it easy for me as an American. Some some of you probably don't like to do the date like that. Just label any way you want. Just make sure that you're labeling as a new week opening gap and keep your colors consistent.
And I have new day I'm sorry I have uh first percent of fair gaps on here as well. So but you then you go back to the next one. Simple as this. Ready? Watch. All I got to do is this. Click that. Everything's going to stay the same up here. 1,800. Then go here. And you can see how I did it. We're going to zoom in over here. There's the business. Friday the 21st at 4:59 p.m. It's a down close candle. So, you anchor to the close.
And then on Sunday, we open up here. So we draw it from the low of Friday close up to the open on Sunday. Same thing. Now you're going to label it with that date August 23rd. And you want to do this with the last five, at least the last five. And you keep rolling uh populated chart. And if at any time you want to get rid of one, go to your object tree. If you're going to really be uh due diligence with this, I I don't care so much about doing this because I know what I'm looking for.
I manage my data with my journals, not so much on screen. Um I only annotate my charts so that way you as students follow my logic, what I'm thinking. I honestly work off of piece of paper 99% of the time. So, but you would go through say for instance like this this week in week n week opening gap. See how I'm hovering over top of the middle of it? It highlights on the chart. See the little dots up here? Up here, right here.
Watch. See that? Look in the area over here. See how it highlights? So, if you wanted to go into even greater detail and be really organized, which is what you should be doing as a brand new student, just toggle that so it's highlighted. And you can go over here, right click on it on your mouse, and go down to rename. And you can say you can say in log August back slash 23. Boom. So now what that helps you do as you populate more because you're going to continuously add more to this and do it by quarters.
Okay? And when you start a new quarter, you're going to carry over. And all you got to do is just create a copy. Like you can go up here and create not like that. You want to go to like this, you can create a copy of it and then you can use the last few of them and delete all the ones prior. So that way you have it by quarter or if you want you can just create an enormous list of things here that you're going to manage.
It just makes it a little bit more user friendly. I I think if you're going to do it electronically like like this and then say for instance you didn't want to see this one anymore. We're at a time where this has now become the eighth or the seventh or the sixth one. Looking back, all you got to do is simply do this. It's still in your list. You can still see it, but you can repopulate it by doing that. You see how easy that is?
It's very, very, very important to manage, be a very good manager of the data because if you mishandle the data, you're not going to do well. Okay? See, already we're talking about something that's very, very simple, very simplistic. But 99% of you don't want to do this. You already are kicking and screaming like, man, this I just want to get in and buy the fair value gap and sell the you the breaker, the reapers, and I want to get in there and you trade my my deuce, and I want to do this, and I want to do that.
That's all easier when you have this information on your charts. You know what you're looking for by having this information. So, let's go out to this again. Now, right away, where where are we at here? We're on the same chart. New equipment gaps right now. So, what do we what do we see price doing? What's it doing? It's just meandering around an empty space between two key PD arrays. A previous Monday first presented fair.
Tuesday's first percent value gap today or Wednesday's first presented fair value gap. Yeah, it's inside the chart with new week opening gaps. Now, if you want to be a purist and you don't want to have present first presented fair value gaps on the chart that has end logs, that's fine. Create a separate little layout up here. Just do new week opening gap matrix and then do a end dog ng new day opening gap. Now what's a new day opening gap?
New day opening gap is the difference between where we stopped trading at for instance look at uh this one here right there. I'm talking about new Dave and gap I said new Dave first presented fair gap. I apologize. I'm not going to be editing this out. This is going to be a one one one and done video. I'm tired. So instead of uh having first presented fair value gaps on your inog okay chart you can simply uh create a separate chart for first presented fair value gaps and just change change the title to first presented fair value gaps matrix.
Okay a matrix is where everything lays out over top of price action and you read in deference to premium to discount equilibrium what key levels it's likely to reach for. If it's bearish, um it could go up and touch one of these um key PDAs and then sell off. It it just gives you an an idea where the next big price run or reaction is going to be. You're not trying to figure out what support and resistance level, what supply, what supply and demand zone it's going to be, uh you know, what trend line to follow, what high low to pick.
My stuff gives you the the real core of why the market should be booking and why it should do it and when it should do it at what price level. So it removes all the ambiguity even though it may feel ambiguous to you now it's okay because you're you're you're learning for the first time purely learning for the first time. So um first percent gap what we're looking for when that occurs is we're simply looking for the first inefficiency that forms after 9:30.
So this candlestick here is 938 930 is there. If you go through all this, there is no fair value gap that forms until this one right here. Okay. Now, you can have a separate layout or overview or not overview, what's it called? Um um workspace depending upon what platform you have. Same thing. We're saying the same thing where you where you collect information and only that information appears on that set of charts. Like for instance, what we're doing here for Trading View, we're using the NOG matrix.
I just so happen to put my first fair value gaps on this with NOGS. So the first percent value gap, you can also use the first percent value gap that causes displacement. Okay? And an example of those things I've given in the past. But if you want to just be the pure form of how I taught it initially, this is how it is. is the first percent value you got the very first one that forms after 9:30. Okay? And you just collect them and then what happens is it populates on your chart and then you have information like this.
We're in between two significant first% fair value gaps. We're a good great distance away from this enog. And there's another one way down there. Okay. So, we're kind of like in limbo here. Which is why again, couple that couple this right here. Couple what I'm showing you right here with the fact that it's now post 11:00 a.m. Eastern time on Wednesday for non-farm payroll week. Now you understand the the importance of why I tell you if you're a brand new student, stop trying to find setups, if you're trying to practice, if you're trying to tape read, if you're trying to uh demo trade and and and or if you made the mistake to try to you chase real money before you know what you're doing, um you're probably going to have some hardships and look what the market's been doing.
I'm not surprised by this. Okay. To quote Nick Diaz, I think Nate Diaz as a UFC fighter, I ain't surprised. [laughter] So, long and short is I know what I'm looking for and it's these things that help me navigate that. Okay, these these key PD arrays help me navigate troubled waters. It tells me when I should be participating and when I should just sit still and not do anything. Look at look, I mean, look where we're at.
What school of thought is going to say, "Yeah, we got to go in here and trade this." A gambler. A gambler. Gambler mentorships 101. You copy me traders 101. They're all going to be here trying to do something. They're going to get beat up and chopped up and sliced up. Okay. Um, while we're down in here, it's real easy to see things that would lend to uh expanding up because we've done so much on the downside. Okay. And in reaching for this liquidity and this liquidity and you saw that happen this morning.
Um, you know, I I can trade in this environment down here, but it's important for me to illustrate why you as a brand new student shouldn't. So if I abstain from doing it and my departure from actively participating, if it encourages you by not doing it too, then I've done the the job of a good teacher. That's my that's my focus on it. All right, so let's finish this up here. Uh the other bit of business is you want to be logging.
These are all things that you're logging in and how you're tracking your charts. This is not back testing, by the way. Back testing is seeing what you see with these information points that I'm showing you managing the data. Now we want to look at regular trading hours opening range gap matrix. Okay. So if you click here, no, I don't want to save any changes. Now here is the regular trading hours opening range gap matrix.
Now right away this looks like what is this? What is what am I supposed to do with this? Very very useful information. Whenever you're in doubt, okay, if you have nesting like in a consolidation or consolidating market, you're going to encounter this where you have a lot of regular trading hours opening range gaps. Same thing you'll have with first presented fair value gaps or um end dogs, new day opening gaps or even maybe new week opening gaps.
If it's a really long protracted uh consolidation, you may start seeing blending in or overlapping of key PD arrays, especially if we're we're marking out ranges like this. So, we had a huge enormous opening range gap here on Tuesday's trading. That's the one that's shaded in like a pink hue. Okay. And there's one here. There's one here. There's one up here. It's this one here from last Wednesday. And then we have this one here.
Now, what I want you to look at is the largest one that we're inside of, the widest one, is in the pink shaded area. So, if there's ever a doubt of what would I be using, and I've said this before, so the people that listen to me when I do X spaces and Twitter spaces or I talk in those long droning point parts of my videos, you'll hear me say this, okay? It's not form fitting it. Everybody knows what I'm teaching in regards to this.
When there's nested PDAs like Nogs or regular trading hours, opening range gaps, regular trading hours, opening range gaps are where we stop trading. Notice we're down here in regular trading hours time, not electronic. So, make sure you're toggled to regular trading hours. And then up here, we'll zoom in here. This candlestick is the last one on Monday at 4:14 p.m. That's the final print for regular trading hours on a one minute time frame.
Notice that that closing price is what you want. That just so happens to be Wednesday's regular trading hours, opening range gap high. What makes it that? Because we open all the way down here Wednesday morning at 9:30 Eastern time right there. Okay. So that opening price at 9:30 Eastern time while looking at the chart through regular trading hours RTH that gives you the full regular trading hours opening range gap for Tuesday's trading of this week or September 1st 2026.
Now, if we take a look at that range, Tuesday's range is split in half here for the record trading hours gap. That's that's this is equilibrium of that gap or as we call it because it's a gap or inefficiency. It's consequent encouragement. I don't care if you don't like the name. Okay? Later on when we learn more things, you'll understand why that name was given to it. [laughter] I don't like that name, dude. So, we opened down here, meandered around, went up into last Wednesday's regular trading hours, opening range gap, a proportion of that.
You can grade that out. When you have this chart like this, if you ever want to like do a gradient application on it, say, say for instance, say we want to grade Wednesday, August 26, regular trading hours, opening range gap, real easy. go into your regular trading hours opening range gap matrix chart overlay where nothing else is on the chart and then use the data like this. The date is the 26th of August. Okay? And it's regular trading hours opening range gap.
So we want to go to the calendar little thing down here. We want to go to August 26 is the gap. So August 26 and we want to go to 9:30 in the morning. right there. So now watch what happens when we do this. Boom. We go right to the very day and the minute marker at 9:30. 9:30 we opened down here where we settled the previous day there on Tuesday at 4:14 p.m. Eastern time. You see that? See how we're managing the data?
We're keeping everything consistent. Nothing is being done differently. But now we can grade it. We can go to the close of that candlestick on the previous day at 4:14 p.m. Eastern time. Drag it down to the very first tick, opening price at 9:30. Drop it. Now we graded that. So now we can go back to price action where we're at right now. Scrub back over here. Moved around. Moved around. Moved around. And look, look at the levels and how it's respecting that.
Look at that. Look at that. And then we get to consequent corion of Tuesday's regular trading hours, opening range gap. If we're in a seasonal tendency that's bearish and we're in an area where on the daily chart, we had that big open volume imbalance. It was shaded in blue on the daily chart. Remember all of this freef fall that took place overnight. It looks like it just gapped down there like that. But overnight in electronic trading hours, it traded down through that.
We already we already saw that. But any retracement only went right up to half the gap for regular trading hours. Opening range gap for Tuesday, September 1st here. Look at that. Beautiful. Look at the bodies. What's it telling you? It's bearish. So that low is going to be taken. Trades lower. comes right back up into the lowest octant of Wednesday's August 26 right trading hours open range cap at that hits it takes out the low here goes lower and now look what we've been doing chopping wood but it's reacting off of key levels And this is a shadow.
Okay, look how price is respecting this little area in here. And look how it's respected that right there. When you see a shadow, this is for order block lovers, okay? When you see a shadow, what is a shadow? The pink area, remember the pink area is that large Tuesday, September 1st, 2026 regular trading hours, open range gap. That's the low of it here and the high of it is up there. Okay. Notice how the Wednesday September 2nd regular trading hours open range gap overlaps with Tuesday's and it creates this little different color.
See that? See that? This one's formed inside of this area here that's pink. This is a shared space. So, it's nesting. The area that creates the bleed over where it creates a slightly different hue and color. That's what I call a shadow. Notice how it changes right there and it anchors to a down close candle, which is an order block. That's how you know that order block is valid there. And you can see it rally right back up into the lowest octant and the lower quadrant of Wednesday's August 26th riot.
Knowing what you're looking for even in slop like this in somebody else's eyes. I can find setups in there using the stuff I'm teaching you here. But you have to be very nimble. And I'm teaching you not to require these types of setups. This is going to only satiate the the the gambler, the the action hound, the person that needs to be doing something right now or they don't feel like they're progressing or growing as a trader.
Most of your time is going to be in an analysis doing what I've done so far in this video, showing you where the data is, how to get the data, what to do with the data, what key PDAs are you looking at, what's the point of it all. And by blending all these things, what you end up discovering is you have the five pillars of algorithmic price delivery. That being the monthly, weekly, daily, macro perspective with keys of open, high, low, and close on those time frames.
Then you have the new week opening gap matrix and its gradient levels. And once you do these gradients, again, just be mindful that you want to take them off for journaling. Okay, the purpose is when you're journaling once you annotate a level like this and say you want to be uh you want to study how why this was in consolidation you want to show your chart have the information in it so that way you can get the context this is Wednesday's August 26 trading hours opening range gap Wednesday September 2nd reg opening range gap by having that we can now have a reference point and we can see where these things are in terms of when we do a screenshot.
Say for instance, you want to do a screenshot and you would go up to here, go there and then uh download image and that way it would populate your chart. Obviously, you want to write out any annotation like I'm I'm I'm so excited to see how that order block right there was supported by a shadow which was two regular trading average opening range gaps bleeding over together. That makes a very strong support or resistance level.
And there's no trend line that's necessary. If you were looking at just classic support resistance, folks, let's be honest, okay? Be honest. Now, you would have used this high here. So, you would have done this and it goes through it. How are you going to trust when you're going to buy it? When you think it's going to supposedly bounce off of that versus this is the bleed over. I'm trying to find right where that that that point is where they become an overlap between the shaded area red here or pink and this box here overlaps.
Now look at that compared to that. Much more precise. Much much more precise. And the same bit of business, you know, on on this area here where we have down close candles here consecutively. That's all one order block changing state of delivery is that opening price there. Extend that over. There's the order block being used there. There didn't touch it there. So now it's bullish. It's really going to send that higher and right on up into the lower quadrant of Wednesday's regular trading hours, open range gap.
Everything I just showed you tonight, everything I showed you will give you every facet of trading. Whether you're a swing trader on a daily time frame, weekly time frame, monthly time frame, short-term trader, one shot, one one shot, one kill. That means position trading taking a trade from one to five days hold time to intraday swing trader to scalper intraday or high frequency trader. Everything can work off the framework I just gave you here.
And if you would have gone through the mentorship properly, listen to everything I said in regards to what you're supposed to be do with this information. when you get the information, it's not like, oh, I'm going to look at it and that's that's all there is. No, you have to manage the information. And then by managing the information and keeping record of where everything is, that's trading, folks. I took all the uh the key levels off here and I got to make sure I turn this off here.
And now going back to my working chart, all those pieces of information are here with the exception of the open, high, low, close on the monthly, weekly, and daily, and previous week's range. I can tap into that anytime by simply going up here to monthly keys. So there we are. And there we are punching down below previous week's low right there during the macro time at 7 a.m. 6:50 a.m. 7:10 a.m. Interesting how that converges, isn't it?
[gasps and sighs] Oh my goodness. It's almost like it works like I described it would. [laughter] It's almost like I wrote Oh, almost said it. He's listening, isn't he? [laughter] Hope you found it insightful. Till talk to you next time. Be safe.
The words are the caption track's own and nothing is reworded or re-transcribed. Paragraph breaks are placed between sentences so the text reads as prose.
Free tools for your own script. No signup, no login.
Paste your draft and see where viewers are likely to drop off, with a rewrite for each weak line.
Paste the first 30 seconds of your own draft for a hook score and rewrites.
Check your draft against YouTube's advertiser-friendly guidelines before you record it.
Read this channel's public videos and transcripts, and download a writing brief for it.