Getting the transcript
Reading the captions from YouTube. A video nobody has opened here before takes 10 to 30 seconds; this page fills in on its own.
Getting the transcript
Reading the captions from YouTube. A video nobody has opened here before takes 10 to 30 seconds; this page fills in on its own.
The Inner Circle Trader · @InnerCircleTrader
This video has no Most replayed graph yet: YouTube shows one only once a video has enough views. These are the moments viewers replayed most in The Inner Circle Trader's most watched videos.
Most replayed moment at 51:50
3.7x that video's typical replay level
Okay? So, now we have two points of reference. Now, when I have this like that, I have two little sweet spots in the previous day's range and to the left of that, why? Cuz we're going to go back 3 days.
Said at 51:44
Most replayed moment at 10:06
3.2x that video's typical replay level
towards that of this buy side imbalance or side inefficiency, which is a suspension block, which has a volume imbalance on the high end and a volume imbalance on the low end. All right, so let's move into the lower time frames now. So, we're at a 1-minute chart.
Said at 9:58
The graph counts replays. It does not show where viewers stopped watching.
Words
10,194
Runtime
59:46
Speaking pace
171wpm
Reading time
42min
171 words per minute, between the 160 25th percentile and the 181 median of 349 measured videos. That distribution comes from the 349-video hook study.
Opening (first 30 seconds)
Folks, good morning. How are you? Happy Friday. Happy Friday. So, it is the last day of the week for trading, August 28th, 2026. Present time is 7:50 a.m. Eastern time. All right. So, I'm going to cover what I went through yesterday and how I traded the first day of Jackson Hole Symposium. we have this dealing range from high down to that low. Okay? And in that range, if I'm expecting price to go higher, and why would I expect it to go higher?
86 words, the words spoken in the first 30 seconds at 171 words per minute.
Free, no signup. See how the first 30 seconds hold attention, with rewrites.
Sentence shape
| Measure | This transcript |
|---|---|
| Sentences | 899 |
| Average words per sentence | 11.3 |
| Longest sentence | 106 words |
| Questions asked | 86 |
| Sentences containing a number | 31 |
Most used terms
Filler phrases
123 in total: like 58 · uh 15 · you know 15 · um 12 · kind of 8 · I mean 5 · actually 4 · basically 3 · literally 2 · right? 1.
A literal whole-word count of the same phrase list the Prepublish browser extension uses, so a phrase inside another word is not counted and a phrase used in its ordinary sense still is. It is a count and not a judgement.
What this transcript is
Every word below is the caption track YouTube publishes for this video, pulled from the video itself and reproduced unchanged. It is not Prepublish's writing, not a summary, and not a re-transcription: it is the video's own published captions. English captions, generated automatically by YouTube, in the video’s original language. Source: the video on YouTube. A channel that would rather this page did not exist can ask for its removal through the contact page, and it is removed.
Folks, good morning. How are you? Happy Friday. Happy Friday. So, it is the last day of the week for trading, August 28th, 2026. Present time is 7:50 a.m. Eastern time. All right. So, I'm going to cover what I went through yesterday and how I traded the first day of Jackson Hole Symposium. we have this dealing range from high down to that low. Okay? And in that range, if I'm expecting price to go higher, and why would I expect it to go higher?
If you go over to the daily chart, which I have upper right hand corner, okay, I'm going to talk about this just for a moment, and then we're going to take our attention down into a maximized view of the one minute time frame. So, this is the business I gave you a couple weeks ago about why we were going to reach for it to go up there and then it failed here. So, then we're going to turn our attention to this area here.
Now, you can probably see the gray area that shaded out. Some of you are asking what is the gray area in my intraday charts when I'm doing my executions. If you've been watching all the videos, you know that this is that area here. Okay. So I graded this buy side and balance sell sign efficiency from this candlestick's close up to this candlestick's low. That's what these levels are. But the gray box area is just simply this.
Okay, it's this the entirety of the range that would be the buy side of balance sellside efficiency including the volume and balance at the low. It's not a suspension block because there is no volume and balance at the high. It's just simple buy side of balance busy. So, I was originally looking for on the 24th. I wanted to see if it can actually on this day going into this day. I was wanting to see the high of this volume imbalance get traded to.
I I wanted to see that because if it can do that, then how it behaved there would be an indication whether or not it wants to go further lower or if it was going to start to run higher. And let me stretch this out a little bit. so when we add those levels again get those screenshot for the fib again that's what these lines are okay and when we traded lower and it didn't get to an objective I was thinking price could have easily get got to it didn't do it so the way I interpret price action using my PDAs, the very key levels at key times.
This indicates to me that the market is undergoing a return back to premium. So I'm going to look for price to try to go higher. So where will we expect it to go? Well, we can look at all these individual highs that form consequent encouragement of of this wick and the low of this cibby as a volume and bounce at the high bounce the volume and bounce low between these two candles. So, the cibby is a suspension block. A suspension block has a volume of bounce at the high and the low of it.
If we extend that over, you can see we are drawing up into that. So, I'll take that off. So, if it gets up to this volume of bounce, which it did yesterday, the next order business would be this wick consequent encouragement, which it got to and through. And then you're met with this gap here, which while price is bullish, it should show you something intraday, an area where you can go long in this, which send price higher.
Well, now we're trading below here. So that qualifies that if the market was going to go lower all through here, then we can use this as an inversion fair value gap. Intraday, you'll see shorts in here. You'll see a short there. And but now when we are no longer bullish because it's showing willingness to stay off any drive lower to get into this volume imbalance and then we're here, that means we have to change gears and go likely higher.
So looking for longs drawing back up into here once this volume of balance is taken out and then the next order of business would be this high and then remaining portion of this cibby. Okay, so that's what those levels are and this is the the basis of why I was looking for longs on Thursday which is day one of Jackson Hole Symposium where it can be a seek and destroy day. Day one of Jackson Hole Symposium is the highest likelihood of a seek and destroy day.
It doesn't mean it if it doesn't form on day one that it can't do it on day two. it just I'm looking for it to happen on day one because the commentary that's provided around it and from the people that are participating um it gets thrown out to the ether and then the market does with it what it does and it uses it as a a smoke screen and affects the what you believe is buying and selling pressure. [snorts] So, we're going to minimize that and now we're going to take our attention completely to the one minute time frame.
All right. So, we have this high, which is the buy side liquidity pool. I was looking for initially I was just simply looking for this high. So, there's a couple different things. There's a lot of lines on here. I understand. But this is why I trade naked. I understand these levels while I'm trading like I have experience knowing about as close as I can get without having the lines on it. So I I just it's an experience thing.
You'll know what I mean in a moment here. For instance, at 9:30, look at the lay of the land here. At 9:30, we open here. We open, we trade down. What is it doing? It's taking out sell side here. Then it rallies up. Takes out buy side here. It leaves this buy side. Notice it's not as high. Higher. Slightly lower. It drops down. When it trades lower, it's going down into that gray shaded area here in the background. See how like it's gray here, gray here, and then white.
Gray, white background. The gray area is that daily buy sign bounce sellside sign efficiency I was just talking about. So it's near the high of it and we're digging down into it. So we went low to clear out sell side here and here and we trade down into the upper octant. That's what this line is. This line right here. That right there. That's the upper octant of that daily bon balance sell sign efficiency. Let me let me show you.
Here's the poset balance on efficiency. The first level octant is here. So this is the upper percentile the high of it and the lower percentile is there. Consequent encroachment midpoint is that blue level there. Above that is the first octant above consequent encouragement. Then it's the upper quadrant. Then it's the last and uppermost octant 0.125. What is that price? 29,451. See that? That's this price right here.
So the first time we dropped down, it stopped at that level because it's not random. It's bullish and it's going to use that level. Then it rallies up from there to take out anyone that shorted with a stop-loss right there and came back for good measure to take out these highs with this run. And it went right up into the inefficiency that's over here part of the dealing range from here to there at that moment. But I'm expecting it to trade one more time to take out the liquidity here because it's seek and destroy likely.
So, it's going to go up, down, up, the clear stops, down the clear stops. And all you have to do is look back in price to the left. You'll see what it's sweeping. It's sweeping. It's sweeping. It's sweeping. And it does this like an expansion. It's like a what is that pattern called? Like a megaphone type pattern. Um, I think that's what they called it. I'm so resistant to uh retail theory. I can't my mind won't even go back to uh recall what it is.
[laughter] It's I think it's what it is. It's a it's like a it's called a megaphone pattern where it's small here and it goes higher, lower, higher, lower. It just gets bigger, bigger, bigger, bigger. So, what it's creating is in an opportunity where everybody that's trying to position, they're getting knocked out. So, you have to trade it very nimly. So what I did was I was expecting all the things I talked about with the daily chart likely pulling it higher.
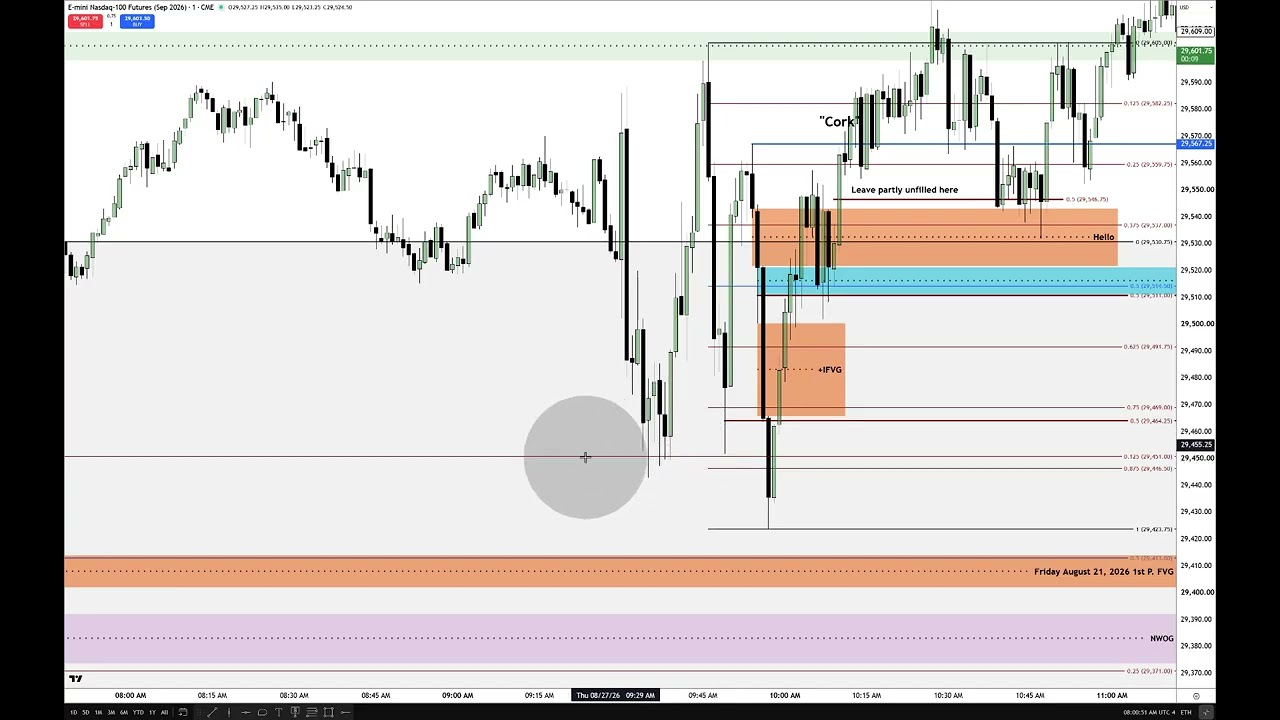
I was expecting it to knock out the stops that were formed in the upper octant which is this line right here 29,451. That low right there. We look at the bodies. Did they close at or below it? No. So that tells me this level is a key level and it's part of a day where I think a seek and destroy is going to happen. So this rally up, I want to see if it breaks lower. It breaks lower. It creates relative equal lows right here and then it rallies back up right up into a fair value gap.
Trades there, sells off aggressively. Beautiful run. That's a nice little short right here. There's nothing wrong with that. If you took that short and traded it and took out the um sell side there and that was your your closure or terminus, perfect execution. There's nothing wrong with that. Absolutely nothing. But if you're day trading with position size, well not size, but position in mind for like intraday swing trading, not like this is scalping how you got to liquidity.
That's not that's not bad. It's just it's you're scalping and it's nothing bad about that. You can make lots of money buying and selling all day long in a day that could be bullish or bearish, but I was expecting it to take out these relative equal lows and giving it the chance to trade down into first presented fair value gap. Now, when we're looking at price trading to a key level like this and the bodies are showing not any willingness basically to to get to the the key level and close below it, it's signifying that this right here is a low that it's building the narrative that it's it's going to go higher overall, but it could be subjected to a stop run.
Okay, a raid on liquidity after this rally here. And when you understand the economic calendar, Jackson Hole Symposium, day one, the whole week really, it can be wild. It can create all these really crazy price runs that are fun if you're on side, but if you don't expect that kind of weird volatility at weird different times, too, um it can take you by surprise. But here, because of the expectation I held, I'm expecting it to go below these lows here.
And it gives that little short here. Wonderful. I'm not going to go short because I want to know what I'm focusing on here. So, it could go down into this last Friday, August 21st, 2026, first got. I'm giving it the chance to do that. But not only that, I'm looking at from that low that formed in my mind. This is what I'm envisioning. that low down to the high of last Friday's first presented fair gap and that is the first fair bay gap post 9:30 Eastern time.
So in my mind, here's this blue line here. I'm watching this candlestick. Go watch and watch the video again. Okay, I posted it yesterday. I I showed the very short sped up version immediately on X to show you that it was done and then I gave a long compression after I got home. And yes, I was commenting during the live real trade. Okay. Sometimes I'm talking and because I'm talking I'm I'm carefully considering what I'm saying and I'll speak sometimes before I move the mouse to the key level or bit of business on the chart because I'm it's more important about what I say because if you've been studying with me if I if I say you know if if we're at this low right here and I'm saying I'm concerned about the consequent corrosion of the premium wick I want to see price get above What am I talking about?
You understand that this is a low that I'm piercing. I'm talking about going long. So, what does that tell you? I'm taking this as a false break below the low. And that wick right there, the middle of that, I'm looking for that to behave a certain way. I want to see price get above that. I don't always have to walk you through it. And I'm not going to be the perfect teacher in that regard because what I'm saying and describing is more important than what my cursor is doing.
Okay, that's why it's important for you to learn my language. If you learn my language, you don't need to see my cursor. I could talk about the chart and not even reference the specific minute marker. You've been here long enough, it'll be just that easy. But sometimes because I'm in a fast market, I'm in a market that is demanding my full attention and I'm caring more about the execution and management of the trade than pointing to very specifics because think about what I'm doing.
Like it's a lot to do this. Like I have to read the uh the interpretation of price, what I think it's going to do, how far it's going to go down here. And while this candlestick was going down, I wanted to see this candlestick close below midpoint. Now, I didn't draw that out on the chart, but my experience says I can look here and look here and in rough eyeball it in this vicinity. and it was not getting the close below that which if it would have done that then I would have waited for it to touch last Friday's first percent of fair value got down here soon as it would have touched the high of that I would have went long there because it would have satisfied taking the stops then it trade down to this discount array and then it would perform like this but because this candlestick went below here and it couldn't close couldn't close it below the midpoint between this low this low and the high of that because it couldn't do that.
The very next candle, I gave it a moment to see if it would just spike down there and do it. It didn't. And that's why I said, you can hear it like you can hear my concern in in the in the moment when it was happening. There's my fill right there. So it is below that low which is the minimum criteria for trading and buying sellside liquidity. So right here right below that anything at that price or lower you're buying where smart money buys and you're buying the sell stops. you're you're buying the the breakout artists that sell short on a breakout.
I'm I'm standing in front of them saying you're wrong and I'll take your lunch money. Thank you. And because this candlestick opened, it started to go down a little bit but then failed to continuously move lower. I said, I can't hold any longer. I got to I got to get in it now because once it starts going above here, it's going to take off. And it did. Why? Because of the day. It's the first day of Jackson Hole Symposium. because it's taking out liquidity here.
Where's it going to run? There. That was my first target. I had my limit order like one tick below the high just to make sure I was going to get that fill. And I wanted to see if it could eventually get to this area. I changed my terminus to that high which is noted here with buy side. So now when price was down here, I knew that if this was going to rip above this low and did it quickly, then I need to see it close above this wick's consequent encouragement.
That's this level right here. We get it there. I already knew the likelihood of this gap from this candlestick's low to this candlestick's high. If it's going to go up, it's going to use this as an inversion of fair value gap. So, two things happen quickly. This candlestick closed above this wick's consequent encroachment. Wonderful. We can take that off. I don't need to see that on the chart. You won't need to see it either once you know what you're looking for.
So, even though I have all this stuff on the chart, these are the things I was watching and or had noted on my notepad as I was managing the trade. And then I'm interpreting what price was doing as it got to each one of these things. We traded and closed above the middle of this wicks consequent encroachment on that candlestick and we closed right at the midpoint or consequent corroion of this gap. The gap is here. This candlestick's high.
This candlestick wicks low. There's no volume of bounce up here. So, moving it to there. The next candle we open trade up and I was saying that I want to see it close above inversion fair gap. Once it does that, that confirms that this is an inversion fair gap and there should be no reason for the price to trade back down. Why? Because it's so close to this running that stop and it's going to quickly want to run back up here and here to get that liquidity.
They they're not going to let them pull their orders. So, it's not going to spend a lot of time going back and forth. Let me go down here and get this here and then it's not going to do that. Not this close to that. So the other bit of business were when this closed above the inversion fair value gap that's here that confirmed it. This candlestick we open trade higher we went down into the inversion fair value gap tapped it here again.
So now this has fulfilled its requirement. The the other part of this was once it moved up here, my stop loss I rolled it to 29,501.75. Look at the low. You'll see it in the recording. It went within one tick. And I read a comment by a a viewer said, "If it would have been in a real broker, that stop would have been hit." Well, here's the problem with that. Everybody that trades futures, they all have the same low. They all have the same high.
It's not like futures is the same as forex. Forex, no matter what what you're trading with, from one broker to the next, they're all going to have different lows and highs. It's wild, wild west over there. Okay? So, a gentleman's market is the futures market. Everybody gets the same low price, okay? And if you want to use really tight stop losses, futures markets is where it's at. You try doing that in forex and they'll smoke you because you're trading in that broker's individual pool of liquidity.
They'll widen the spread and take you. That does not happen. Not that there won't be or is an absence of a manipulation in the future market. There is. But if you know what you're doing and you know what you're looking for, your stop loss can be managed in a way where it can get real close to getting to it. But it's not like, oh, look at this. Here's here's his here's his stop or her stop. Snatch. because the broker will cannibalize you.
The broker can't widen the spread. Broker has no control over price. Okay? They're a dealer. They're a facilitator, a fiduciary. They're they're they're the in between. Okay? So, my stop loss is right below that wick there and went down, got right to it. And if I would have been stopped out, if I would have been stopped out, I would have went back in immediately right there. And I would have put the full position back on again.
And then the stop would have been right below there. So for the folks that would have been, you know, arguing and talk amongst themselves because I see it in comments of other videos. Oh, he got lucky there. How many times am I getting lucky when my stop losses like right where it is and it never goes there? Like come on, man. Not to brag or anything, but my stop loss management is the best in the game. You just don't see anybody doing that kind of stuff.
But and it's 33 years, 34 years in November um doing it. And you get this experience by practicing how I'm teaching reading price action. Okay. So now if you look at what my my target was initially from the entry down here, it was this high. Why? Because it's seek and destroy. High low, higher high, lower low, and then reach for that high. Okay. If it's going to go there, I know that that old high to the left, to the left, to the left, right there, that high is a likely draw.
So if that's going to be the case where how far we go above this then I'm going to aim for that too. So watch what happens. I teach my pyramiding needs to be if I'm long it needs to be at consequent encroachment or equilibrium of the range that you're trading in or lower. If I'm shorting I need to be shorting at equilibrium or higher. And after we breach equilibrium, the halfway point of whatever I think the price run is going to be that I'm participating in to my target, once it goes beyond equilibrium, I'm not permitted to add more or pyramid.
It's just a rule of thumb and it it serves me well. Well, initially it's this. So, if you look at where my second entry with four contracts, here's the middle line or equilibrium of the range between here and there where I entered. Okay? So this becomes the new the new range whereas primarily it was this and this but it widens every time it takes the stops. So now it becomes this to that after my entry and I'm aiming for this high here which is the characteristic of seek and destroy.
What is it doing? It's seeking liquidity and destroying the hopes and dreams of those that are trying to profit. That that's that's what it is. Okay. So when we have the market using this range, is this entry sound based on the rules I just explained? Pyramiding new long entries, building the long position larger at or below equilibrium. Where's equilibrium? It's the blue line at 29,514.50 right here. See that? Rule of thumb while you're watching my videos, whenever you see levels that are anchored, like here to here, find that where it's anchored to on the left side and go straight down.
There's an octant upper quadrant. Octant middle level consequent encroachment octant lower quadrant octant and then the lowest percentile. So that's how you track all the levels. If you feel like you're getting lost all the lines in here, it's just simply a matter of finding the leftmost anchor point and go straight down. You'll see all the levels line up that way. But the uh the market then rallies up and back and forth in here.
And I I know that it's not likely to go lower because this inversion fair value gap and this wick right here. Look at that wick right there. See that? So this wick looks just like this. Okay, the upper half is what I teach with order flow, real order flow. Okay, you can you don't have to see any kind of gimmicks or anything like that. You read open, high, low, and close everything. This is why I tell all of you guys, you act like they're going to change something that's going to significantly take away the advantages that you have.
If you understand how the markets book price, they can't change these things, folks. It's it literally would undermine the whole the whole thing. Like the markets have to promote people's interest to buy and sell. So they're not going to wreck all that. They have a perfect little casino thing going on. Most people can't control themselves. Most people overlever. Most people overtrade. Even if they have a winning system, you'll lose because you're you're the person that's going to wreck it.
You can buy your son or daughter. And I've done this very expensive, very nice cars. And you know that they're going to listen to your advice, but they're not going to follow your advice. They're going to get there with their friends. They're going to go too fast. They're going to cross the yellow line, Cameron, and then cause an accident. So things are going to happen if you're not prepared. You can buy nice things.
You can try to make a lot of money in these trades and use a good model, really good model, but if you overleverage or if you overtrade or if you trade before you should be getting in or if you don't manage it appropriately because you're emotionally hopped up on what you can make or what you're afraid you're going to lose in the open unrealized profit, you're going to react emotionally, which is why I teach you to anticipate.
We're not reacting anything. We're not reacting. We're predicting. So, and every trader is predicting whether they want to admit it or not. Cuz if if you're trying to go long, you're predicting the price is going to go higher. Why? Everybody tries to circumvent the idea of standing on that ground and saying, "Yeah, I'm predicting the future." The reason why is because people hear that and think that you're some kind of nostra dumbass.
And nobody wants to be ridiculed. Okay? I like it because it causes conversation. It causes more people to come to my channel. But most people don't have thick skin like this. And they don't have the skill set that I can stand and thumb them in the nose. Like come on. What are you going to do about it? [laughter] What are you going to do about it? Nothing. So we have the upper boundary of this wick. When price is above it and I'm bullish or we collectively are bullish, the upper half of that wick should support price.
That means the body should stay in that section where I now have highlighted blue. You'll hear in the video where I'm calling it live with a real live trade. Okay. Um it's not an after conversation. It's it's me really focusing on a market that could it could pull a fast one on me and get me. So, I want to be focusing on that, but yet still make it educational. And when it was hammering around in here, I didn't I didn't like this drop like that.
I I admittedly was like, "No, I don't like that. It's got to show me something here." And what I didn't like about it was this close was right below the middle of this upper portion. That made me nervous because it it's usually indicative that it's going to try to probe a little bit lower and I had to have a whole lot of faith and lean on what I know that if it does go down there, it's going to be a wick and it's not likely to touch the inversion fair value because we've done this.
We've done this and we tried to get to it again but failed. So what is this midpoint between the high of the inversion fair value gap and [clears throat] the middle of this wick between that? That's event horizon and I'm reading and interpreting that that wick right here. It it didn't want to put a body down there. So, it's telling me everything is on side for long still and just endure any kind of little wicking action that goes on in that until we get here.
We open, we wick down and went within one tick, one tick with a real broker. No matter what you look at, look at your [laughter] everybody that trading real money. Look at your low on that candlestick at 7 minutes after 10:00 a.m. Eastern time. What's your low on NQ for September delivery contract? It's going to be 29,502.0. Everybody has that price. It's not 4X. Okay? It's not Forex. If I would have had that stop loss and I was trading forex, the broker would have widened the spread and took my stop.
That's exactly what would have happened. Period. So, a gentleman's market is the futures market. You're a cowboy, you trade forex. So now, because I was aiming for this, this entry doesn't fit the criteria for me to be buying at or below equilibrium of the range I'm trading in from where I'm entering and where I think the uh the move is complete for me or terminus initially was my terminus was here. Before I started the trade, I already had this idea floating that if it shows a real strong willingness to get up here, I'm going to then put something up here.
It won't be the full position, but I'll be looking for something like a runner to take out that high, which is again that higher there. Okay. So, this gap, this green area here is that civvy. It's a very long explanation for something that's very, very complex. And this is why I tell you to avoid Jackson Hole Symposium on on especially the day one because there's going to be a whole lot of things said by people that are not elected and they're trying to influence world trends, global trends and uh these globalists.
You they they they pay for what they want and I'll just say it like that. Okay? So there's a lot of influence because of the money. That entry right here, look right here. That entry doesn't fit the criteria for entering at or below equilibrium because the blue level here 29,514 half which is the measurement of this high and that low if I want to be buying and pyramiding long larger positions I need to be doing it at or below that blue line.
That doesn't quite fit now does it? So I messed up didn't I? No. At this point when I was doing all these things in here, I was committed already that I felt that it could potentially get up to that level. So in my mind, I envisioned this level here down to that low halfway. I just rough eyeballed it. It would be higher than this. And we'll see it by proof by raising this up to this. Watch what happens. That's good enough for government work.
The blue line now becomes here. It's slightly higher. Now watch. What is my entry in regards to that? It fits. Oh, you're just form fitting. No, dude. If you're you're hearing that by what I just said, you're too new here. You're too new. You are too new. I've taught this stuff. I taught this behind a payw wall, okay? In front of an army of people in literally a small nation. They'll come out here and tell you, "Yeah, that's what he taught." So, it's not me just saying, "Well, here's what I did." Look at what I was doing in the execution.
You hear me think about these things as it's happening on the fly. You see me reacting to things that I did not want to see because it's in there with real risk. I could do it wrong. I could be wrong on a day that demands highderee focus, but yet I'm still trying to teach you and illustrate things before it happens why I should do something and why it shouldn't do it. Okay. So, one of the commenters, oh, two of them actually said, "These are your best works.
These are your best videos." Well, yeah. I mean, I I I get it, but just know that we're not going to get sweet uh sweet talked into. Now, do it live in front of me so I can copy you. I'm never going to do that, folks. I'm never never never because I'm gonna be honest with you. If I would have been interested in buying down here and I would have tried to get my fill, I'm trying to get in with however many of you are trying to get that same price.
And price isn't going to wait for that. And it's going to cause me to have a a a poor fill. I won't get my price. So when I'm doing things, I'm doing it where I know I don't have to compete for the same price with all of you. And when you get to understanding how these markets really book, that comment will make a whole lot more sense. When you're brand new, it seems like a copout or an excuse. It's not. It's simple market mechanics.
We all want to get in at our price, but all of us can't get the same price if we're all looking at the same one at the same time. We can't. We might see the same price move expecting to see it begin around a certain level and go up to a certain level and that's great. But we all cannot get the same price. If all 2 almost three million people that follow me wanted to get the same price that I'm trying to get, I'm not getting filled.
[laughter] Okay? I'm not going to get filled or it's strongly likely that I won't get that price. So, why would I want to dilute my efficiency by allowing all of you to piggyback on the very price I'm trying to get? I love all of you dearly, but I just don't love you that much. Okay? There's a limitation to this. Okay? And you got to be practical. So, from this position here and then aiming for that initially and then stretching the boundaries to here, maybe reaching out for that buy side.
That's what I envisioned as now I'm still able to go long inside of this idea of buying on the basis of this upper half of that wick because price should support it. Look at the bodies. Did the body stay inside of it? Yes. We opened right here and showed a willing to rally up. That was good. You'll actually hear me say yes. Good. That's what I want to see. What was I referring to? Not just simply because it was going up, but because we opened just slightly below the middle of the upper half of that wick.
And then it showed a immediate response that once we did a little bit of a, you know, suare below um that wick and got real close to my stop loss and then it started rallying up like that. That was to me, okay, we're done. This wick now becomes a barrier or boundary. And what I mean by that is this. It's the same consequent correction of this, okay? But slightly lower. Watch. I'm going to take this whole idea of measuring that wick.
I'm going to apply it. Take that part off. And we're going to put it right on this candlesticks open. And then take this over here. Look at that. Okay. So, once it did this, I felt confident that anything now is just simply going to be moving. The same logic I used with the upper half of that wick. Same thing here. I just don't have the time when it was doing all this stuff to draw all that out because I know I'm going to go back over the chart.
I'm going to explain it to you, but I don't have the time to say, "Okay, this is what I see. This is what my experience says." And I draw all this the whole time. I'm I got to watch the the chart, man. Like, I got to behave like a trader with real risk in in my hand. I have to manage these things. All these types of explanations can be done after the fact. And it doesn't indicate illuh or illustrate hindsight. you see me executing, Jack.
Okay, here's the I mean, think about it. Nobody else is explaining this kind of stuff like that. They'll just say, "Here's a trade I took." And many times they're using the hypothetical position box, you know, rectangles on Trading View. That's not a trade. This is a trade. This is a trade right here. This is a trade. And the logic is here. Watch. I'm going to take this line and thin it out right there. And I want the color to be very very very very thin.
So it'll be there, but it'll be like a trace element. Let's talk ground. So I'm fasting while I'm talking to you. So if you hear it, just pay no mind to it. So when this candlestick did this, I was like, "Yes, okay, good. I like that." Now I know that even if it comes back down again, it's going to be encased inside this portion of that wick. What do I mean? The same thing I did with this wick over here. Watch. From the open of that candlestick down to 523.75.
So, let's do this. 23.75. That's what I'm looking for. That's not what I'm doing. Okay, I'm getting confused here. I [snorts] need this to be right on that level right there. So, from the open of that candlestick right here down to half the wick. That's this line right here. It's very, very, very fine, very fine line. I'll darken up in a moment. Okay. So, I think that's about as good as I'm going to get it. And then there.
So, I'm looking at this with the expectation and anticipation. Anticipation. You don't know anything about that. The um this wick we open, we trade down. We wick down in and this right here, it trades right into it, but doesn't violate and close and put a body down or even leave it in the upper half. Wonderful. Next candle, we open. We trade down into that. What's going on there? Same thing. It's respecting this wick in its upper half right there and this one too.
So when this candlestick closes, we can expect and that's if you hear me in the in the video and yes, it's live. I understand sometimes I'm going to do things that looks too good to be true. Thank you for the compliment. I worked real hard over the last three decades to get here. Okay. So, I want to see this candlestick be a strong large upclose candle, a big green close candle. Okay. And I was already down here. I was illustrating that I want to see in there.
Okay? Take the audio commentary out. Watch that video of me executing again. You'll hear me talking even though you don't hear me talking because of what I'm pointing to, what I'm illustrating. I'm drawing all kinds of uh attention to certain things. And I'm doing this and I'm pointing to here and I'm pointing to here and then I draw a smiley face because I I knew I was going to speed the video up like I told you in the video that once you see the sped up video, you're going to know that down here.
I already know it's going to go up here and take that and take that out. Why? Because I'm drawing a little smiley face on the on the chart. Like I know it's going to behave this way because of everything I just outlined here. This whole business I just talked about with these wicks, that's one chapter intro of just using Wix. It's just an intro to one full chapter. Like there's so much that's available to learn from me.
It's it's real important for you to slow down. Okay? slow down. Because if you do everything right the first time, you don't have to go back and backpedal and go back and and look at things and be like, "Oh, well, you know, I rushed through that and I just want to get to the next video." Like, it's going to be happening in your hands just because you watch my video. You have to take the information I'm teaching you and then go back through your charts.
You'll see me doing this next week. I have to do this with my son Kaden. I'm going to do Monday through Friday, every single day. I'm going to explain to him what he's supposed to look for, what he's supposed to log and what he's going to do with that information for back testing, how it will be useful going forward, but what you're supposed to be annotating on your chart, what is important about it, why is it salient to you at your stage of a beginning trader.
If you're someone that's floundering, you're having a hard time finding your way through all my content, next week's information is going to be very beneficial to you. But anyway, this candlestick behaved exactly as I was indicating I expected to see. I anticipated it. Large up close candle taking out that and then it fell just short of here. Then this candlestick I knew and you can hear it in here. I'm I'm basically saying like I know it's going to go there and knock it out and it hits it.
Bang. Okay. So, right above right underneath that little hand. You see it? There's the fill. Okay. There it is. And there's the the pyramid entry in discount in the entry down here. Okay. So, uh you can't pull those up while in live action if it was done in market replay. Just want to toss that in there for extra credit. No extra charge either. How about that? Then it started behaving weird in here. Okay. My intention was all right.
I want to see the majority of my position come off here. I wanted to see my five of the six remaining contracts of you know what I want to see because I took a partial here with four. So four um yeah four contracts came off. So that means I had six of the 10 contracts that I built up. The original position entry was six contracts long adding four pyramiding in discount and then taking four off there just above that high and then now I had six contracts still from this point on and I wanted to take off five at this high and then let us let it see if it wants to give me a runner to get that other target here which defines this range from that low up to that high here and that would be terminus.
Originally, this was terminus for me where I wanted to get everything off. But because of how it behaved in here, I felt fairly certain that it was going to get here. Once it got above here, you'll see my exit. See it? Look right here. It's the high of the imbalance that's shaded in green. See that? That's why I chose that level because if I believe it's going to go up here, it's going to touch the high of that green shaded area, which is this gap right there.
And then the buy side remains. Well, it just so happens because it's wild and woolly, it does get to my target, it gets real close to it and then it comes back and stops me out. Now, in hindsight, permit me to use this now. Okay, in hindsight, what I did less than optimally was I should have put my stop loss right at this candlestick's open and not leave it down there. See where this See where the stopout is here. there because if price is going to use this as a draw, it should not overcome this candlestick's open because the last two up close candles.
And what this is indicating is this is becoming a order block. So I don't want to be holding a stop below change and stay delivery, but I just let it go. I just let it go. And that's that's the reason why I should have had my stop loss at that price level or just above it because if it's going to go there, it's going to go down and use this entire range of these two candles as an order block. And then it goes right up to the middle of that shaded area in green, which is a inefficiency.
So consequent encroachment protects price from going higher there. And it trades right back down to that same gap here. Now watch. Look at this. How's this support and resistance? What's this candlestick reacting off of? That's support and resistance. What is that? Look at that. That's why I have it in here. I posted this on X faciciously. Hello. Where's Where's this? Where's this coming from? From the pages of good old ICT and the logic that he teaches.
Everybody else is going to see this as a bare flag. What's unfinished business? That high, that liquidity. Okay. So, now I'm going to take the lines off over here so it cleans the chart up a little bit. I know this video is getting really bad. Uh, also I forgot to mention this this little cork uh idea was because it was creating this little block of price action. Usually when you see a bull flag, it'll be slightly sloping down.
This is just like building a big square and it's slightly sloping up. So to me, I always envision that as like a cork. And what is that like opening a bottle of champagne? If you if you pop that cork, you know, it's going to build up all this pressure and then it's going to clear and go higher. Well, that's what we saw happening here. Okay, it is was a very slow bleed before it got to it. So, right there, beautiful illustration of again using my logic, not somebody else's borrowed, rebranded crap.
And I talked about leaving partly unfilled before it gets to my target right here. And that's basically this. from here to here. We want to see that portion stay open. We don't want to see any of that fill in because essentially what this is is the upper half of this inefficiency. We already used it here with institutional order entry drill. That low was pierced by right there. And that's usually what you get. And if you go back and listen to my paid mentorship and I'm talking about fair value gaps in price runs and where we're at in reference to uh equilibrium or the high end of the the run and it's close to your target, you rarely get the gaps fill in before it goes to target because it's in a hurry to get to the liquidity or the objective.
And you can see eventually even though it was slow drawing out, it was just not allowing it to go lower because they were going to go after those stops above here. And they ran up real close to that high and then dropped it down. So this was engineering liquidity to get more people to build buy stops here. What is that doing? It's engineering people to buy at a high price while they drop prices lower down into a discount.
Now they can take prices higher because they know they have willing participants that went short and definitely short here. And where they're going to put their stop loss at here and there and just above for people that look at charts and say, "Well, this was resistance." So I better have my stop loss above that. And then when you see price action like this from that lens, everything else is nonsensical because it runs from here all the way up, trades into an order block and a fair value gap right there. down into it and it rallies up and then you like that.
Only the best production quality right here. No sound box required. I don't even have to push any buttons. Just see how that works. Takes the liquidity out and then look what happens. It just behaves in a weird way. Just awfully strange. It just comes down for some some unknown reason. Uh it uses the gap here and then tries to get to here but can't. Is that bullish or bearish? It's bearish. price trades down. Where's it trading back down into inside of that gray shaded area which is the daily chart buy side efficiency?
We're getting a reaction off of that. But more specifically, what is it keying off of that I gave you yesterday? Well, let's just go over here to upper half of this wick. Anchor to the original one right there. And I don't know where the middle pump is. Well, let's just bar like that. There's the midline. Okay. Okay, there's the wick. There's your midline level or consequent crunch of the wick. Look at this. Is it touching it?
Nope. Is it inside the upper half of the wick where the bodies are? Yep. But are the bodies touching or the wicks touching consequent encouragement? No. Is that bullish or bearish based on what I teach? Bullish. Minor buy side. Minor buy side relative equal highs. Look at the look at the momentum off of this. We're trading inside that gray shaded area here. All this graded area. And then it comes white here. This is the high.
This is the high of that daily bon balance sell efficiency. So it's going to have a lot of energy behind that. And it's also occurring right before the macro. And in macro time right there, bang 50 starts spooling real quick. And we have all of this is an order block. All these consecutive down close candles. That's a change in the state of delivery. So, if it returns back into this level, then we have a chance of seeing higher prices.
I'm going to take this blue line off because it's simply just illustrating an old high. We'll clean that up. Uh, we're going to take this off. We'll take this off. And scrubbing on over. Look what's Look what's happening here. Changing state delivery. order block rallies up consolidating inside that old gap that's shaded in green buy sides here buy sides here so now we can do this I didn't trade any of this obviously can you see boom runs through that and ultimately watch listed high quality production okay look at that it's like this stuff almost works sometimes This is such a beautiful price run.
And then we go back into the range again. Where is it trading to? That's the high of that daily buy on balance sell efficiency again. It's a daily PDA. It will have a reaction. It's tradable. Now look at the lay of the land when it trades down into that. Look to the left. Go back through all the price action. What's the first thing that jumps off at your at your u observation relative equal highs to the left of that it's a cibby and it's inside of that shaded area.
That's a gap. So going above here getting into this gap and into this old inefficiency this level right here the low that shaded green area. High probability. High probability. Look at this. What is this? That's a cibby that's been overtaken and we have a shift in market structure right here that high right there. So when we drop back down in this becomes or has a strong probability becoming an inversion fair value gap and I'll extend it to the right.
Okay, right here's a buy. Aiming for the low of that. Look at that reaction there. Look, look. Pyramid. More to it. Pyramid. More to it. I wouldn't do that. Well, that's you. You're not ICT. And it rips up. Bang. Hits it. Consequent of the the green shaded area. That's the old gap looking to the left where we showed earlier. Look at that reaction there. Beautiful price run. Look at that. Look at the time. Look at the time of that.
Ready? There's macro. Okay. And I actually talked about this in trader roundup yesterday where there is the 250 to 310 macro for final hour regular trading hours. There's that's macro one. And then when you get to 315 315 here starts it all the way through the 345. You can see what's going on. They're running it. So what are they going to do? They're just going to keep on, you know, pushing it higher. What are you going to run out?
The high made right here. Look at that. And then we get into the last 20 minutes of trading. Where is it at? 40 340. Right there. Okay. Rips. And then right here at the final 10 minutes of the hour, this is merger on close MOC. Okay. What are they doing? They're using that last 10 minutes to supercharge show Sugar on top running up in there into some random level which is the inversion fair up on the daily chart. Oh, what are we talking about?
What are we talking about? Look, it's a weird bounce, isn't it? Weird. Who could have expected that? Oh my goodness. If I could have only known that's this gap right here, the inversion fair value gap that I talked about on the daily chart when we look for posing PD arrays. There's that. And this is the consequent encroachment of that wick. Look at that 29,662. That's where that level comes from. That's what you're seeing right here.
Okay. So, I take that wick off here. It'll disappear on the big chart to the left and it's gone. This entire range here is this small little gap. Small little gap right there. And this wick. And we're inside of this suspension block between this volume of bounce low, volume of bounce high, volume of bounce high, volume of bounce low. So there's two volume and bounces that make this cibby a suspension block. So it can trade up into these areas.
And if it clears this, we want to see if it can continue and go to the halfway point of that range right there. It's a very faint line. Darken it back up because I needed to use it in the future again. So, we want to see if it can draw up and it can it can be bullish up to that point but yet still be bearish long term. So, this level here changes the tide to short-term bullish to intermediate term bullish. And then we could look for potentially trading above and getting up into this inefficiency once more on the daily.
But just a beautiful look at look at the illustration in delivery price here. When we got up into that gap right here, which is an inversion fair value gap, it gets the consequent encouragement. It trades just above it a little bit, but where's the bodies saying I can't touch the consequent encroachment. So if a market is bearish and it goes into a key PD array, key being it's daily. We extended ourselves here and the bodies can't even touch or lay or above at consequent encouragement.
What is it doing? It's respecting the lower half. So if there if it's respecting the lower half, is that bullish or bearish? When you're bearish, that's exactly what you want to see it do. There's a final little kiss right here. Small little inversion for everybody got there. I'll draw it for you. Look at that. Look at that, man. Come on now. Come on. Give it up for the old man. That is absolutely perfect. Find that in white off.
Find that in anything else cuz you don't see it. You don't see it. But it just keeps repeating over and over and over and over again here every week, every day, and it won't stop. That should inspire you. that should encourage you. So, that's going to be it for today. Um, hopefully that was a a well-rounded explanation as to what was going on, why it was chosen to be a, you know, a good idea to trade. And look at this.
Look at that right there. Consequent encouragement inversion fair back up on a daily chart. You're going to get runs like this off of key PD arrays on a daily chart. I want to know when there's really good price runs. You always seem to know when the big runs are going to occur. You got to find that daily chart. You got to measure things on the daily chart. Wicks, consequent encroachment, old highs, old lows, inefficiencies, even though it's right here.
Your supply and demand guys, they're not going to look at that. They're not going to look at that, folks. They're not going to grade the wicks and split them in half and know where the upper half is and lower half is in reference to where the price should go. They don't do that stuff. Nobody does that kind of stuff but us. And eventually more time we keep throwing it in their face, more of them are going to come and they're going to be converted to the truth.
The bottom line is you don't have to like me. You don't have to. But you have to respect the hustle because what I got is the best thing going today and ain't nothing going to outdo it now or in the future. Never was it better in me and nothing better than in the past that than what I have here and nothing will ever be better because what I'm talking about is the market. It is the market. It is the source code. It is the very thing that makes these markets tick and where they stop and where they start running and why it won't do certain things.
I got a rhyme and reason for everything. And my executions prove it. So, I think that's going to be it. Look at that. Look at that again. The bodies. The bodies. Nope. Nope. Nope. Nope. Right back down. Where's it trading to? Where's it trading to? Back down to that old inefficiency. And it sweeps the old high right back here. These old relative equal highs sweeps that because the the algorithm refers back to okay, there was interest back around those old highs before.
Maybe someone's picked up on that same thing, so they're going to sweep it and we get into a little bit of an ugly price range. But look how much time it's spending inside that old inefficiency. Look at that. Isn't that neat? Like that's support and resistance. That's what you're going to say, right? Come on. Come on. And then now here's where we're at. So it's a Friday. It's Jackson Hole Symposium day two. Um, just expect the unexpected.
Just expect the unexpected. Um, I don't I don't want to subscribe to the idea that TGIF is today. I I don't want to do that. I think that we're probably going to press towards 757, which is over here. Okay. And uh, you know, we'll see if it can get any kind of measurement up into the 29,830s. Until I talk to you next time, be safe.
The words are the caption track's own and nothing is reworded or re-transcribed. Paragraph breaks are placed between sentences so the text reads as prose.
Free tools for your own script. No signup, no login.
Paste your draft and see where viewers are likely to drop off, with a rewrite for each weak line.
Paste the first 30 seconds of your own draft for a hook score and rewrites.
Check your draft against YouTube's advertiser-friendly guidelines before you record it.
Read this channel's public videos and transcripts, and download a writing brief for it.