Getting the transcript
Reading the captions from YouTube. A video nobody has opened here before takes 10 to 30 seconds; this page fills in on its own.
Getting the transcript
Reading the captions from YouTube. A video nobody has opened here before takes 10 to 30 seconds; this page fills in on its own.
Aleks Rosme · @aleks_rosme
Words
2,043
Runtime
13:16
Speaking pace
154wpm
Reading time
9min
154 words per minute, below the 160 25th percentile of 349 measured videos. That distribution comes from the 349-video hook study.
Opening (first 30 seconds)
There is a hidden force behind every move in the markets, yet barely anyone truly understands it. People prefer to believe they trade with the banks, run stop losses, and follow smart money. The real price driver behind every major move is gamma and dealer hedging. But, what if I told you there is a way to track this dealer hedging on a daily basis to capitalize on it and to catch these high edge opportunities. And
77 words, the words spoken in the first 30 seconds at 154 words per minute.
Free, no signup. See how the first 30 seconds hold attention, with rewrites.
Sentence shape
| Measure | This transcript |
|---|---|
| Sentences | 139 |
| Average words per sentence | 14.7 |
| Longest sentence | 44 words |
| Questions asked | 15 |
| Sentences containing a number | 21 |
Most used terms
Filler phrases
56 in total: you know 23 · uh 12 · right? 10 · um 5 · actually 3 · like 2 · basically 1.
A literal whole-word count of the same phrase list the Prepublish browser extension uses, so a phrase inside another word is not counted and a phrase used in its ordinary sense still is. It is a count and not a judgement.
Run the check on the words above: where attention is likely to drop, with a rewrite for each weak line. The free check shows the scores and the one issue costing the most.
What this transcript is
Every word below is the caption track YouTube publishes for this video, pulled from the video itself and reproduced unchanged. It is not Prepublish's writing, not a summary, and not a re-transcription: it is the video's own published captions. English captions, generated automatically by YouTube, in the video’s original language. Source: the video on YouTube. A channel that would rather this page did not exist can ask for its removal through the contact page, and it is removed.
No Script X-ray for this video: YouTube shows a Most replayed graph only once a video has enough views.
There is a hidden force behind every move in the markets, yet barely anyone truly understands it. People prefer to believe they trade with the banks, run stop losses, and follow smart money. The real price driver behind every major move is gamma and dealer hedging. But, what if I told you there is a way to track this dealer hedging on a daily basis to capitalize on it and to catch these high edge opportunities. And from now on, I'm going to have my own Discord server.
Link is going to be in the description where I'm going to drop my gamma levels, where I'm going to explain more valuable things and drop more value as I always do. So, check this out. In this video, I'm going to demonstrate to you how I use gamma and how I build my edge around it. But, before we get to talk about how I actually use it, let's talk about what gamma even is. Cuz most of people who heard the word either skip past it or think it's too complex to bother with.
Of course, it's way easier to believe you trade with the banks, draw a few lines and the boxes on the chart, and especially when everyone else around does it, you know? But, um let's talk about options. You probably know what an option is. You pay a premium, you get the right to buy or sell something at specific price. Now, every option has something called delta. Delta tells you how much the option price moves when the stock moves $1.
If delta is 0.5, the option gains 50 cents when the stock goes up a dollar. Gamma is just the next layer. So, gamma tells you how fast delta is changing. But, here is why it matters and why most people miss it completely. When you buy an option, a market maker is on other side of that trade. They sold it to you. And now they have a problem. They're exposed to this directional risk, and they don't want to take this risk on, right?
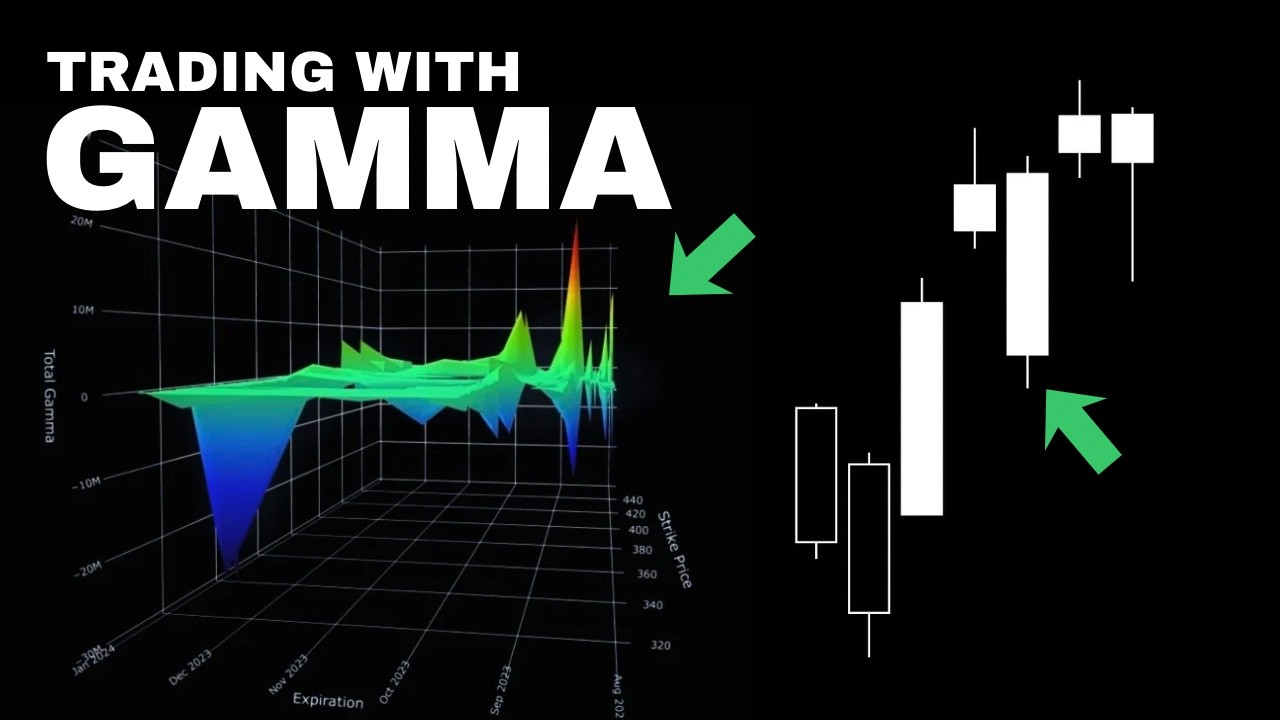
Their job is to create markets. So, what they're doing, they have to hedge. They buy or sell the actual stocks to offset their risk. So, this process is called delta hedging. And as price moves, their delta changes because of gamma. So, why does this actually move markets? So, imagine a massive amount of call options are sitting at this 710 strike on QQQ, which is a Nasdaq option contract. Market makers sold all those calls.
To hedge, they need to buy QQQ as price approaches 710. So, because their delta is increasing and they need to stay neutral, that buying pushes price up, which increases delta further, which forces more buying, and you get this self-reinforcing loop where price gets magnetically pulled toward that strike. This is called a gamma squeeze, and the opposite happens on the downside. Large put positions force market makers to sell as price drops, accelerating to move lower.
And these are not random levels. These are not levels drawn by some random guy's support and resistance. They come directly from where the options positioning is heaviest. This is why they work so good. This is why price respects them over and over again. Now, let's talk about how I actually map this out before every trading day. So, there are a few key levels that I look at, and I want to explain each one because people misuse them constantly.
They treat them as support and resistance, which is a big mistake. So, starting off, call resistance and put support. These are your macro boundaries. Call resistance is where the heaviest call open interest sits, where dealer hedging creates a ceiling. Vice versa, put support is the floor. So, these levels, they are not going to move much day to day to day, you know, um you can treat them as your weekly range, monthly range, whatever.
These are the biggest levels and they're the heaviest. HVL, high volatility level. So, this is one of the most important and most misunderstood levels. HVL is the strike where gamma flips. Above it, dealers are long gamma, meaning they dampen moves, they fade moves. Below it, they're short gamma, meaning they amplify moves. So, when price is above HVL, expect mean reversion, choppy, grinding action. And when price is below HVL, expect acceleration, trend-based, bigger ranges, right?
But, do not solely rely on gamma conditions. Sometimes, like this month, we've been all the time under this positive gamma, and you saw the result. We've had the craziest rally that I ever seen. You know, you always want to combine these um information, you know, this HVL, gamma flip with other conferences, like uh uh dealer positioning, options matrix, your overall macros. You know, you always want to stack these conferences up.
Zero DTE levels are the same concepts, core resistance, put support, HVL, but calculated only from options expiring that same day. And on any given day, zero DTE options represent a massive chunk of total volume. So, since 2022, we have zero DTE options introduced to us, and nowadays, they are 40-50% of the whole volume, you know, total volume in the options markets, which is total madness. So, they are tighter, more reactive, and often more precise than the all expiry levels.
You're going to see be respected intraday. Another levels that we're going to use are GEX 1 through 10. So, GEX stands for gamma exposure. These are the top 10 strikes ranked by absolute gamma exposure, where GEX 1 is the heaviest, the strike with the most dealer hedging activity around it. GEX 2 is the next, and so on. So, here is important to understand. These levels are going to be your targets. These levels are going to be your confirmation, but it's not going to be your trade narrative, right?
So, you build your trade narrative based off main levels, all expirations, 0 DTE, gamma wall as well, right? I forgot to mention. Gamma wall is the strike where the single largest positive gamma concentrates. So, think of it as a strongest version of call resistance, a level where dealer hedging pressure is so intense that uh price tends to stall, bounce, or consolidate around it. Let's talk about real examples of the trades that I took this month.
So, here we can see this is my dashboard, where I derive all of my levels. So, we are currently on QQQ. As you can see here, these are our key levels, right? This is our spot price, call resistance, call resistance 0 DTE, uh same thing, you know, HPL, put support, put support 0 DTE, but here, you can see all of these beautiful levels. So, I got plenty other information here, but we're not going to focus on this right now.
Let's just keep it very simple. So, here on the dashboard, you can see all of the levels that are available to us. You can see call resistance, put support, same for uh 0 DTE with HPL 0 DTE, gamma wall 0 DTE, and all of the gamma exposure levels. Uh I already marked them up for this day. So, this is 12 May New York open session on QQQ, which is a Nasdaq. You can see what happened inside this session, right? So, treat this as your daily range, right?
From 710 to 705. If we're going to break this HVL 0 DTE, then we're going to go and test this uh core resistance 0 DTE, which is uh 720, I believe. I forgot already. So, here we can see that we opened right at this gamma exposure level two. We had some support here. We found support. We went directly and tested this gamma exposure level three, but it's not enough for me to take a trade yet. You know, I want to see I want to see some major levels, major congruences to play out in order for me to take the highest probability opportunity possible.
So, here as you can see, we came right into that 710 level, tested it, tapped it, and then we have this initiation through that gamma exposure level three. So, for me, it's not enough to take a trade right from here because we have this level in the way, right? So, once we break that level, once we build some value, which is also important, you know, we always combine all of these, you know, those those two worlds of futures and options worlds.
So, once you have this initiation, once we build some value, we came back right into that gamma exposure level three, and we sold off. So, I took this trade this week. This is how it looked on my order flow platform. So, here as you can see, we've had this overnight high, you know, uh this volume area high, we came out of this and for me I did not sell here, you know, because I've had this zone um you know, in my way.
So, I wanted to us to see and break this zone. Then we came back to this gamma exposure level three, which aligns with our cash session volume area high. And then I sold here. My first target was uh around two R and my second target was around 29,100, which is uh um this uh puts puts support 0DTE on NQ, right? So, you want to combine these two. Let's break down one more trade that I took on Friday. So, in order to do this we analyze data from Thursday.
You always want to do this because this is end of the day data. And here we can see this call resistance 700 0DTE 700, you know, pretty major level. And what I can see here is that we have no gamma exposure above this 700 level. You see that? This is very concentrated level. And for me, if we're going to break this level, we are going to see some initiation to the upside. So, here on TradingView I already marked them up.
Here you see we opened right around this level. You see how we were bouncing, you know, here we found some resistance, then tried to break it, we broke it, then it turned to support. And then, you know, for me, when we open this way and we break this level violently and here we have no other levels, you know, it's basically all-time high movement, you know, there is nothing there is nothing to the left. For me, that's a major major are sign.
So, what I done here I took this trade right here. So, as you can see this is my zone from from order flow. This is my zone from RTH session volume profile. We broke that zone that was aligning with core resistance 0 DTE / core resistance, all of that, you know? Then we formed this LVM. We pulled back and this is exactly at this point I took my long with 1:2.5 R risk to reward, right? So, I was targeting some levels from NQ exposure and I fixed my trade around 704 when we converted into QQQ.
And you know, most people who watch this video will think they get it and they will write them down. They slap them on the chart and wonder why it stops working because it's not about the levels, it's about understanding the why behind them. Why price gravitates to certain levels, why some days are choppy and some days trend hard. This is the edge, you know? And in this video I tried to explain this to you. So, if you want to follow along as I work through this every day I've got a Discord community since now and I'm going to drop my pre-market gamma analysis, levels I'm watching, and my thoughts, and let's see what we can do.
I've never done this and you know, this link is going to be in the description and if this video made something click for you, you know what to do. See you in the next one.
The words are the caption track's own and nothing is reworded or re-transcribed. Paragraph breaks are placed between sentences so the text reads as prose.
Free tools for your own script: paste a draft and see where it stands before you record it.
Paste your draft and see where viewers are likely to drop off, with a rewrite for each weak line.
Paste the first 30 seconds of your own draft for a hook score and rewrites.
Check your draft against YouTube's advertiser-friendly guidelines before you record it.
Read this channel's public videos and transcripts, and download a writing brief for it.