Getting the transcript
Reading the captions from YouTube. A video nobody has opened here before takes 10 to 30 seconds; this page fills in on its own.
Getting the transcript
Reading the captions from YouTube. A video nobody has opened here before takes 10 to 30 seconds; this page fills in on its own.
The Inner Circle Trader · @InnerCircleTrader
Where viewers went back to watch this video again, from YouTube's public Most replayed graph, lined up with what was said at that moment.
Most replayed moment #1
45:397.4x the video's typical replay level
Said at 0:00
Most replayed moment #2
10:597.4x the video's typical replay level
Now, I was not participating obviously for that. But you can see all the mechanics with the balanced price range supporting that idea here and then I have a nice sibi. Trades up there. And now we can take this fib. Once we get that potential turning
Said at 10:52
Most replayed moment #3
15:366.5x the video's typical replay level
Said at 0:00
The graph counts replays. It does not show where viewers stopped watching.
Words
2,320
Runtime
57:47
Speaking pace
40wpm
Reading time
10min
40 words per minute, below the 160 25th percentile of 349 measured videos. That distribution comes from the 349-video hook study.
Opening (first 30 seconds)
MacBooks, happy Friday to you. So, we're looking at the Nasdaq. This is non-farm payroll Friday. What I'm about to
20 words, the words spoken in the first 30 seconds at 40 words per minute.
Free, no signup. See how the first 30 seconds hold attention, with rewrites.
Sentence shape
| Measure | This transcript |
|---|---|
| Sentences | 236 |
| Average words per sentence | 9.8 |
| Longest sentence | 41 words |
| Questions asked | 31 |
| Sentences containing a number | 24 |
Most used terms
Filler phrases
24 in total: like 10 · uh 6 · kind of 3 · um 3 · literally 1 · you know 1.
A literal whole-word count of the same phrase list the Prepublish browser extension uses, so a phrase inside another word is not counted and a phrase used in its ordinary sense still is. It is a count and not a judgement.
Run the check on the words above: where attention is likely to drop, with a rewrite for each weak line. The free check shows the scores and the one issue costing the most.
What this transcript is
Every word below is the caption track YouTube publishes for this video, pulled from the video itself and reproduced unchanged. It is not Prepublish's writing, not a summary, and not a re-transcription: it is the video's own published captions. English captions, generated automatically by YouTube, in the video’s original language. Source: the video on YouTube. A channel that would rather this page did not exist can ask for its removal through the contact page, and it is removed.
MacBooks, happy Friday to you. So, we're looking at the Nasdaq. This is non-farm payroll Friday. What I'm about to cover is not an invitation for you to try to gamble or risk real money on. I I teach very extensive lessons and reminders to never really try to participate on Thursday and Friday. If you're brand new, if you don't have a lot of experience, uh you have no business literally participating in one of the last two days of the first week of the month.
It's very challenging for for folks that don't have the experience. And I think if you watched yesterday's price action after the morning session, everyone would agree that it was a little bit challenging. So, anyway, with that said, on Wednesday, I tweeted my last level of interest, and that was 29,780. Okay, so that was in my mind, I was wanting to see how they would use it for a non-farm payroll. And as we watched yesterday's afternoon trading, uh it was consolidating, creating a range, and just wasn't trying to get anywhere anytime soon.
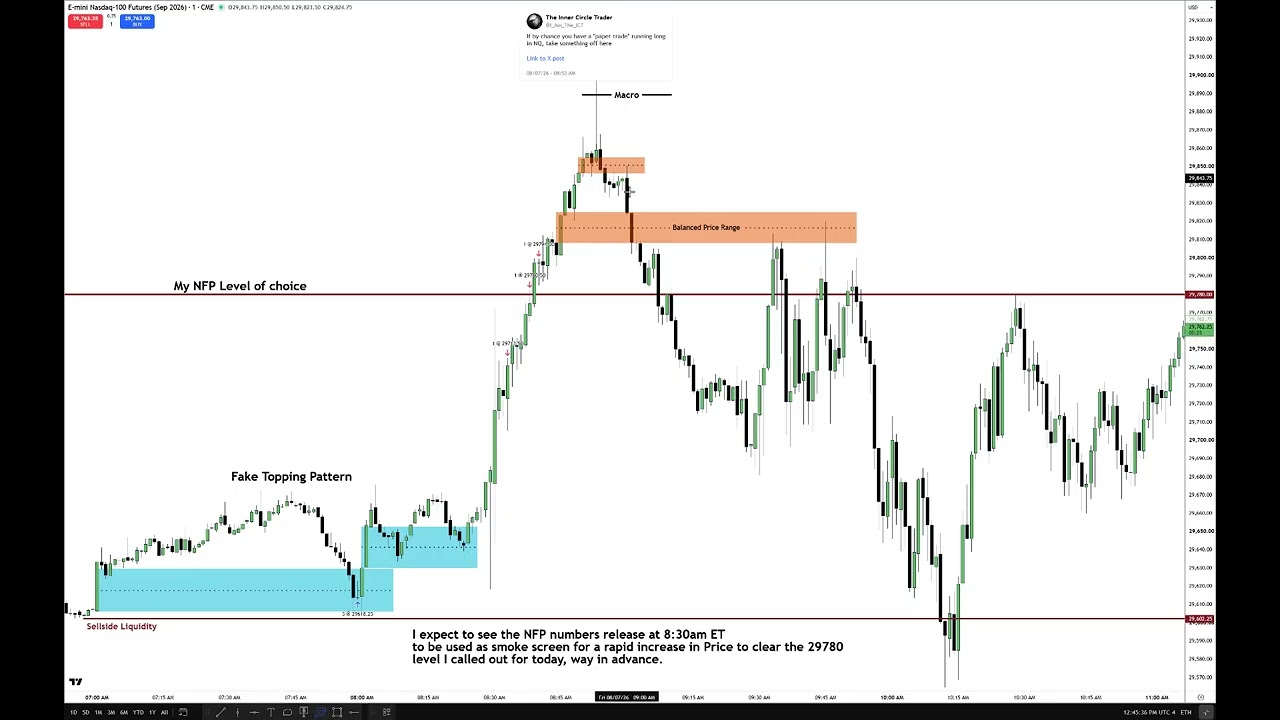
So, leading up to non-farm payroll, that's typical. Okay, that's typical price action. And I'm going to cover now what I showcased on my X feed. That'll be the last trade example I show over there, by the way. Um more on that tomorrow. The idea of 7:00 in the morning pre-market session start time to 9:00 a.m. Okay? Between those two hours, today we had a high-impact news driver, which was the 8:30 a.m. Eastern time non-farm payroll.
That data that's released at that time of day on the first week generally of each month tends to be very volatile. Okay? And we have to make a little bit of an adjustment in terms of managing the range. So, from 7:00 in the morning to 8:30, which is right there. Okay? So, that's 29 minutes after 8:00, and that's 8:30 right there. Okay? That's your range. You need to know what the highest high and the lowest low was during that time.
It just so happens that I've already done the work for you. That's this is the highest high and the start of the time here, if we go from that point, and we anchor it to the low right there, and I'm going to back this off just so you can see it. Okay? So, what I'm measuring there is the lowest low and the highest high. So, that's our dealing range during pre-market session hours. We have to have a range determination before 8:30 because there's going to be an event that comes out on the economic calendar that's very volatile.
It creates a lot of movement. So, when we look at price action like this, we can anticipate price trading down, rallying higher, creating a little bit of an inefficiency here because of this. Now, this is permissible. These little tiny little variances where price just goes outside the range of this buy side imbalance or inefficiency, we treat that as a mohawk. Okay? Just like a little tiny coloring outside the lines, like your child when they color in a coloring book, you see them scribble a little bit outside of it, and they're trying their best to stay in here.
That's the forgiveness I allow for for the algorithm to to present price like that. And then, look at the bodies. They're not allowed to close down on the low or outside of it to the downside. So, the bodies are telling you there's a likelihood that it's going to go higher and it does. And we draw back down into this buy side imbalance sell side inefficiency. And every one of these ranges are qualified with the key levels that make up the individual range.
So, 7:00 start time. Okay. And we have a a level here. Go back, you'll see that this touches that. And it touches that level, too. So, this is certainly a key level that look for sensitivity, discount sensitivity inside this buy side imbalance sell side inefficiency. You already knew I was looking for 29,780 anyway. So, anything that would build the narrative around that occurring helps. So, we see the market trade down into a buy side imbalance sell side inefficiency, rallies up, comes back down into another higher buy side imbalance sell side inefficiency.
Look at the the gradient levels confirming that this key level trades up again. Right back down into consequent encroachment of this gap. And the bodies are not on the midpoint. Consequent encroachment level. Is that bullish or bearish? Bullish. The market rallies up. Then 8:29, we have the open. Flirts with a little bit of movement here and quickly clears out the lows here, but leaves this sell side intact. It rallies.
Stalls a little bit in here. Which is helpful. We'll use that in a moment. The market trades above, hits the 29,780 level I told you I was looking for. And then it rallies a little bit further. And then finally we get into the macro time. So, 8:50 to 9:10. Price is reaching also a algorithmic projection, which I'll teach you that here. And then when it likely turns, and well, when would you anticipate this? How could you anticipate that?
Well, and why am I talking about it like it's in hindsight and everybody can do it? Well, if you look at the tweet here, if by chance you have a {quote} {unquote} paper trade running long in NQ. Take something off here. Because it's at a point where it could reverse back inside the range and during the macro time. So, it ran from 8:30 all the way up to the beginning of the macro time. Then, we break lower. Suspension block, bullish, trades outside of it here and validates it as what?
Bearish inversion fair value gap. Trades up to it here. Fails to touch consequent encouragement and sells off. Is that bullish or bearish? Bearish. Price pulls all the way back down in. Rallies back up to a balanced price range. What makes this a balanced price range? Buy side imbalance sell side efficiency. Sell side imbalance buy side inefficiency. They share the same range. So, what I'm using is the highest high and the lowest low between the two.
And there's your balanced price range. It hits it here, here, and it finally gives up the ghost. Works back lower. Finally clearing out the sell side. Over here. Okay? So, uh my only participation was just to you know, kind of like thumb my nose at a couple guys on X that just they don't get it. So, let's take a quick look at where the executions were. All right. So, right in here you can see if you look real close, you'll see right there a little tiny carrot will appear.
Right there at the end. Bang, there it is. That's my long entry. One three contracts. It's a report. We don't want to go too heavy on leverage. And for disclosure's sake, this is a demo trade. Okay? It's a paper trading account. Rallies up. Comes back down in. We're holding and then finally it starts to rip higher. Now, about halfway about halfway between my entry and this level here, I kind of like want to try to take something off if I see kind of stalling.
Cuz nonfarm payroll is very volatile. Okay? You can get it wrong. That's why I tell you be careful. So, I take something off right there with one contract. Okay, so if you look at the low down here where I went long and where I'm aiming for, we'll just throw a fib up real quick. So, from the low up to this level right there, at this level is halfway. It's halfway. And around that area you can see that's exactly where I'm getting out at, okay?
So, obviously, this is halfway point. So, I'm getting out just above the halfway point. I just don't want to take a partial below halfway. So, everything here is germane. I'm taking a partial in in the premium side of the low where I longed from and where I am looking for as a as a draw on liquidity. So, the market rallies up. I want to talk a little bit about this 29 minutes after 8:00. We dump down in here. And then we open, rally up.
So, when we have this, okay? We have the potential to see how price may utilize an expansion beyond the draw. Like, how far can we go? And it creates a little like a a pause. So, what I'm going to do is is I'm going to go back and look inside this range. And I want to see is there any details that I can pull through with price action. And dragging it up to here, that's the the low and the high that range. And I'm doing standard deviations of the highest high and lowest low of the range prior to 8:30 release.
So, 7:00 in the morning starts the time. Go through up to the point of 8:30, which is here. What's the highest high? There. What's the lowest low? That candlestick right there. Okay, cuz look at the look at the low on this candlestick. 29,604.75. So, 604.75 is the low of that one and then we have >> 19,604.25 Okay, so it's two ticks lower on this candlestick. Okay? And I'll take this off so you can see it. And that and then we'll take this off just for a moment.
See how it's slightly lower there than there? And that's low high I'm saying, but check your own your charts. Your charts will show it. Okay? >> [sighs] >> All right, so by having that measurement and if we clear my objective, how far can it go? What's going to run till we get to macro? Macro's 850. So, right there. So, we drive up into that and now we're reaching a level where we have a standard deviation of -2.05 which is beyond the scope of where we were anticipating.
And it's starting at a time of day where it could potentially reverse and trade back lower. Why? Because non-farm payroll is generally a two-stage delivery like an FOMC. So, what do we get first? Rally up and then come back down for the ones that went long. Where are their stops going to be? Right here. And you see that happening right there. Now, I was not participating obviously for that. But you can see all the mechanics with the balanced price range supporting that idea here and then I have a nice sibi.
Trades up there. And now we can take this fib. Once we get that potential turning point up here during the macro time then once we break below here and start to sell off, we can now look for uh PD arrays. And the highest one we want to be anchored to, not that one. There you go. Okay, and we're going to drag back down through all the way back down to the lowest low. Cuz this is your dealing range it rallied up in. So, notice how this here is qualified with this gradient level.
Or octant or upper quadrant, rather. And price trades up to here, here, falls out of bed. We have this sibi. It's qualified because it's sitting at the octant right below consequent encroachment, which is this level right there. Institutional order flow entry drill, sells off, finally clears the the liquidity up below the one down there. Then it rallies up. We have a buy side imbalance sell side inefficiency. It's qualified because it's anchored to this lower octant.
Institutional order flow entry drill, rallies right back up to 29,780 level. Comes back down. We do all kinds of consolidation here inside of this buy side imbalance sell side inefficiency. And then we rip higher. We consolidate around the octant at 0.625. It rallies higher. Watch the bodies in here. Does it breach it? No. Trade back up into highest octant. Breaks aggressively lower. Bearish fair value gap. Carry that through.
You can see it here. Right there. To there. There you go. Hits it. Sells off. Back down into lower quadrant. And now here's where sitting at right now. So, all in all, it's a nice little exercise this morning of prediction. Uh this is all the things I typed out when I finally got home. I took a screenshot while I was driving to drop off my son at his employment this morning. And I had my screens recording when I left.
And if anything had happened, I I going to enter on my phone remotely. And that's why you'll see again I I compressed the video very very short and put it on X. But now you're going to see it at real time. So you'll see the the management. Then you also see when I get back home where I can then do annotations and and then you'll see um all all the business here where I type all this stuff out and then it is what it is.
Okay? So I think that's going to be it. Um I'm going to uh wish you all a very pleasant weekend. I'll have something to say tomorrow, I'm sure. I'll be celebrating my birthday tomorrow, August 8th. I'll be 54 years old tomorrow at 7:11 p.m. Eastern time. So the old man's getting up there in age. >> [laughter] >> So hope you enjoyed this week with me. I hope you learned something. I hope I encouraged you. I hope I entertained you if if nothing else.
And Lord willing till I talk to you next time. Be safe. >> Mhm.
The words are the caption track's own and nothing is reworded or re-transcribed. Paragraph breaks are placed between sentences so the text reads as prose.
Free tools for your own script: paste a draft and see where it stands before you record it.
Paste your draft and see where viewers are likely to drop off, with a rewrite for each weak line.
Paste the first 30 seconds of your own draft for a hook score and rewrites.
Check your draft against YouTube's advertiser-friendly guidelines before you record it.
Read this channel's public videos and transcripts, and download a writing brief for it.