Getting the transcript
Reading the captions from YouTube. A video nobody has opened here before takes 10 to 30 seconds; this page fills in on its own.
Getting the transcript
Reading the captions from YouTube. A video nobody has opened here before takes 10 to 30 seconds; this page fills in on its own.
PropFirmTrader · @Prop-Firm-Trader
Words
12,950
Runtime
1:00:43
Speaking pace
213wpm
Reading time
54min
213 words per minute, above the 201 75th percentile of 349 measured videos. That distribution comes from the 349-video hook study.
Opening (first 30 seconds)
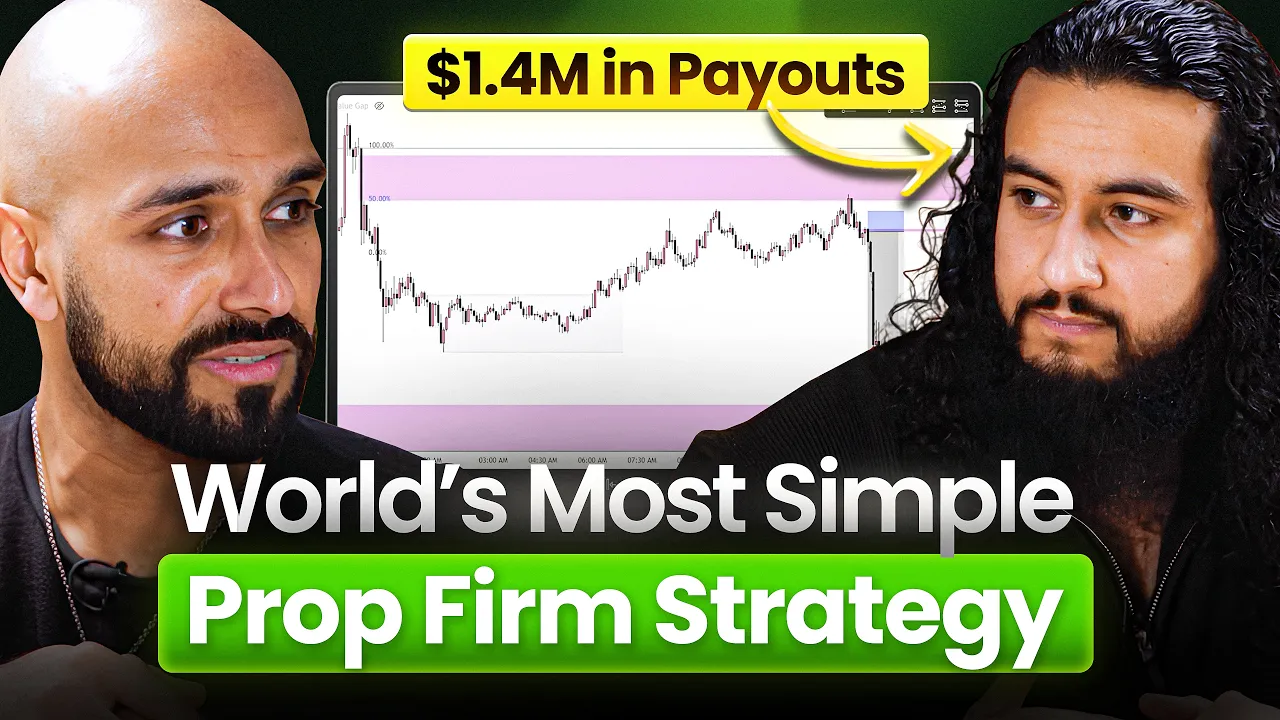
When it comes to executions, I'm looking at 1 minute time frame. That's where I can get my pinpoint accurate entries. Everything for me is just charts. I don't care about the news. That's why I never take partials cuz if I close half and it continues without me, I get quite annoyed that I didn't have my full position. And the reason for that is most traders spend years trying to find profitability in the markets. Zamco took a slightly different approach. Instead of trying to beat the market, he focused on beating prop firms. It's an approach that's allowed him to generate over $1.4 $4
107 words, the words spoken in the first 30 seconds at 213 words per minute.
Free, no signup. See how the first 30 seconds hold attention, with rewrites.
Sentence shape
| Measure | This transcript |
|---|---|
| Sentences | 1,014 |
| Average words per sentence | 12.8 |
| Longest sentence | 270 words |
| Questions asked | 112 |
| Sentences containing a number | 121 |
Most used terms
Filler phrases
357 in total: like 121 · kind of 83 · um 34 · actually 33 · uh 28 · right? 15 · you know 12 · sort of 10 · literally 9 · I mean 7 · basically 5.
A literal whole-word count of the same phrase list the Prepublish browser extension uses, so a phrase inside another word is not counted and a phrase used in its ordinary sense still is. It is a count and not a judgement.
Run the check on the words above: where attention is likely to drop, with a rewrite for each weak line. The free check shows the scores and the one issue costing the most.
What this transcript is
Every word below is the caption track YouTube publishes for this video, pulled from the video itself and reproduced unchanged. It is not Prepublish's writing, not a summary, and not a re-transcription: it is the video's own published captions. English captions, published by the channel, in the video’s original language. Source: the video on YouTube. A channel that would rather this page did not exist can ask for its removal through the contact page, and it is removed.
No Script X-ray for this video: YouTube shows a Most replayed graph only once a video has enough views.
When it comes to executions, I'm looking at 1 minute time frame. That's where I can get my pinpoint accurate entries. Everything for me is just charts. I don't care about the news. That's why I never take partials cuz if I close half and it continues without me, I get quite annoyed that I didn't have my full position. And the reason for that is most traders spend years trying to find profitability in the markets. Zamco took a slightly different approach.
Instead of trying to beat the market, he focused on beating prop firms. It's an approach that's allowed him to generate over $1.4 $4 million in the last 2 years. How many entries are you getting per day or per week? I would say around like a good setup, probably one or two a day. I thought from a 1 minute time frame. You probably get a lot more setups. My actual good setups that I actually wait for are more. It has to align with higher time frame because in this episode, you're not just going to hear the idea.
You're going to see exactly what he's looking for. You're going to understand where he enters, where he exits, and how he manages risk differently in the challenge versus the funded stage. This is the exact playbook that he's used to gify the prop space and earn himself 7 figures. How do you find your setups? How do you get the right entries? How do you get out at the right time? If we're overall making higher highs and higher lows, I'm bullish.
If we're making lower lows and lower highs, then bearish. I'm constantly watching. I don't really have hard take profits simply because we might flip bullish, but we might come back down or we might continue up. Now, I don't know which one's going to happen, but what's up everyone? Welcome to the Prop Firm Trader Podcast. the number one podcast in the world for all things funded traders. Today we've got a very special episode.
We're going to be getting inside the mind and behind the curtains of someone that has pulled seven figures from the prop firm space. I'm very, very excited to sit down with this individual and unpack exactly what they look for on the charts that has helped them to extract so much money. It is my pleasure to introduce Zamco. How are you, man? I'm right, thank you. How are you? I'm very well. Firstly, thank you for being here.
Thank you for having me. I really really appreciate it. Um I am very very interested and excited to get into this part because I think again I'm I'm trying to put myself in the mindset of the audience tuning in and I think one of the questions that most people have is you know how do you find your setups? How do you get the right entries? How do you get out at the right time? And there's a lot of questions around chart work that I think can be solved exactly through this manner.
So what I'd like to do to kick off today is I want to start on the whiteboard. I want you to take me through your strategy from start to end. Teach me like I knew absolutely nothing. Um and then hopefully we can jump onto some live charts. Um you can actually talk me through some real examples outside of the theory. Um and we can uh see exactly what you're looking for in the markets. Sure. Sounds good. Yeah. Yeah. All right.
So, start me at the very beginning. How does your process start for you? Is it all chart work related to begin with? Is there anything that you do off the charts before you step up and do business? I think everything for me is just charts. I don't I don't care about the news. It doesn't matter if there's a news release. I only I only need to look at news just because profam rules, right? Other than that, I don't actually look at it for my strategy at all.
Okay, cool. So, you sit down each more. What session do you trade? I trade all of them. All of them. Okay. I barely sleep. Okay, fair enough. So, all right. Let's say I presume you have specific areas of price or levels that you're kind of interested in. Is that where you're kind of determining how you're actually going to get up and when you're going to be at the charts? Yes and no. It depends. Sometimes I can trade Asia session, but I'll tell you typically it is after Asian session closes that pre-London and London open.
That's my main kind of focus. Okay. Interesting. So, you step up to the charts pre-London London open. Um, talk me through what you're looking for. What sort of time frame are you starting out with and what are you looking for on that time frame to determine where and what you're doing business with? Sure. So, I typically start off on the daily time frame, see how daily candles started off. Now, typically daily candles open up and then if they, you know, if we're pushing bullish, daily candle would open up, it'll make a bottom wick and then flip bullish and continue up.
So, that's kind of what I'm looking at in the morning. Are we in the bottom wick phase of that candle? Can I get a buy right now so that I can be in the position before the daily candle even flips bullish? So, that's kind of what I'm looking at. Daily time frame, just how is the candle started? Which way did we go first? Did we break the previous daily high first or are we still moving down in that previous daily candle before we break the previous daily high uh or vice versa?
So, I'm kind of looking at how the daily candle started and what's happened in Asia session. So, does that always mean that your bias is going to be the opposite of kind of what you're seeing? So if we've opened the day and we've started trading up, you're immediately presuming that that's going to be the potential high of the day and then you're trading back down. Is that right? Yes and no. It depends because if Asia session is very impulsively moving in a in a certain direction, then I tend to continue that direction.
But if we're consolidating in Asian, then I wait for the manipulation then take the uh the trade. So it really depends on what Asian session does. If we very impulsively are moving up, I'm going to look for buys. But if we are moving down a bit and we are overall on the higher time frame bullish, then I'm just going to wait for some sort of manipulation to then take the buys. Okay. So it really depends. I might continue the buys or I might wait for them lower down.
It really depends. Okay. So bias is all coming from the daily time frame. Yes. And your what are you looking at specifically deter to determine what sort of uh I guess market condition that you're in? because you mentioned like you're looking at like overall trend as well from a daily perspective what determines a trend for you because I guess one man's trend is another man's consolidation right depending on your perspective so what specifically are you looking at from the daily time frame to determine right today I'm more inclined to be bullish or bearish or what does that look like for you is honestly just looking at the past few days and then not just daily also dropping 4 hour 30 minute 1 hour kind of looking at what the structure is looking like if we're overall making higher highs and higher lows I'm bullish if we're making lower lows and lower highs and bearish.
It's kind of looking at all of those time frames for like the past few days. Not like major like monthly or whatever. It's just past few days, how have we been trending? Okay, got you. So, you you seem to put a lot of emphasis on more recent price action rather than historic. Is that fair to say? Yes. Okay. Interesting. So, you the a lot of your bias comes from the higher time frame and you kind of have that top down approach, right?
You start with the daily, you work your way down. Um when do we get to the point of execution? What sort of time frames are you working with? I when it comes to executions, I'm looking at one minute time frame. So I'm aligning my daily, 4 hour, 1 hour all to the one minute. So that's where I can get my pinpoint accurate entries and then take the whole higher time frame move, which gets me the high risk reward. Interesting.
Okay. Could you kind of draw us a map of potentially what that looks like time frame to time frame to give us an idea of what would set up maybe just the ideal conditions for you to get involved? So what the daily would potentially have to look like, what that would potentially look like on the 4 hour and then I think you said it was the hourly. Yes, hourly, 30 minute, even down to the 15 or five. It's just like I kind of go throughout all of them to see what zone kind of looks good to me and I'll talk about the zones uh in a bit.
Okay. So could you start to draw us a little map of potentially what this looks like? Like what would you want to see in the charts of something that would entice you to want to get involved? Sure. So if we were talking about let's say the daily time frame. So let's say let's say this is bullish candle then the the next daily candle we have another bullish candle. And then let's say now on that third day we've got bullish bullish and now the third day we've opened up and we don't have a top wick.
Let's say the new daily candle's opened up and we've got no top wick and we're pushing down. And then now I'm looking at between 50%. So the previous daily candle, half of that is uh in the discounted range. So anything below 50% of that daily candle or that structure that moved up on that daily candle, I'm looking at any sort of entry down there. So I'm expecting this daily candle, the new one, to kind of wick into anywhere below 50%.
Mhm. And then now in this daily candle over here, we're probably going to see uh now I'm not going to draw candles. That's a bit tricky. But okay, let's say we moved up and then this is the the bottom wick of this daily candle and then we started pushing up again. Now within this area down here, so let's say this is this day right here. So the second day, now this is the third day here coming down. But we don't have a top wick.
Let's say this the new daily candle started here. no top wave. We're pushing down. And this is the previous daily candle which is here. And you can see below 50% of this daily candle, it sits around about uh around about these regions here. And within this area, anywhere below 50% now I'm looking at inefficiencies. So now that could be as people know them as fair value gaps, but I call it inefficiencies. And the reason for that is because when you actually look at the order flow chart of these fair value gaps or inefficiencies, you can see that if we have a very bullish inefficiency, there are lots of ask contracts but no bid contracts in that exact area.
So that's showing you price is inefficient. Price needs to test back to that area to have those buy uh bid contracts be filled in. So that's why price typically comes back to those zones and then we can continue moving up. So, so yeah, these types of inefficiencies is what I'm looking for within this zone. So, there's there's a lot to pack unpack over here. So, we're looking at all of this and once price comes back down to let's say the inefficiency which might be on the 4 hour, 15 minute, 30 minute, whichever one.
Once we tap into that, now over here I am dropping to the 1 minute time frame. So, in the 1 minute time frame, we're looking at structure coming down. Once we tap into that zone up here uh below 50% retracement, then I'm looking for a break of structure to the upside on the 1 minute time frame, waiting for a retest of another inefficiency below 50% on the 1 minute and then taking a buy right here, expecting price to continue up for this to then continue up to break the previous daily high and that daily candle right here to flip bullish and then actually continue up even higher.
M that's kind of what I'm expecting on all the time frames. So I'm looking at the daily, the 4 hour, 1 hour, kind of aligning it all together and then my entry is on that one minute time frame looking for this type of market structure shift in that zone on the higher time frame and then I'm catching the literal bottom wick of that daily candle before it even flips and continues up. So I'm catching all of this and then that's how you get like a 1 to 20 risk reward.
So your from what I'm understanding your strategy is quite fractal in that what you're looking for on kind of these I guess the the medium sort of time frame we could call it um is exactly the same thing that you're looking for on the minute. Exactly. Right. So visually I guess that makes a lot of sense. Um you're you're kind of working on the idea that price is fractal. What happens on one time frame would happen on another.
I had one question for you. Right. So you talked about this idea of and I think you first mentioned this when we talked about the daily chart and you mentioned that if price hasn't yet made a a top wick for the day for example and you see it trading down it gives you this kind of indication that if you're already in a bullish trend you're going to be wanting to buy that which again makes sense. You mentioned this idea of trading in discount which is below 50% of the previous day's candle.
Is there any time when you don't trade in discount so where you will trade above 50% of that days? Yes. And it doesn't necessarily mean that the discount has to be of the previous daily candle rather the structure. So let's say we had multiple structures in that daily candle as we were pushing up. Let's say as we were moving up we also did something like that. Let's say we did that all within this whole daily time like the daily candle on the second day.
Okay, that all is structured to me. But let's say along the way we've tapped 50% on these lower time frame structures along the way. Now the only then the only structure that I'm looking at now is the recent one where we haven't come to 50%. So that would be here which is the new daily candle starting somewhere here right and that's where I'm kind of looking to continue it. So this might be the whole daily candle but the structures within they've all been retracing more than 50% and been moving quite efficiently.
So that's what I'm kind of looking at is what structure did we not get a retracement of 50% into a discount and are there any inefficiencies within that uh within that retracement and that's kind of what I'm looking at. Okay. Is there ever an instance where you will trade against the trend because it at least from me from what it sounds like the majority of your trades are basically in alignment with an existing trend and you're kind of just looking to get on board with that.
Is there ever a case where there's maybe a strong level or an indication or a gut feel or whatever it is, but something that will make you want to say, you know what, I think we're going to form a top hit and I want to go against that. Most of the times not. I would say I used to do that and I saw that it just doesn't work as well. So, I would rather just wait to just take continuations or whatever we're overall trending.
Now the thing is trends can const like it again trends are very subjective depending on what time frame it keeps changing. Now this could be the daily time frame going up but on the weekly we're actually bearish right? You see what I mean? So now we're coming up to weekly levels there. Now the daily is tapping into these weekly levels up here and then we're actually looking to sell. So on the daily yeah we're bullish but then I'm actually looking for sells but that's because overall now on another time frame higher we're actually bearish.
Right. So I'm I'm trading basically all along trying to get the daily move every single day. Trading education is completely broken. For years the industry has been purged and poisoned by bad actors, fake results and strategies hidden behind pay walls. But in every industry, every once in a while becomes a catalyst, a moment in time for change. Now imagine a world where elite trading education was entirely free. Education with no hidden agenda.
Verified trading results and real profitable strategies, all for free. Welcome to Chart Academy. Chart Academy is the world's first all-in-one platform for trading education. Chart Academy is free. No catch, no upsells, no strings attached. Worldclass trading education completely free. Hi, my name is Randy Howell and welcome to my chart academy master class. This is completely revolutionary, the biggest change in trader education in 20 years.
My name is Karma Rosado. I'm a verified 7igure trader. I've been trading for 10 years now. The reason why a lot of great deals fail is because they ultimately this work is about selfmastery. Trading education will never be the same again. Browse hundreds of hours of content in forex, futures, stock, options, and crypto from the best verified traders on the planet, all in one platform. Experience a completely personalized trading plan tailored to you and your goals.
Reach milestones, redeem points, and earn rewards with a massive global community. Whether you trade forex, futures, stock, options, or crypto, Chart Academy has something for you. Join the weight list now and be part of a movement that is going to change trading education forever. Again, I'm trying to picture what this is looking like and maybe this is going to get a lot clearer when we go through some charts on this.
From a one minute time frame, how many setups are you getting like or how many entries are you getting per day or per week? I would say around a like a good setup probably one or two a day. Okay. And I trade three different pairs. gold and NASDAQ and German 40. Okay. So again, if I don't see something on gold, I'll wait for German 40 for London open. If I don't see anything on that, then I'll wait for NASDAQ and kind of see if I can see something on that.
Okay. Got you. So I honestly I thought it would be a lot more than that cuz I in my head I thought from a one minute time frame. I mean you get a lot of one minute candles in any given day. Yes, you probably get a lot more setups, but actually it's far less than I thought because that 1 minute has to line up with the higher time frame zones. I'm not just looking at the one minute. If I'm just trading the one minute, I I do sometimes do that.
That's where I I get a bit risky and I do and I'll show you like I do take kind of risky trades, but my actual good setups that I actually wait for are more it has to align with higher time frame. And how how what percentage of your setups would you say are the the good trades that you described? And how many of them are kind of just playing the one minute chop? I think most of them like I think 60 to 70% are like good setups that I've waited for.
London open. We've now wicked into like a higher time frame zone. Now we're continuing the trend. I think at least 70% of them. 30% is when I just wake up in Asian session. I'm just scalping gold trying to take the one minute like structure. But again it's like the same thing following structure just on the one minute and and just following that. So, as we're coming into discount on a 1 minute zone, then I'm trying to take a buy over here to then continue up even higher to let's say a 15-minute zone above.
Like, I'm playing all the different time frames, but the good quality setups, I think 70% would be about like the good trades that I get in London open. Okay. And do you ever deviate away from executing on the one minute? You ever go to a five or 15 or execute on an hourly chart, for example, where it's always one? No. So, yeah, it's not just solely 1 minute. I do flip between 1, five, and three. So 1, three, and five are typically what I'm looking at, but one and three is my main like entries.
Sometimes on the 15, but again, that just depends. If the 15-minute candle is too big or the zone's too big, I don't take it. I would rather wait for the one minute to tap into that 15 one, then look for something on the one minute and take that. And when you say too big, are we talking in terms of um the actual pip or tick size depending on the range? So is there a specific criteria where you determine that's too big?
How how does that work for you? So that kind of works on again the whole overall structure. It's how much risk-to-reward am I going to get if I use this 15-minute zone and a stop loss below that 15-minute wick compared to the previous Asian highs or previous daily highs. Like if I use this zone and the previous daily high is quite close, I'm not going to get a good riskreward. But if we got a good distance, that just completely depends.
And then I might take it just based off the amount of distance we have where price could move. So, in your perspective, what's a good risk-to-reward? Like what if you if you were to see something that had like a 1:12, is that something you would immediately just not be interested in? I would take them only on, let's say, consistency accounts, okay? Because I keep my profits smaller on that on purpose because of consistency.
So, I'll take it on those, but if I'm taking on those, I'll take on my main accounts as well, just for the fun of it. But one, one to two, I'll still take them. But ideally, I'm looking at one to three and above. So, okay, I think I have a pretty good idea of what you're looking for here in terms of entry. Talk to me a little bit about trade management, right? So, once you're in the trade now, you we've talked about what you're looking for specifically on the one minute chart.
Yeah. Um, if you're entering at this inefficiency, where does your stop loss go? So, if I was to enter on the one minute time frame here, my and my entry is right there on the inefficiency on the one minute time frame, my stop loss is just below there, just below the low of that one minute. Or if there is let's say a 3minut zone here that we've tapped into and let's or 5 minute 3 minute whichever one like because within that let's say 15 minute 5 minute 3 minute within that big 1 hour you can have a 15minut you can refine it down to the 5 minute the 3 minute and I can refine it down to this pinpoint here it's like that's the lowest I expect price to go and then underneath that zone I might have my stop loss just because it's quite a small zone anyway so I might as well cover the whole thing.
Yeah, that's just more personal preference just to not get taken out. Got you. And then once you're in, so now we've entered, you've got your stop loss in place. Um, you're let's say hypothetically trade starts moving in your favor. Yep. Do you ever trail your stop loss? Are you kind of a more of a just I'm going to leave my stop loss there until it hits my takerit? How does that work for you? Yes, it's pretty much I don't trail my stop loss until the only thing I would do is make it break even.
And and that's only when we have, let's say, pushed up my entries there. We've retraced again. Now we've rejected again. Now let's say there's a fivem minute here. We've tapped that. Now we pushed up. Now I know my entry is safe. It shouldn't come back down. There's no inefficiencies next to my entry. Now I'll make a break even and I just leave it all the way to TPU. I don't take partials, nothing. Got you. So the the break even point is always based around a new inefficiency being formed.
Yes. And then once that's done, once it's broken that and sorry, rejected from that, broken higher or lower depending on obviously the direction you're trading. Yeah. Then your stop loss will go to break even. Yes. Okay. So your stop the moving that stop to break even is it's never about the kind of like structure of the trade. It's just the inefficiency uh seeing that continuation on upwards and then it doesn't matter how close.
So even if that inefficiency for example if that new one that formed was quite close to your entry you would always go to break even just from a risk management standpoint. Is that right? Yeah. Yeah. Pretty much. Yeah. Okay. Cool. Um okay. So now talk to me a little bit about exits. So, we've covered entry, we've covered trade management, the exit of the trade, and you kind of uh touched on this as we talked about this on from a daily time frame.
You mentioned that you're always looking for a continuation back onto kind of the previous day's high. Yes. Right. Is that somewhere where you're having a hard exit or are you kind of watching how price action goes there to see if it can go any further? Yes, I'm constantly watching. I don't really have hard take profits simply because we might flip bullish, but we might come back down or we might continue up. Now, I don't know which one's going to happen, but if I have a hard take profit, it's going to close regardless.
Yeah. But if we're pushing up very impulsively, why am I going to close out at the previous daily high when I don't see a reason for it to manipulate to come back down? Okay. I'm going to keep following the trend as we're moving up and kind of anticipating a sell off. So, if we're going to get a selloff, then I'll close out. Okay. So, it just really depends on how impulsively we're moving up. If we're very impulsive, I'm going to hold on to it.
Okay. So, um, if so, when you put your trade on, do you have a takerit in place or you're kind of you have an area in price where you're watching? Yes. So, I have an area that I'm looking at now previous. So, now I have three areas that I'll be looking at to take profits. Now, Asia range. So, any movement that's happened between 1:00 a.m. and 7:00 a.m. London time. That's the Asian range for me. Now, some people do it from market open, but you know, this is what I've noticed. 1:00 a.m. to 7:00 a.m.
London time. Whatever the market has done in that range, if we manipulate down first and I'm looking for buys, I'm going to take my profit at let's say the previous uh the Asian range high. Now, if that Asian range high is also close to the previous daily high, why not hold it to the previous daily high? Okay. Now, if that previous daily high is close to let's say a 15minut or 30 minute inefficiency above above it, why not hold it even further just until that zone gets mitigated.
Then I'm kind of looking to get out if we start getting a reversal. And what does that reversal look like for you? So, what needs to happen on the chart for you to say, I don't believe in this idea anymore. I'm just going to take my profits here. Yeah. So, it's basically literally as we're moving up to that zone and I'm in a buy, let's say, from down here, whatever. And once we tap into it, we start I mean, let's say we start consolidating around it, then we tap into it, then we start reversing and then start doing this kind of structure.
The moment we start manipulating up and then pushing down, breaking uh all of the consolidation lows, now I'm thinking, oh, that's like a manipulation. then continue down. I'm getting out now. So, it's kind of like looking at uh those types of patterns. And this is all happening from the one minute chart. Yes. The one minute or the 35 like pretty much the same. Okay. Got you. Got you. So, um interesting. the so your your I would say the the entry that you have in terms of sorry the model that you have in terms of entry and management for me seems fairly mechanical but then the the perspective that you have around exits almost seems a little bit discretionary it is to an extent yeah that's only because of greed I would tell you that like I can very easily tell you if you're taking the Asian range and you've taken the lows and now you're taking the buys for the Asian highs to be taken out you can keep your target there that it that you know you'll be very very profitable just by doing that but I want that bit more that's all down to me otherwise this the strategy itself is quite mechanical is is that something that has you've kind of learned along the way that like there is more juice in this sometimes and I want to hold it or is it purely just agreed perspective it's simply I've noticed a lot of the time sometimes we might take the Asian low then now we're taking the Asian high and then we continue up higher now I don't want to miss that I really really have FOMO in in things like this where it's like if I close our Asian range but now we literally double and move up even higher and I'm thinking instead of making 10K I could have made 20K and now I get annoyed then I start taking dumb trades trying to make that extra that I kind of missed out.
So I've just kind of just I just hold on to it and kind of wait until I get some sort of confirmation that we don't want to go up. Okay. And how often do you find that if you're in a good position and let's say you end up targeting previous daily high and then you start getting manipulation just like you've pointed out here? Yeah. And you get out of the trade, but then it doesn't come all the way back down to where it would have tapped you out of break even and it continues on running.
Does that happen to you often or do you find your read of the actual top or reversal is is generally quite good? No, it it does sometimes just continue up even higher, but that's usually because I didn't look at something. Now, if I didn't look at something and I close my trade and we continue up higher, it doesn't feel good, but I do accept it. Like, you were stupid there. You should have saw that. So, it does happen, but you just have to deal with it.
Fair. Fair. Um, okay. So, last thing that I kind of want to know a little bit about before we jump onto some real charts and get some real examples of this. What does your risk management look like throughout this process? Is there a specific amount that you're risking per trade? Um, do you have particular rules and processes around like how that works for you? Yeah. So, when it comes to prop firms in the evaluation stage, I'll risk the maximum that I'm allowed to.
So, now if they're going to allow me to risk 3%, I'll do that. If they allow me to risk the daily draw down, I'll do that. But when I get to funded stage, I always drop it to 1% or less, like pretty much less than 1% I'm risking per trade. Okay. And is the reason for that primarily just to get through the funded the like the challenge stages as quickly as possible? Yes, exactly. Okay. Got you. And why 1% when you're funded?
Is there a specific reason for the number? I mean, again, it's less than 1%. Sometimes I do 0.5%. It just depends on the account size. Now, I have a 500k account with one of the prop firms. So, I typically do like 2.5K or 3K. It's like just over half a percent, but some prop firms I have like a 200K. Now, that doesn't seem like a lot if I'm risking 2K. So, I'm like, flip, I'll just do that. So, it just depends on what I want.
Okay. If I feel like it's not enough, then I'll risk a bit more, but I keep it under 1%. Okay. And do you do you ever get to a stage where um let's say let's go back to this kind of example that we were working at here. You've taken an entry down in this area. You've now gone to break even because you've seen an inefficiency form and price has reacted to that and started moving up. Do you ever add into a position like that?
Never. Why? Because if I lose that one, then it just messes me up. cuz now I would try to hold on to both of them. I'm not happy with this entry, the second one getting taken out and then continuing up higher cuz I've added to it and now that's been taken out but price has moved. So now my psychology is, oh, I had more but now I don't have it. Now I only have half my position. I don't like that. That's why I never take partials because if I close half and it continues without me, I get quite annoyed that I didn't have my full position.
Are these things you've ever experimented before? Oh yeah. Learned the hard way. Absolutely. So I know what I like and what I don't like. Okay. Interesting. All right. I think this has given me a very good kind of insight at least from a theory perspective. I know a little bit about the entry model. I know things from a management and exit perspective and of course um things from a risk protocol. I think if you're open to it, I would love to actually jump onto some charts and see what this looks like in reality.
You absolutely. Okay. Let's take a quick break here and I want to tell you about a prop firm that's actually trusted and proven to pay their traders. There's only one name you need to know about. It's Traderify. You see, Traderify Futures is one of the most trusted names in the industry. They've had consistent and stable operations over the last few years and they've paid out over $125 million to traders. The best part about doing business with them is there's no hidden rules.
There's no denied payouts. As long as you hit your objectives, you get paid. It's pretty simple. Now, here's what Traderify gives you that actually matters as a trader. They've got flexible plans in place that you can get paid out daily. You've got the ability to pass evaluations in just a single day. And if you don't even want to mess around with evaluations, they've got instant funding plans as well. Honestly speaking, their dashboard is one of the best in the game.
They've got an in-built journaling process that allows you to trade, track, and improve your results over time. That's how real consistency is built. Now, before we get back to the episode, I want to share a massive update. Tradeify Crypto has officially launched. This is going to give you better pricing for cryptofunded accounts and you're also trading with institutional liquidity from exchanges like Binance, OKX, and Bybit.
This is honestly giving you the best trading conditions possible. On top of that, the payout setup is simple. Ondemand payouts. If you hit your objectives, you get paid. It's as simple as that. I personally think regardless of whether you trade futures or crypto, Tradeify is the move to make. and make sure you use the code PFT at checkout to make sure that you get the best deal available. Links in the description below.
All right, perfect. So, we are going to jump onto some live charts. Um, talk me through the market that you're looking at and then take me down exactly like we did on the whiteboard from kind of the top down. Um, exactly what you're looking for in terms of actually taking a trade now. Yeah, sure. So, this over here we have is NASDAQ US 100. And what I was looking at was the Asian range. Always look at the Asian range.
That's kind of what I kind of see. Now, Asian range was consolidating, which is good. So, that means typically if we sweep the highs first, we're probably going to sweep the lows after. So, now if we're sweeping the highs, now I'm looking at is there any zones that are interesting to me that I want to take sales from. Now, in this scenario, we have two. Now, we have one down here. Very, very tiny inefficiency. So, for people that don't know, inefficiencies are simply gaps in the market where wicks don't meet.
Now they can be on any time frames but you know it just depends on what time frame you're looking at but over here we have a fivem minute one then over here we have a very very chunky five minute one up here. Now what makes this significant as well is if I was to drop over here on the 1 minute time frame. Let me show you something. Now this is where premium and discount kind of comes into play. So we have this high that we had and then the low.
Now you see over here we pushed down impulsively but we didn't retrace 50% of this move. So from this structural high to this structural low. We moved down. We retraced a bit and continued down. And we never came back up into a premium area. So now this zone is actually much better than this one because we never came into a premium. We're probably going to sweep all of this to a premium area before then continuing down.
Okay, so now going to the five minute time frame. That's kind of what it looks like. And now I'm waiting for price to sweep Asian highs, tap into this zone, give me some confirmation, and then take sells. So now this zone down here is irrelevant to me because we have a premium up up here that we never tapped into. So now we have two confluences right here. Three actually. We have the Asian range consolidating. We've just swept the highs.
Now I'm expecting the lows to be swept. Now I'm just looking for sells. That's my bias now. And then now I'm looking at premium and discount areas that haven't been tapped into. That's up here. We have this structural high, structural low 50%, we never retraced up into a premium. And in that premium, we also have a 5minute inefficiency. That's three things telling me this is probably a good area to sell from because of all of the other rest uh resting liquidity below.
Now, another good thing that happened was as we were coming up, we have to look at the timing now. Now, this is 9:40 a.m. or almost 10:00 a.m. London time. London opens already happened and now we're already 2 hours in. Now, we're in the transition period between London open and NYC open. So, now I'm not really looking at a New York stock to trade. So, I'm not trying I'm not trying to trade NASDAQ, but just before NYC even opens and after London's already done its moves.
It's like it doesn't make any sense. So, now this is where timing kind of comes in where the sessions are quite relevant because this is a US stock um indicy. I'm going to trade it mainly during New York Stock Exchange or just at New York open. So now once we tap into that zone on the five minute, we can see we tap into this zone. Now I'm looking at the 1 minute and the five minute on the 3 minute. So now I'm looking at anywhere can I get an entry after we've tapped into that area.
Now we did have two areas but I missed this one. So what happened was look you can see right here we were had lots of wicks consolidating consolidating start pushing down and we're breaking this wick low over here. A lot of people are thinking oh we're bearish now we're breaking this low but we actually move up even higher into the zone the 50% premium that we never tapped into. And only after tapping into that did we push down.
And we broke structure to the downside. So, let me mark that out right there. We broke structure to the downside. Now, there could be two entries here. One could be over here, which did kind of work out. And then one could be all the way up here, but it's a tiny little inefficiency up here. It's just like, well, if we're moving down impulsively, we're probably not going to retrace all the way and continue down. Now, we're kind of just following the the trend.
M so this is where it premium and discount kind of starts skewing. It's like am I waiting for premium and discount now? No. Because now we're actually going to make the move. Okay. When the moves being made, you're not going to expect 50% retracements cuz that's where you're going to get the impulsive moves. Okay. But once you get the impulsive moves and then you've left the 50% or the premiums that haven't been tapped into, then that's a later trade that we see.
We never came into a premium in that in that area. So now we're making a move. I'm not looking for premium and discount. I'm looking for any short-term uh smaller time frame areas where I can get some sort of retracement and continue down. Now, in this scenario here, you could have taken an entry here, stop loss above the high as usual, but I missed this one. I didn't see it. So, I'll be honest. I'll tell you exactly where I took it and why.
So, I missed these two. But going to the 5minut time frame over here, as we tapped into that 5minut zone, we start pushing down break structure to the downside and then we move down even further. And then by the time I saw this, we had this five minute inefficiency here. Okay, again like you can see these are gaps between where wicks don't meet. So that's where I personally took my cell and my stop loss just because I wanted the higher risk-to-reward and I wanted to risk a bit more and have like a higher lot size.
Instead of keeping it above the high, I kept it above this wick high because if you go to the one minute time frame, you can see this is where we had the retracement up into this 1 minute and then we push down. So, it's like that high is kind of covered now. We shouldn't really break that high again into tiny one up here and then continue down because we're already making structure uh that is quite bearish. So, I'm just going to follow that along.
So on the five minute time frame, it just looks like a very solid wick up, you know, nice clean wick up. Let's let's cover that high. Didn't need to really have up there. But of course, it could have been safer. But that's me just taking a bit more risk. And then the first target was the Asian lows, which was right there. And we can see very quickly after tap, after all of this consolidation, we all manipulated up and then started coming down.
So there's lots of different elements to this. Asian range consolidating where we typically see a sweep of the high and the low. We have premium area that we never retraced into. We have a fivem minute inefficiency that we never tapped into. And then timing the fact that we were just consolidating below it just before a New York open. Then in New York we start tapping into it and the New York Stock Exchange open we completely dump.
It's like we're looking at all of these things and it's all lining up and that's kind of where the trade is taken. And that is actually the one that I sent to my community as well. We all just took this dump. Took this dump. But it was really, really clean and a lot of people took that. Now, this is where it comes to, am I extending my TP? And I'll show you that. This was going to be a question I had because to my eyes, looking at this, that looks like quite an impulsive move down.
Exactly. And from what you described, the more impulsive it goes into a move, you're looking to see if we can get more out of this, right? Exactly. So, am I just going to take profit at Asian low? No. Because look at how we're coming down. We've just swept all of this consolidation tapping into a high time frame premium and now we're dumping. Now we start looking at other areas of um that are quite interesting. Now we could look at this 5m minute inefficiency here which is a bit scary.
We might tap into that and then continue up even higher because overall look we are still pushing up. We are pushing up. We might just tap into this and continue up. But again it's looking at what happens when we tap into this zone. If we drop to the one minute time frame, you can see we don't really have any like clean structure that's tapping into it and then reversing. We're just following the little wicks. Look, this high, this high, we're just going right through it.
There's no structure, low. Exactly. There's no structure that's telling me, oh, we're reversing from this zone. So, I have no reason to get out. So, now again, holding through that. This is what I mean. You're looking at what structure is doing and how we're moving as we're approaching target levels. So, we have inefficiencies that we can take targets at. Sure. Now, I'm looking at is there any other Asian range? Oh, look.
We have this big wick down over here. Asian lows were unswept over here and we consolidated. Oh, we could hold it to the next Asian lows. Now, we're looking at what a 1 to 19 1 to 20 trade and and there you go. Just like that. You're looking at the structure on literally this is the same previous day and then the next day on Thursday. That's all that's happened is two days but looking at what happened on that day and then on the next day we've taken the Asian highs 50% on the premium five minute inefficiency tap that got a confirmation take your cells Asian low as first target now we're looking at how we're moving down and we just continue holding holding holding holding and that's kind of where my hard target would be because it's like oh I've taken too much down that's that's good that's good now we've taken out both Asian lows now I'm going to get out that's a typical ical trade right there.
And even on the daily time frame, it looks like we were very bullish, right? We closed very bullish, right? But then now we're very bearish. Now the question is, well, how does that happen? And the and the daily candle had no top wick either. You can see on this daily candle, we had no top wick. So why did I take sells? It's simply because what structure was telling me, it's literally just following structure. And again, I was very hesitant because we had no top week over here, but structure was telling we're flipping bearish from this premium area.
So, take sales. So, for you, there will be occasions where the lower time frame structure will tell you a different narrative to maybe the daily bias and you will put more emphasis on that versus the daily bias. It depends because where we where we came down from here, again, I'm looking to the left of this as well. Okay. Now, why did we move down here? Now, I have to look at that. I have to look to the left. Now, if we look at this exact uh high that was made and then we start pushing down, is it significant?
What did we tap? Now, let's see the 15 minute. There might not be anything. I'm not sure. I haven't looked at this, but let's see. 1 hour. Okay. So, this was simply we had these uh highs right here. So this consolidation, consolidation, consolidation, all these highs and you can see we peaked above all of these and only then did we push down. Right? So if we had pushed down at these highs already, like if we just came up to these highs and then pushed down again, I'll be very hesitant because we have a lot of liquidity sitting above these highs.
The fact that we swept above all of these highs and then only did we reverse, that to me is telling me that we want to actually push down. Does that make sense? Yeah. Yeah. For sure. For sure. It's just how it all happens. Yeah. Interesting. Um, one thing I was curious about, you mentioned that obviously like the majority of your exits are done based on what the market is looking like, the impulsivity, but you mentioned that in this specific scenario, you had kind of like a hard exit at the previous days Asian range low.
Yeah. And I think the word you used was this was enough. Yes. What what does that look like for you? Is it is enough measured in terms of a monetary perspective or in terms of a risk-to-reward perspective? Like how are you gauging this? Because that part to me feels again an element of discretionary because had this continue dumping another few hundred points I don't know. Um is that going to be something that you would have kicked yourself about or you know looked at ways in which you could have held that for a longer period of time?
I think at in this specific scenario it's also looking at the time. So now typically after like four or 5 pm London time we typically get retracements which you can see right here at 3 what almost 4:00 then we start retracing. I don't want to psychologically even be in that. If we're going down like this and we have a good target where we have an actual liquidity point which is an Asian low after we've taken that I and I'm looking at the time well we've just moved this much down a retracement is inevitable and psychologically even this retracement up I don't want to be in that cuz it just it's not nice to be seeing that.
So I'd rather just get out now we might continue down even further but you know oh well at least it it didn't play with my mind that we were retracing. So that's kind of what's enough. So your your focus is primarily to take the meat of an impulsive move. Yes. And you're not worried about the corrections or what may happen after that. As long as you don't have to sit through the kind of the the retracement. Exactly. Yeah.
I don't really like retracements, but again, if we were moving down here and then we kind of came here and then slowly started retracing up, but then I see, oh, we do have an Asian low. We're kind of be creating bearish structure again. I will hold for all of that. It's not nice, but again, it's like I'm understanding where does price need to go. We have all of this consolidation here. Asian low right here. And again, when you have Asian lows with like big wicks like this where prices wicks down very uh impulsively and then never kind of reweeps that low, that's another really good liquidity point.
And they they typically get tested. We typically sweep that later on. So if we were like kind of hovering above here, I'll still be holding. It just depends on the time, the impulsivity, and where I'm expecting retracements to happen. Okay, got you. because after sweeping something like that, a retracement is inevitable and that's exactly what we had here. Okay, nice. Okay, that is uh yeah, seems pretty clean as an example to me and I think bar again I'm trying to look at this from an objective standpoint.
Bar probably the context of the daily chart. Um everything seems to align with what we were looking at on the whiteboard that the only the only nuance here was I think the daily perspective didn't have that top width. Um otherwise it was kind of picture perfection to what we were looking at on the whiteboard. Would you agree with that? Yeah. Yeah. Absolutely. That that's the only reason why I was a bit hesitant to just take sales directly off this 5 minute.
I had to wait for some sort of confirmation to tell me, oh, I think we want to go down and not sweep this high and actually make that topic on the daily. And when when you get that little bit of hesitancy if something doesn't align completely kind of how you would like, do you adjust risk perspectively like to to kind of accommodate for that degree of hesitancy or do you is risk just kind of standard regardless of whether it's evaluation or funded? you have your protocol and that's what you stick with.
I feel like if I genuinely feel like, oh, this isn't like great, we do have this potential like we can maybe push up even higher, I might drop my risk a bit because we might hit stop loss, we might push up higher and then get the sell. So, I I might drop my risk a bit. So, in this scenario, I did reduce my risk. Instead of 5K on my 500K account, I risk like 2 and a half or 3K. Okay, just in case we want to push up higher, I might be able to risk another 2K.
That'll be a total like 1% for that trade. Okay, you need the number one trading tool for traders. Introducing Tradezella. It doesn't matter if you're a forex trader, a crypto trader, an options trader, or even a futures trader. Tradezella is for everyone. To be profitable, you need to have an edge. Tradezella allows you to identify, manage, tweak, and refine your trading edge. You can connect unlimited accounts to Trade Zilla.
It will pull all of your data onto a dashboard. It gives you in-depth analytics, and this makes journaling so easy. You can add playbooks, trade replay, full back testing, all in one single tool. By using Tradezella, you'll not only understand all of your trading data, but you'll get feedback on exactly what's working and what isn't. Use code PFT for 20% off the yearly subscription or PFT 10 for 10% off the monthly. Try it out and watch your trading transform.
And do you ever do you ever give yourself multiple attempts at one of these areas? If you get that scenario where for example this initial attempt um was the one that obviously rejected this time but if this failed for example and you got stopped out and it came back up into this area and then started rejecting again would you give yourself a second go? Yeah absolutely. If if we start breaking structure again after taking this high yeah absolutely I'll take another bet.
Do you do you have a limit on how many times you would attempt that? Yeah. As long as I don't reach the daily draw down I'll keep going. Yeah. Fair enough. As long as the the as long as the setup's valid. We've had a valid break of structure to the downside again after sweeping the highs. I will take that. But if I'm getting to my daily draw down, then I kind of have to stop. But I will keep going until I get to that point.
Got you. Got you. All right. This is a pretty clear-cut example. Have you got any more to to kind of throw our way? Yeah, absolutely. I've got a gold trade that I'll show you next. All right. So, this is the trade that was taken on gold during the Asia session. So, this isn't London. This isn't New York. This is just Asia session. Literally just before Asian open. M. So all I was doing was looking at lower time frame inefficiencies and kind of following that on the new day because I've been seeing gold just typically follows lower time frame structure really well.
So in this scenario we can see this one minute inefficiency here. We tap that we continue up higher. Cool. Then over here once we pushed up impulsively we had this one minute here. We tap that push up again. Then this is where I actually woke up. So, this isn't me waiting for this. I literally just woke up and gold was kind of coming down. I just looked quickly. I was like, "Oh, we have a 1 minute over here. Cool. Let me take a buy as we tap into that." So, I had my limit set and my stop loss was simply below the candle that created that inefficiency.
No, sorry, it was below this wick low here. Now, the reason I didn't wait for a confirmation is if I wait for a confirmation on the one minute time frame as I'm trading the one minute, price is going to be all the way up there. It just doesn't make any sense. M. So I might as well just enter knowing that look, price is tapping them, continuing up, tapping them, continuing up. So I'm going to expect the same. So I'm just following lower time frame structure, placing limits on your stop loss below the zones.
So this one minute inefficiency was created by this candle. So stop loss just below it. Now this candle didn't have a bottom wick. So I just kind of kept it a bit lower just below this wick over here. That's again that's just discretion. Mhm. And then now target-wise, where would I have been looking to close out? Now, this is where I'm kind of looking at a different time frame 15-minute. Go to the 15minute. And then what do I see?
Oh, over here we are pushing bearish. We had broken this low. So, we are bearish, but I'm I'm taking buys. So, that might seem strange, but look, we have we are bearish. But what happens after we push bearish? We expect a retracement up to then continue down. So, where am I expecting a retracement up to? We have a clear 15minute inefficiency right here. Again, look, a gap between candles that that never got tapped into.
And that's where basically I got out of my trade. And then again, if you go to, let's say, just a 3 minute just to make it a bit easier to see in terms of premium and discount. If we mark out the high and the low uh down there. So this move straight down you can see that zone sits in 50% like above 50%. Right? So we in all of this we never retrace up into this 50 uh uh 50% or above. So we have this premium area that we never tapped into.
We're probably going to tap into a premium before going down. So I'm not looking for sells anywhere down here. I'm actually looking for buys up until a premium area. and then what also lines up with the premium area. A 15-minute inefficiency. So, I'm taking a buy up to that zone. Now, I'm not taking sells because again, I didn't really know what's going to happen after that and Asia session can be quite weird, but it's just taking lower time frame structure along the way.
And then we target the 15-minute inefficiency that was up in a premium area. Look, it's just a staircase. I'm just following structure. And this was the trade. That simple. And that was what a one to six just like that in the middle of the night. Do you do you ever I know you said you were targeting the the 15minute um inefficiency. Yeah. Would you ever then refine that 15-minute area down to a like a 5 minute or a 3 minute or a 1 minute to look for a very specific exit point or as long as you out somewhere in that range that's good enough for you.
Yeah. So it depends. If that zone was really big then I'll start refining it. But you can see like even one minute candles like even just one single one minute candle takes up almost 30% of the zone. So it's like well it doesn't really matter at that point. I'll just get I'll be safe and get out of the 15-minute open. Yeah. So yeah I mean that that's what I did in this scenario. And even if you look at the other time frames you can see we had a small 3minut one here.
Okay. Now because we have a 3minut one here and in that so this is the whole 15-minute inefficiency here. Yeah. Within that we have two zones. I don't know. Are we going to tap that and go down? Are we going to tap that and go down? I might as well take the bottom one and which also happens to line up with the 15inut start anyways. So that's kind of what I'm looking at. It's like where could we maybe reverse from and I'm getting out before that.
Okay. So the this kind of Asia trade one is this kind of the example where you're showing us on the whiteboard where it's a little bit more fluent and you're just looking at the price action from a lower time frame. Yes, it's it's it's lower time frame and I'm buying up to the zone. Okay. Normally, I'll wait for it to be tapped into, then get a reversal, and then take that. This is me going to that zone on the lower time frame.
So, these are like my different plays that I have. Got you. Got you. All right. Yeah. Makes a lot of sense. And just for again clarity on my side, when you took this entry down in here, you said this was literally just a blind limit order that you have. The buy limit. Yeah. Got you. Got you. Just a buy limit below the and a stop loss below the wick close of the candle that created that zone. How how often do you find you suffer with slippage?
Because I presume obviously trading a one minute chart, you can get quite tight entries. Um, and obviously your stop loss is sometimes not going to have the most amount of room. Yeah. Do you find slippage is is a bit of an issue for you with this strategy. It depends on the prop firms. Some prop firms are great. It closes exactly where it's meant to. Some get slipped, but I mean, you can cry about it, but I just kind of take it on the chin.
Like the game is the game. The game is the game. Is it making me money? Yeah. Do I lose a bit here and there because slippage? Oh, well, fair enough. Fair enough. Okay, cool. And I think you had one final example to take us through, right? Yeah, one final example on German 40 where I took a loss. And I'll talk through that. And it wasn't even because of the actual strategy. It was just me being stupid. I'll talk I'll talk through that.
Nice. So, this is the loss that I took on German 40. Again, it's a very textbook setup where Asian range consolidates. We sweep the high. I took my sales to take the Asian lows. I'll tell you what I did wrong, and I'll tell you exactly where I was entering, why, and all of that. So, let's go to the 5-minute time frame. Actually, I think I looked at the 15-minute on this scenario here. We had the Asia range consolidating.
We had swept the Asia high first. That's important. Whichever one we sweep first, if we're consolidating, if we sweep the high, I'll take sells. If we sweep the low first, I'll take buys. That's kind of what I'm looking at. And then looking at higher time frame zones, you can see 15-minute clear inefficiency right there. We're sweeping Asian highs, tapping into that 15minute. And then what what happens on the 1 minute?
You can see we consolidated consolidated. We didn't tap it even right here at 7:52 a.m. London time. We didn't tap it. Only at London open at 8:00 a.m. did we finally wick into it. And even after we wicked into it, yeah, we had a big candle down, but there's no inefficiencies on the 1 minute for me to enter off. Okay, so now I'm looking at I'm just asking it, please just create me some sort of inefficiency to enter off.
And then we can see right here we push up higher re sweeping that high we start pushing down more and then we start breaking structure to the downside finally and then we can see finally after pushing down breaking structure we create this 1 minute inefficiency here. So sell there and the stop loss was literally this was a very risky one stop loss just above the wick of the candle that created the inefficiency. Okay, TP at the Asian low wanted to.
And look, this is the type of trade I'll just take because it's quick and I just want to make that consistency account. And I did hold this trade. Now, here's the stupid thing that I did. Okay, we I know statistically if we sweep Asian high, we're probably going to sweep the Asian low like 90% of the time if Asia range was consolidating. But I looked at a previous low that was kind of close. I thought, hm, let me hold it down to this low here.
M no did not happen. I kept telling myself in the car because I was in this trade whilst I was in the car. I was like, "Look, keep your TP there. That'll be 15K for you." Uh something like that. I'm happy with that. That's more than enough. No, I wanted that 20k just down there or something. That's where I was stupid. I just held when I really shouldn't have because again, that's just me being greedy, wanting a bit more.
That's my safest target. Asia low and Asia high, they're my safest ones. anything past that now I'm adding risk. Can can I be honest? There's and again I'm I'm looking at this from an outsider in a part of how you described your strategy when you exit is all about the impulsivity of a move, right? And whether you determine whether you want to hold that further than typically an Asian range target was always about how impulsive the move is.
And again, maybe this is just my eye, but from what you're looking at here after you entered, that to me looks fairly impulsive. Exactly. So, from how you describe things, actually extending that target and looking for a little bit healthier of an exit. Uh whether it's in terms of profit or, you know, an area on the chart actually doesn't seem that crazy. I know in hindsight it's obviously easy to say, well, [ __ ] I should have obviously exited at my Asian low, it would have been the easiest thing to do.
But actually from how you've described your play, had that come down and grinded into it and slowed down a little bit, then maybe I could have said, you know what, maybe you did the wrong thing by trying to extend your target. In all honesty, and again, this is probably one example of many hundreds that you've taken. Yeah. In this example, I I don't think I I don't know, maybe I'm just being kind, but I don't feel like you should be kicking yourself for that because from how you described exiting, that looks impulsive and there should be maybe room to to look to extend that target.
Yes, that's true. But I believe on the higher time frame we were still bullish. Okay. And I and I knew I shouldn't really be looking for sells. I would rather be looking for buys simply because we can see we were just pushing up, pushing up, pushing up. There was no reason for me to actually because look, you know, this move down here, we didn't break any lows, right? If we had broken this low here because of this move, then taking sells from there to continue down lower makes sense.
We didn't break structure. So that was literally just a reaction to take down the take out the Asian high Asian low and then I don't know what happens after but if this had broken down lower breaking actual structure then sells make sense. So my cell didn't make sense to hold on to it cuz we didn't move any lower to break this low initially. So I'm using a zone that didn't even break structure. Got you. Does that make sense?
Yeah. Yeah. And then what what really annoyed me after this was I could have also taken buys. This is a textbook setup again where if we clear all of this, I had taken my loss. Cool. What happened? We swept Asian low. Cool. We swept Asian high and low, but overall structure is still bullish. Now play the 1 minute. I didn't do that. But 1 minute pushes up. We see we break the structure to the upside. Now we break the high, right?
We have a one minute inefficiency right there. I could have easily taken buys there and then continued the structure all the way up. And even if I miss this initial entry right here again, we push up and we create another one minute inefficiency there. We tap into that again and then we push up even higher. So, it's all of these things that I could have done afterwards, but because I was so fixated on taking the sale, I just didn't see that, oh, we're actually reversing, I could take the buy.
How often does something like this happen to you? H I don't know. It's It's not that often anymore. M I'm a bit more vigilant on oh taking a loss but we're flipping now let me quickly take the buy but this one I was just so attached to it and this wasn't even longer this like a week ago or something or two weeks ago and I don't know I was just really attached to it how how long does that take you mentally to recover before you can take the next trade like are you out of the are you out of trading for the rest of that day now before you can kind of mentally be in a place where you can see things clearly again oh no not at all typically the moment we hit this stop I'll be like all right fine let me take buys We're tapping into this zone now.
We're flipping structure to the bullish side. Let me quickly take buy that. Typically, I will do that within minutes of taking a loss. But in this scenario, I I didn't realize in the moment that this move down, it never broke structure to the downside. We just moved down and then we kind of started consolidating. We never broke structure, but for some reason, I thought we had I thought, yeah, we should be pushing bearish, but we we shouldn't have.
So, that was completely on me. I was just fixated on sell sell. I didn't realize, oh, it's actually moving as it should. Fair. So, this loss wasn't because of strategy. It was rather me not noticing something. Fair. Fair. All right. I think um that was a really good insight, really good breakdown, and I I think you said it very clear at the beginning, which is actually your strategy is fairly simplistic. It it's fractal in terms of time frames, and once you kind of know what you're looking for on one time frame, you're basically doing the same thing on on a lower time frame as well, which I like.
Very simplistic, I think, for a lot of people watching. Um, and for people that are trying to still find their edge in the market, this will give them maybe a good foundation to work from. Um, so honestly, thank you. I really appreciate you allowing us to kind of pull back the curtains and see exactly what you're looking for on the charts and it's obviously led you to a place where you've extracted a huge amount of money from the prop firm space.
Um, and hopefully it will bring a lot of value to our audience. Man, I appreciate the time today. No worries. Thank you guys and girls. Thank you so much for tuning in to another episode. I hope you have found this one insightful. If there has been something in here that Zamco has shared with us today that's going to help to improve your technical approach, let us know in the comments. We'll be reading every single one of them.
Um, thank you again to Zamco for for being with us here today. It's always been a pleasure. I look forward to seeing you guys in the next one. Taking it.
The words are the caption track's own and nothing is reworded or re-transcribed. Paragraph breaks are placed between sentences so the text reads as prose.
Free tools for your own script: paste a draft and see where it stands before you record it.
Paste your draft and see where viewers are likely to drop off, with a rewrite for each weak line.
Paste the first 30 seconds of your own draft for a hook score and rewrites.
Check your draft against YouTube's advertiser-friendly guidelines before you record it.
Read this channel's public videos and transcripts, and download a writing brief for it.