Getting the transcript
Reading the captions from YouTube. A video nobody has opened here before takes 10 to 30 seconds; this page fills in on its own.
Getting the transcript
Reading the captions from YouTube. A video nobody has opened here before takes 10 to 30 seconds; this page fills in on its own.
Aleks Rosme · @aleks_rosme
Words
2,387
Runtime
16:22
Speaking pace
146wpm
Reading time
10min
146 words per minute, below the 160 25th percentile of 349 measured videos. That distribution comes from the 349-video hook study.
Opening (first 30 seconds)
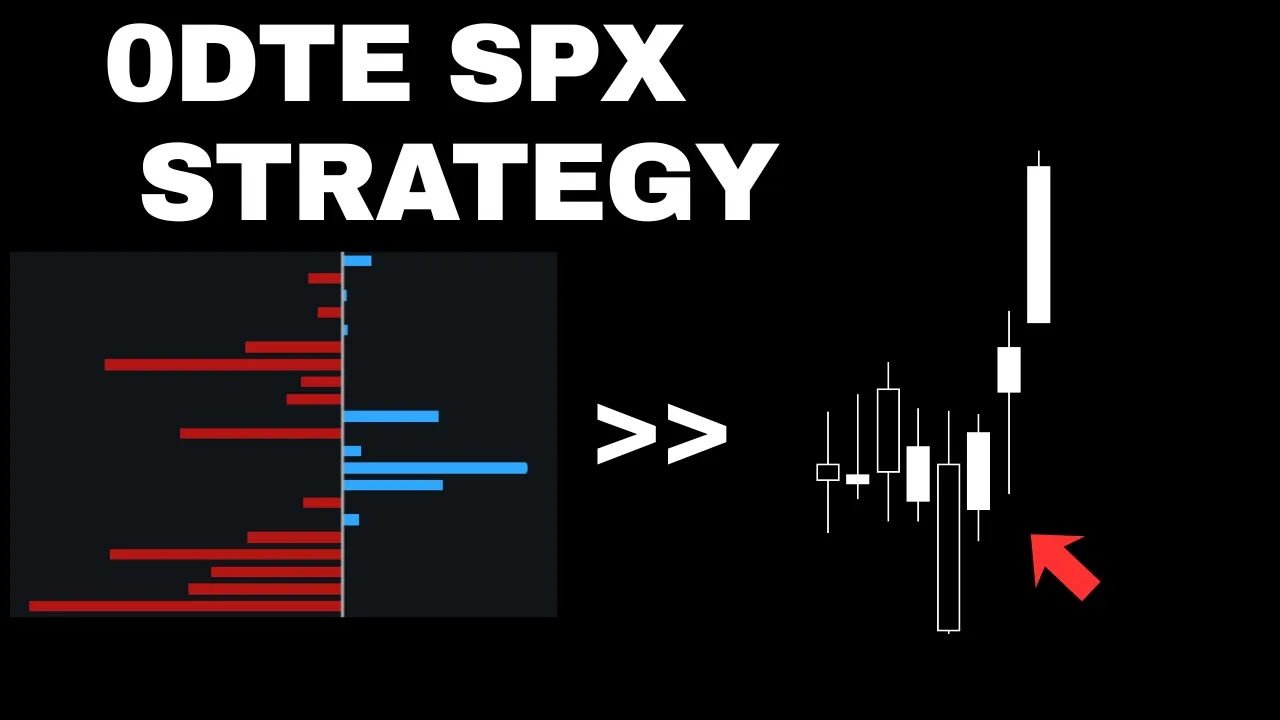
The world of zero DTce options is exploding right now as traders see an opportunity of buying an option and seeing 5 10x returns in a matter of minutes or hours. And in this video, I'm going to demonstrate you why S&P is big reason to it. How to use S&P data even if you trade NASDAQ or other individual tickers and the best ways to capitalize on it such as dealers exposure
73 words, the words spoken in the first 30 seconds at 146 words per minute.
Free, no signup. See how the first 30 seconds hold attention, with rewrites.
Sentence shape
| Measure | This transcript |
|---|---|
| Sentences | 179 |
| Average words per sentence | 13.3 |
| Longest sentence | 160 words |
| Questions asked | 29 |
| Sentences containing a number | 24 |
Most used terms
Filler phrases
56 in total: right? 22 · um 11 · uh 8 · you know 6 · actually 5 · kind of 2 · like 2.
A literal whole-word count of the same phrase list the Prepublish browser extension uses, so a phrase inside another word is not counted and a phrase used in its ordinary sense still is. It is a count and not a judgement.
Run the check on the words above: where attention is likely to drop, with a rewrite for each weak line. The free check shows the scores and the one issue costing the most.
What this transcript is
Every word below is the caption track YouTube publishes for this video, pulled from the video itself and reproduced unchanged. It is not Prepublish's writing, not a summary, and not a re-transcription: it is the video's own published captions. English captions, generated automatically by YouTube, in the video’s original language. Source: the video on YouTube. A channel that would rather this page did not exist can ask for its removal through the contact page, and it is removed.
No Script X-ray for this video: YouTube shows a Most replayed graph only once a video has enough views.
The world of zero DTce options is exploding right now as traders see an opportunity of buying an option and seeing 5 10x returns in a matter of minutes or hours. And in this video, I'm going to demonstrate you why S&P is big reason to it. How to use S&P data even if you trade NASDAQ or other individual tickers and the best ways to capitalize on it such as dealers exposure and looking at market makers positioning. First of all, let's talk about zero DTE options specifically for S&P and how big this market actually is.
So, let's look at this paper published by CBOE back in 2022. So, the picture it paints is absolutely crazy. S&P volume measured in millions of contracts every single day, dominating index options market share with same day expiry, zero DTE, now making up the majority of S&P volume. So you can look at these numbers on the screen. It's around 65 70% of overall volume. That's zero DTE. That's how crazy that is. And if you just compare S&P options volume to other individual tickers such as Micron, SNDK and Palenteer, you can see the staggering difference.
And even if you compare it to other top ETFs such as SPY or QVQ, you can see the difference is around 10x. And it's clear that it's a center of gravity of modern equity trading. But size alone isn't why S&P data is so special. What makes SPX unique is structural, right? So S&P options trade essentially exclusively on CBOE. That's only one venue. And CBOE tags traders as opening or closing, which means you can reconstruct what customers actually did and therefore what inventory dealers actually hold.
So that's a real positioning not model positioning for every multi-listed product such as QQ spy single stocks you face a tradeoff we've covered before so cross exchange data is complete but it's slightly assumed right so tagged data is real but it's partial so is the one major index product where the tradeoff disappears also on wix right so two assets that I traded on CBO E SPX and VIX, right? So the tech data is the book with near full coverage.
You can see everything there, right? So combine that with who trades it, the deepest institutional hedging flows in the world, and you get something genuinely rare, the biggest dealer book in existence, and you can actually read it. That's why it's the first clean of my morning every single day. Now, if I trade NASDAQ, why do I even care about S&P options? Well, three reasons. First of all, it's a correlation. Look at the top holdings of both indices.
The same handful of meggaap tech names dominate S&P and NDX. These are not two separate markets. A dealer hedging SPX exposure is trading the same stocks that drive ENQ. Second is a spillover. When the S&P book forces large hedging flows, that pressure doesn't politely stay in ES index arbitrage and correlating hedging drag. every index future along NQ included right so this is how option low mechanics work third reason is regime right so the spax sealer book sets the stability of the whole tape when the book is long gamma and comb deep bought rips get sold and my levels hold the best when it's short gamma moves run and the same ENQ levels become acceleration zones so I check I spx before I trust anything on my chart That's usually um my pre-market routine.
But enough of the theory. Let's get straight to the tools that I use. Tool number one, S&P gamma levels, right? So, I want to focus on the positive side because that's where the support and resistance logic lives and try carrying large positive dealer gamma below current price is not just the level. As price falls toward it, dealer hedging mechanically respond by buying. If you're not familiar with upsal concepts, you should watch my other videos.
But let's continue. The dip gets absorbed. This is just basics of it. Same logic goes for large positive gamma strikes above us. So, they're going to act as a magnet and ceiling. So, ris grind into it and stall because hedging leans against the move. And here's the part that makes SPX levels different from the naive levels that we've built in other videos because this is a tag data tool number two. This is where SPX data stops being just better and starts being a different sport like it's different beast.
The gamma surface most gamma exposure charts you've seen are a single curve. Every expiration collapse into one line with assumed signs. So the surface keeps both dimensions exposure by strike and by expiration. And on SPX it's built from tagged data. So the signs are real. So why does the expiration axis matter so much? Well, because gamma with different times you expire is different gamma, right? So especially in zero DTE, you can see that it fluctuates a lot, right?
So throughout the day it's going to change 50 different times, right? So and it's going to be at its peak uh by the expiration by the end of uh you know um trading session. So looking at gamma surface chart you can just drag your cursor you know at whatever strike whatever time and it's going to show you the exact number at this specific moment. So, it's just absolutely crucial for your precision. And finally, tool number three, the charm surface.
If you seen my Greeks video, you know charm. It's delta DK, the passive wind. So, dealer hatches bleed off as time passes, forcing a slow persistent flow through the session. And it never triggers the trade. It supports one or suppresses one. The charm surface show you where that wind is generated. Decay pressure laid out by strike and expiration with real signs because again tagged data CBOE data and charm has a very specific geography.
It concentrates near the money and near expiration. Deltas decay fastest on options that are close to the strike and close to the clock. So big zero DTE book near current price or a loaded opex week it's going to have this big big influence on the price especially uh during PM session two things that charm helps me with each morning direction is the first one which way today's decay flow leans supportive or suppressive relative to my bias of course and strength of it so how concentrated that near dated exposure is which tells me how much weight the wind deserves in my sizing.
And the gamma surface shows me the walls, right? So the charm surface shows me the wind blowing between them together. That's the whole spx picture. You want to combine those two surfaces. That's the whole edge. Here's how those two compress into your morning routine. Step one, gamma levels, especially positive nodes. This is where I'm going to be looking for support and resistance. And I'm going to show you how they work in a second.
Step two, the gamma surface. It's telling me about the current regime. Uh whether I want to capitalize some continuations or I want to take some reversals. And step three, the charm surface. So direction and strength of our trend. But now let's get to the actual trade example that I took on Tuesday. Also on Friday, I'm going to show a few examples. So, let's read through my pre-market plan that I always drop on my Discord for free.
So, as you can see here, I said that positive gamma on both GQ and SPX today. Um, this is at least while thinking because data is going to fluctuate a lot and I'm going to show it to you a little later. So, you can see that very bullish sentiment. No wonder because it usually happens during recovery. We were during this recovery phase after we established this dip. We already reclaimed 7,600. Next target is 7,650. 30k contracts sitting there.
Same playbook as yesterday on QQQ. This would be 710 blah blah blah. By the way, IV tanked around 70% as of now on S&P tech. Still chasing it. Okay, perfect. So we said that we reclaim this 7,600 level and our next target is going to be this 7,650. Right? So we know that positive gamma is going to act as a magnet. Well, especially such big positive gamma. You see this is the biggest strike on the whole book and it has around 3 uh 2,000 contracts here. can validate this same thing on this customer's board.
So um you can see this is huge exposure of this positive gamma here huge positioning sitting there. So we understand that is definitely a point of interest for us. So it's going to act as a magnet. Well then what we see here is that we were retesting this gamma peak right? So these gamma peaks right here, they're going to act as uh support and resistance, right? That's one piece of data. Then you look at this, this is another piece of data.
Then we already looked at the IV, right? So that's implied volatility. That's another piece of data. And then here we can see that charm was suppressive this whole session but um it is not going to be as useful at the beginning of a session right so it's always going to be at its peak as we approach this you know these um expiry nodes you see that so they're going to be here right so here I can say that we retest this gap gamma I'm sorry not the gamma but charm zero so this is happens when charm uh flips and that's also kind of bullish signal for me right even in the first 90 minutes right this is what I trade you can see that we're retesting this little line here same thing with gamma and we understand that 7,650 is going to be our ultimate target here you know inside of these whatever 20 minutes right so we opened went very very strong here and I took this little trade on NASDAQ.
So this is how I apply that. Okay, I look at SPX for context and then I go for my net shift, go for my levels on Gu and NX, right? So I so I trade multiple assets here and you can see around 9:40 this is where I took my long and I held it for 10 minutes and closed right here. And where did I close it? Well I closed it around this 7,650 um price on S&P right so where we had 30,000 contracts sitting there. And the thing about this strike here is that those positive nodes are going to act as support and resistance, right?
So support can turn resistance and vice versa. So this is my favorite type of setup. So I take break and retest, right? So you can look at this example here. That was absolutely beautiful. We reclaim this note then continue going up and then we railed up probably yeah 100 points after that. Here is another example from this week. Let's read through my pre-market plan. So, I said that NASDAQ is climbing up into positive gamma territory blah blah blah.
It's all about NASDAQ here. And then I say that on S&P we are in 50 points range today. 7775 7725. We will see whether Q intraday exposure aligns with them. Could catch some great breaking retest. Charm is mostly suppressive. Jobs reported positive. Good sign. Um, in order to be very bullish, we would need to see us going straight to the east one, right? So, we said that um 77 and then 7725. So, 25 right here and then it's 7775 here.
So, where does this come from? Well, you look at these right here. is the biggest positive notes for today. Okay. In between them we have this pocket of this negative gamma. Okay. So also you can look at it this customer's exposure. See that? So it's going to validate your idea here. Okay. So if you look at what was happening around these levels, you can see that we tested this 7,725 and that was actually the bottom of the session and we knew about this level 30 minutes before a session, right?
Whatever like a few hours before a session because this data is going to be seen during pre-market as well. Okay? And that helped me to take a few shorts during this session. Right? So I trade on ENQ on NASDAQ and this was my ultimate target. All right? And you might ask me, well this has never played out. Well, it doesn't have to play out. Okay? It is just theoretical level that is going to uh have some resistance to it or support to it whatever you know whatever direction if we come there perfect or if we retest this one at first that's also perfect and the reason why we never reach the 7,775 strike is because of implied range levels right so we understand that this session is probably going to stay in the range because we said that WIX is very low, right?
It's Friday, no news, no nothing. So, um, we've had NFP before and usually when NFP is very, very aggressive, then we're going to see some kind of either V-shaped recovery or you see this thing on the screen right here. Right? So, another reason here is because we've had this implied range. So these are new levels from options depth that are going to be calculated from zero DTE ATM implied volatility structure. So you can use either anchored ones or rolling ones.
Right? So let's use those two two deviations here. Let's apply it. And you can see that this one level was little lower here. We understand that we have positive gamma here. And then this level was around 7,760 and that was exactly see top of this move which is absolutely unbelievable. You could play it just um inside of this range taking this trade from here to here. But instead of it, I took three trades targeting 7,725.
The words are the caption track's own and nothing is reworded or re-transcribed. Paragraph breaks are placed between sentences so the text reads as prose.
Free tools for your own script: paste a draft and see where it stands before you record it.
Paste your draft and see where viewers are likely to drop off, with a rewrite for each weak line.
Paste the first 30 seconds of your own draft for a hook score and rewrites.
Check your draft against YouTube's advertiser-friendly guidelines before you record it.
Read this channel's public videos and transcripts, and download a writing brief for it.