Getting the transcript
Reading the captions from YouTube. A video nobody has opened here before takes 10 to 30 seconds; this page fills in on its own.
Getting the transcript
Reading the captions from YouTube. A video nobody has opened here before takes 10 to 30 seconds; this page fills in on its own.
Aleks Rosme · @aleks_rosme
Words
1,957
Runtime
12:20
Speaking pace
159wpm
Reading time
8min
159 words per minute, below the 160 25th percentile of 349 measured videos. That distribution comes from the 349-video hook study.
Opening (first 30 seconds)
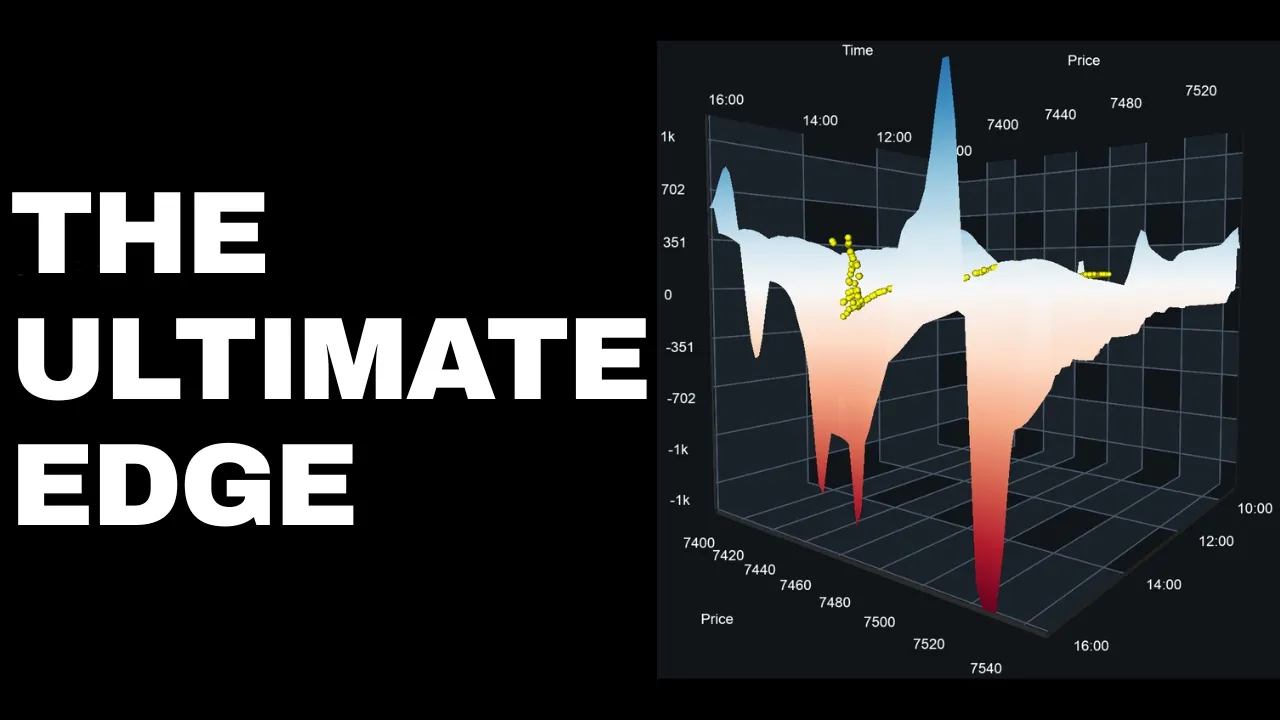
Every morning before the New York open, the most important levels on my NG chart are already predefined. They're not coming from yesterday's highs and lows, supply and demand, liquidity, or support and resistance. They're coming from the options market makers exposure, so-called gamma exposure levels. In this video, we will break down what gamma exposure levels actually are and why price respects them. And if you want to take trades like these, then you should stay until the end.
80 words, the words spoken in the first 30 seconds at 159 words per minute.
Free, no signup. See how the first 30 seconds hold attention, with rewrites.
Sentence shape
| Measure | This transcript |
|---|---|
| Sentences | 141 |
| Average words per sentence | 13.9 |
| Longest sentence | 41 words |
| Questions asked | 13 |
| Sentences containing a number | 14 |
Most used terms
Filler phrases
62 in total: you know 24 · um 13 · right? 8 · uh 8 · like 5 · actually 3 · kind of 1.
A literal whole-word count of the same phrase list the Prepublish browser extension uses, so a phrase inside another word is not counted and a phrase used in its ordinary sense still is. It is a count and not a judgement.
Run the check on the words above: where attention is likely to drop, with a rewrite for each weak line. The free check shows the scores and the one issue costing the most.
What this transcript is
Every word below is the caption track YouTube publishes for this video, pulled from the video itself and reproduced unchanged. It is not Prepublish's writing, not a summary, and not a re-transcription: it is the video's own published captions. English captions, generated automatically by YouTube, in the video’s original language. Source: the video on YouTube. A channel that would rather this page did not exist can ask for its removal through the contact page, and it is removed.
No Script X-ray for this video: YouTube shows a Most replayed graph only once a video has enough views.
Every morning before the New York open, the most important levels on my NG chart are already predefined. They're not coming from yesterday's highs and lows, supply and demand, liquidity, or support and resistance. They're coming from the options market makers exposure, so-called gamma exposure levels. In this video, we will break down what gamma exposure levels actually are and why price respects them. And if you want to take trades like these, then you should stay until the end.
So, what is a gamma exposure level? Well, let's start with a mechanism. When options get bought or sold, market makers take the other side, so they have to provide this liquidity and they don't capitalize on major moves how traders do, right? That's not their goal. Gamma is the Greek that forces them to keep rehedging as price moves. So, that rehedging is real buying and selling pressure landing in the market you trade.
So, now that hedging pressure isn't spread evenly across all strikes. So, it concentrates at strikes where big open interest is sitting, right? So, big gamma exposure is sitting. And a gamma exposure level is exactly that, a strike carrying large gamma exposure. A concentration of forced mechanical hedging at one specific price, which is why price reacts there. A dealer with a book has to trade when price hits that strike, whether they want it or not.
It's just their job to provide liquidity, otherwise financial markets would not exist. And you need to understand that gamma exposure levels does not tell you price will go there. It tells you price will react when it arrives, okay? So, these are going to act as magnets and inflection points. Before we get into gamma exposure levels, let's quickly break down two data types because every gamma exposure chart is built from one of them and they are not the same.
So, data type number one is so called naive calculation. So you take open interest from every exchange apply fixed assumption about how dealers are positioned meaning short equals put and long equals call and you compute exposure at every strike. So it has some strength and this biggest strength is that you know it's complete. So you can use it across different in video tickers stocks QQQ and the X by and open interest is going to cover every venue and every strike which is exactly what you want when you're building a map of levels.
The only weakness is assumption. So nobody really checked what customers really did at each strike. So the sign of the exposure can be wrong at some levels but it's not a big deal because it's you know practically impossible to get tagged data from every single exchange that Nasdaq trades on, right? Data type number two is CBOE tag that's the non-naive approach. So CBOE tags option traders as opening or closing so you can work out what customers actually did and therefore what inventory dealers actually hold.
So there is no assumption to it. So about real positioning and the only limitation that this tagging comes from CBOE fit only. So for multi-listed products like QQQ and the X and so on you're seeing a slice of the book, right? So it provides this SPX and weeks data only. So besides that there are no tickers available. But you know the way I use it as NQ trader and Nasdaq trader SPX is not my market but it's you know heavily correlated with it.
So I use SPX tech data for general context, what regime the broad market is in, whether real institutional positioning is building, where it's building, whether, you know, the biggest book in the world agrees with what I'm seeing in tech. One thing to clarify, if you trade S&P 500, this is not context anymore. SPX is your underlying index that's directly connected to your um execution, to your performance. So, the tech data is describing the dealer book of the exact market you trade.
So, if you trade ES, Cboe tech data is a must. Now, let's get to my actual setup. As an NQ trader, my levels come from the gamma exposure maps of QQQ and NDX. Every single morning translate into NQ prices. This is where I post my pre-market plans on Discord. So, the levels are structured up and structure needs a completeness that only open interest based data gives you. So, I look at both products because they're two independent pools of open interest on the same underlying market.
This is very, very useful to combine them. And that's what makes the most important concept in my work possible, the compounded level. So, most mornings the two maps one match, but when the same zone shows large exposure on the QQQ map and the NDX map at the same time, that's two separate dealer books with forced hedging stacked at one price. So, those zones get, you know, absolute priority in my plan. That's my bread and butter.
Let's go deeper into the gamma exposure map itself because it's not only about put and call walls, it's slightly more sophisticated. First, zero gamma, flip point. This is where the net dealer gamma crosses zero. So, this is the single most important line on the map, in my opinion, because it's not really a level, it's the regime boundaries, regime change. So, when price is above it, dealers net long gamma and levels tend to hold better.
But then, when price below it, dealers net short, the same level start accelerating moves instead of stopping them. This is where you want to take continuations. And if price crosses this flip intraday, your whole playbook changes with it. This is what I constantly preach and talk about in my previous market plans. So, second, the largest positive strike. This is uh so-called call wall. It's going to be uh either magnet or resistance or support, right?
Depending um where we at. We can break and retest it. It's perfectly fine with me. And the third um largest negative strike, so-called put wall. Same thing, uh but it's not going to act as a magnet. You can use it um as pretty much um support and resistance. It doesn't really matter. We can break and retest it. We can reverse from it because it's, you know, you need to understand it's more about open interest than about the actual gamma mechanics, you know, in when we talk about QQQ data.
So, and finally, individual clusters. So, these are going to be several gamma strikes you see on your internal map. And you need to treat them as your zones for uh continuation trades, for break and retest. This is the best way to do this. And in the trade example that I'm going to demonstrate to you, this is exactly um what I used. I used an individual cluster. And one problem with everything so far, a level on its own is directionless.
So, it tells you price will react there, but it does not tell you whether to buy this reaction or sell it. This is why you need to use other filters like order flow. And my favorite one is a net trade. So, that's a cumulative net premium flow on QQQ building through this session. It analyzes every single trade across multiple exchanges. So, that is going to give you this understanding of aggression and the flow. So, the combination is very simple.
If, let's say, drift is building higher, price pulling back into one of my marked levels, I'm interested in longs at that level. So, if drift is going lower, price rallying into level from below, I'm looking at that level as place to fade. All right, so this map is going to give you location and drift gives me you know, the bias, right? The side that I pick. Coming to the actual trade example, this is my pre-market plan from Tuesday.
I drop them on a daily basis in my Discord for free. So, we have this negative gamma on Qs. Same on SPX today. 680 area will act as a key point to work with. as a pivot point and then 670 is another potential POI, right? So, we said that second scenario played out yesterday, you know, we got out of this range. So, we have this bearish momentum. And today, it does not seem like we're about to reverse. IV is at 75%, not as expensive yet.
Focusing on continuation play until we break 679 would make the most sense. So, I said the continuation play until we break 679. So, you know, the better word to say unless we break 679 here, right? So, I said that, you know, 677 if we respect that, perfect. Okay, that's a pivot point. Below it, we're going to be bearish and next inflection point here is 670. So, we have this room here and our main job here is to find an actual trade, you know, find a way to get in.
So, this is where gamma exposure is going to help. All right, so looking at this um interface from QuanData, looking at my template, you can see that net truth was pretty neutral at the time, you know, it was like kind of, you know, indecisive, back going back and forth. So, this is, you know, if it's unclear, you go and check NZX. What was happening on NZX? Around my entry, you can see that someone sold almost 600,000 worth of calls here.
See that? So, this drop of calls, you know, this massive sharp drop, same thing on volume here. And that state, you know, puts state above zero. So, that's perfect for me to take the trade. That confirms my bearish sentiment that was coming from my pre-market plan, okay? So, okay. Let's look at levels, and you see that we are under this negative gamma um environment, negative gamma surface. So, looking at QQQ, I used QQQ for this specific trade.
So, you see 677 is perfect, and then 670 is also um going to act as my main target here. And this is where we uh look at individual clusters, as I already mentioned. So, here, that was pretty beautiful for me, you know, so that had around 60 million worth of uh negative gamma exposure at this level, 673. So, that was exactly this level. We reclaimed this level, and this is exactly the point where I'm going to look at the order flow.
So, now we're going to use order flow as another piece of the data, so you can see that we were retesting this POC at the time. So, it was, you know, this major major seller that we, you know, retesting, and we already trapped some buyer there uh if you look at footprint chart. So, now this is important. See how we trapped this buyer, 61 buyer there. And that's um another confirmation that seller is sitting there. So, passive seller just absorbed 61 um aggressive contract, you know, hitting the market.
And um that was my confirmation to take that trade, you know, after I wait for some aggression and then retest. This is uh exactly where I take my trade. And I took this trade for the final four R. Um you know, which is not too bad for a regular Tuesday. If you want to learn more about gamma exposure, you should join my Discord server. I drop my pre-market levels on a daily basis. They're absolutely for free. We host live streams providing bunch of value, so you should check this out.
The words are the caption track's own and nothing is reworded or re-transcribed. Paragraph breaks are placed between sentences so the text reads as prose.
Free tools for your own script: paste a draft and see where it stands before you record it.
Paste your draft and see where viewers are likely to drop off, with a rewrite for each weak line.
Paste the first 30 seconds of your own draft for a hook score and rewrites.
Check your draft against YouTube's advertiser-friendly guidelines before you record it.
Read this channel's public videos and transcripts, and download a writing brief for it.