Getting the transcript
Reading the captions from YouTube. A video nobody has opened here before takes 10 to 30 seconds; this page fills in on its own.
Getting the transcript
Reading the captions from YouTube. A video nobody has opened here before takes 10 to 30 seconds; this page fills in on its own.
Aleks Rosme · @aleks_rosme
Words
3,393
Runtime
22:43
Speaking pace
149wpm
Reading time
14min
149 words per minute, below the 160 25th percentile of 349 measured videos. That distribution comes from the 349-video hook study.
Opening (first 30 seconds)
We all heard about order flow, footprint charts, big trades, volume imbalances. Everyone is saying that it's key to reading the market, but only few people actually become profitable with it. And the reason for this is because it lacks structure. You can understand depth of market perfectly, read tape for 5 hours, and know all these patterns like icebergs and pulling, but you'll never become profitable by just doing this without proper context and
75 words, the words spoken in the first 30 seconds at 149 words per minute.
Free, no signup. See how the first 30 seconds hold attention, with rewrites.
Sentence shape
| Measure | This transcript |
|---|---|
| Sentences | 307 |
| Average words per sentence | 11.1 |
| Longest sentence | 54 words |
| Questions asked | 54 |
| Sentences containing a number | 37 |
Most used terms
Filler phrases
98 in total: right? 31 · you know 27 · uh 12 · um 9 · like 8 · kind of 5 · actually 3 · basically 3.
A literal whole-word count of the same phrase list the Prepublish browser extension uses, so a phrase inside another word is not counted and a phrase used in its ordinary sense still is. It is a count and not a judgement.
Run the check on the words above: where attention is likely to drop, with a rewrite for each weak line. The free check shows the scores and the one issue costing the most.
What this transcript is
Every word below is the caption track YouTube publishes for this video, pulled from the video itself and reproduced unchanged. It is not Prepublish's writing, not a summary, and not a re-transcription: it is the video's own published captions. English captions, generated automatically by YouTube, in the video’s original language. Source: the video on YouTube. A channel that would rather this page did not exist can ask for its removal through the contact page, and it is removed.
No Script X-ray for this video: YouTube shows a Most replayed graph only once a video has enough views.
We all heard about order flow, footprint charts, big trades, volume imbalances. Everyone is saying that it's key to reading the market, but only few people actually become profitable with it. And the reason for this is because it lacks structure. You can understand depth of market perfectly, read tape for 5 hours, and know all these patterns like icebergs and pulling, but you'll never become profitable by just doing this without proper context and location.
This is exactly the structure that order flow lacks, and the solution for this is options flow. In this video, I'm going to explain how to create an ultimate edge by combining options flow with order flow. Most people don't want to go deep and really understand where order flow is coming from because order flow is just a representation. So, it does not come out of a thin air. It gets created. And how does it get created?
Well, by price drivers. For example, we have real stocks, we have earnings, we have different macroeconomical events. But the most important one of them is the options flow. So, dealer hedging in the options market. When a market maker sells you an option, they're exposed. So, they hedge by buying or selling futures, normal ES and Q contract that we all trade. So, price moves, their delta changes, and they have to trade again to rebalance.
This constant rebalancing is the price movement that you see on the chart. This is how order flow gets created. Order flow, again, is just a representation of orders that come in. That hedging pressure is the main reason why we see market moves, and it's not only SPX, meaning S&P 500. It flows through QQQ, NQ, every single asset that you can imagine that correlates with options market. And why do I even talk about options?
Well, the scale of what's happening in options market right now is genuinely wild. The US options market has been growing for straight 7 years, 25% annually. Average daily S&P premium traded a lot on the S&P is 7.2 billion per day, meaning no one wants to buy stocks anymore. They can owe it, but they don't want to trade it. So, everyone wants to trade options nowadays, and especially zero DTE options. So, 55%, 60% of S&P 500 options expire the same day they're traded.
So, this hedging pressure flows through QQQ, through NQ, ES, every futures contracts, you name it, every single session. And this is exactly the reason why we see those wild moves nowadays. And the best way to trade futures nowadays is to trade it with order flow. So, for example, by using footprints, big trades, delta, these tools tell you what's happening at the tape right now in the real time at this precise moment.
But, it has a problem. It has no structure. It lacks this location, you know? And you see a big buy prints hitting the ask, let's say, and delta second bullish, it looks strong, but all of a sudden your setup is failing because it does not make sense to observe order flow without the right context, right? So, what happened there? Well, you're buying at, let's say, gamma exposure level or against that in negative gamma exposure without the right net trip, without context, without location, all of these different things.
It has to be aligned. So, order flow told you that someone was buying or selling, and option flow told you who was on the other side and why they're winning. So, by looking at option flow, you can track market makers, and one is good, so order flow is very good, but again, it lacks structure. The other one is also very good, but it lacks some precision. Option flow lacks entries. You cannot really enter a trade by looking at option flow.
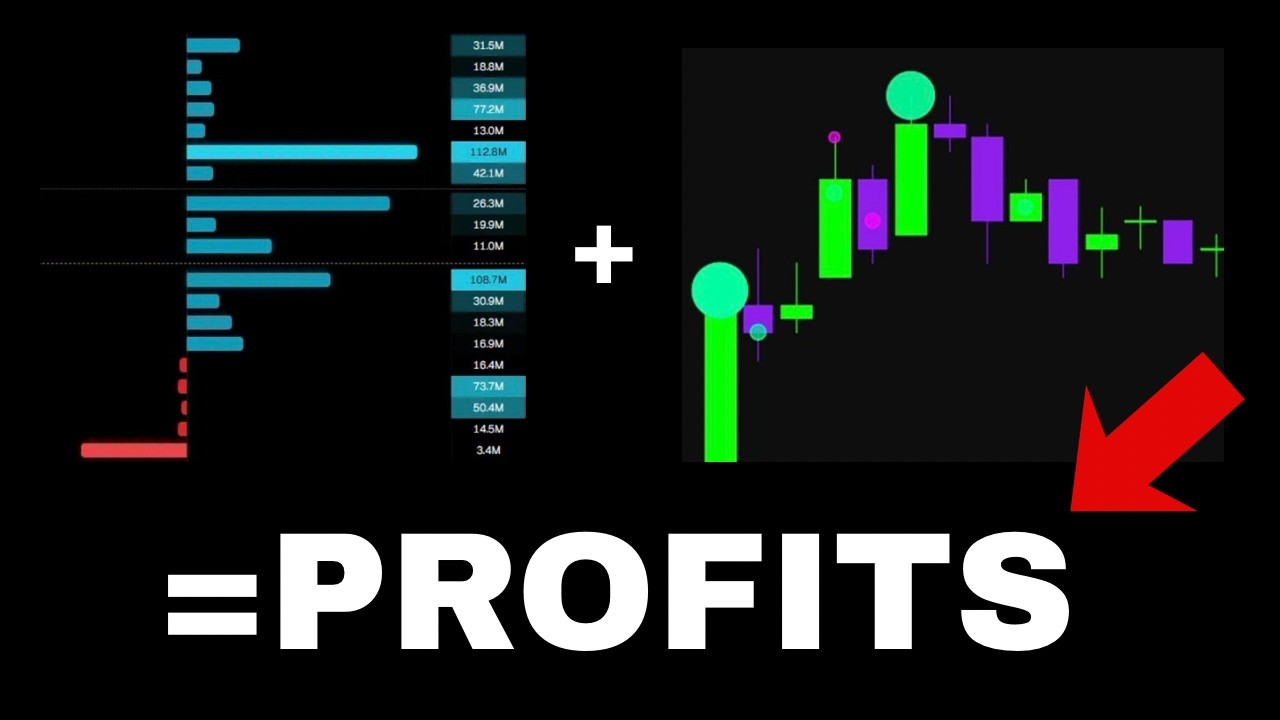
Together, if you combine them, that's the insane edge. And this is exactly what I'm going to show you today, how I combine options with futures and why I think that's the ultimate edge. Before I show you the trades, I want to establish exactly how I think about order flow because most people just simply overcomplicate it. So, I simplify it down to one concept, the law of effort from Richard Wyckoff. So, he described it compared rallies and reactions in terms of price spread, volume, and time.
Pretty simple. And let's say if buyers put in effort and price moves, they are rewarded right now, okay? If buyer put in effort and price does not move, they're trapped. And trapped buyers become fuel for the sellers. Same on the other edge, right? So, vice versa, trapped sellers become fuel for buyers. The bigger the trapped position, the bigger the move when it breaks. But, the critical part is law of effort only works when you know why the level matters.
Any price can show absorption, so you can see absorption every every 5 minutes, every probably 10 minutes, you can see beautiful absorption setup. But, are you going to take every single setup or you want to go for one single opportunity, one single A+++ setup? So, any candle can show stacking. And the question is that is this level that dealers are mechanically defending? That's what options still answers. So, the process is actually very simple.
It's always the same thing. Context first, location second, net premium flow third, and order flow is last piece of the puzzle. So, mind you, that's the very, very last piece of the puzzle. It's never the starting point. And to check order flow, I use deep charts, I use big trades. This is my first filter, and my second filter is footprint, right? So, combining these, they will give me the timing. Okay, I can see absorption, delta second, exhaustion.
But, it is important to say that it has to happen around gamma exposure level. Right, so regime has to match, net trip has to be aligned, big trade has to be there, and footprint has to confirm it. Five out of five, you know, factors that I'm looking for, that's a full size. This is where I execute. By the way, in my Discord community, a link is going to be under this video. I shared my signature templates for deep charts and quant data.
Other than that, I share daily pre-market routine, key levels, breakdown of my trades, and all of that completely for free. So, you better check this out. And now, let's go over some examples to really show it to you. So, I want you all to understand how it works, how to combine it. So, I'm going to work with my Discord with my pre-market plans to simplify kind of. So, this is my plan for Monday. So, as you can see here, we have a positive gamma.
Charm is impressive, range EPA day. That was my pre-market plan that I dropped. And then, main levels for me are 745, 733, and 740. Right? Gamma flip point is my favorite setup. If we get a pullback there with positive net premium flow, A+++, right? Let's see, SPX deltas are negative, but it won't be a problem to flip anything below 1 billion. So, here, you see, these are my levels, 745, 740, 732. Okay? This is gamma exposure that I use uh on quant data options.
And then, that's the charm surface to kind of understand where we are on SPX as well. This is negative delta. So, this is my plan, right? Now, what happened here? Well, I marked out the 745. The reason for this is because we've had negative gamma exposure there. Big level there, perfect. Now, let's pull up quant This is the platform that I use. So, you understand here we have this gamma flip. There's a potential setup that I was anticipating.
And 745 that was my main level of interest. Well, let's pull up Quan data. And see what's going to happen here. So, on Quan data, this is my template that I dropped on my Discord as well. Here's what you can see. All right. So, looking at this net delta around 7 45, we've had 250 million. So, it's not actually uh the nicest delta, right? So, it can be flipped very easily. And as you can see, this is green. So, um those can become negative where, you know, very quick.
And then what I can see here around 745, we've had this level of positive gamma exposure. 173 million. That's very, very, very big level. So, for me um under positive gamma surface, under positive gamma regime, we have a high probability of a reversal, right? We all know that. Same thing here. On NDX, we've had this positive gamma. So, we can anticipate mean reverting environment. Here, looking at this net trip, confirming net trip with gamma exposure.
Same way as I explained in my previous video. So, you should check this out. Here, see that? So, we are pushing up, but this push is basically fake. And the reason for this is because we have no support from um from the net trip, from the premium flow, right? So, as you can see, we are dominating from this put side. So, puts are dominant, and calls they're below zero. Volume is negative, so I pay attention to uh QQQ only, right?
So, I pay attention to SPX and DX as well, but mainly to QQQ to be honest, right? And you see this push this push all the way up. That was pretty synthetic, you know? This is what I call. So, it's like a fake pullback. Price is moving. Yeah, of course, but how, you know, how far we're going to go? Well, not really far as you can see. And we touched the 745. Um there was 200 million positive gamma. We've had some attempts here, but we never had the confirmation, so let's take a look at the confirmation.
Let's replay a little bit and see what happened inside this piece of price section. So, it happened around this time. Right here, so that's around 4:00 p.m. So, this is very important right here. This is the first touch on 745, so as you understand. And here, as you can see, we got those buyers stepping in. These buyers trying to step in, but we see no aggression, right? We see no initiation. We see these guys try to step in, but sellers and they never got rewarded.
So, if we're going to see a close aggressive closing volume chart, then um it's a sign for me to take a trade, right? So, unless we're going to see an aggression here. You see this? Same thing, right? We're Even we are uh forming those deep effort zones, but it doesn't really matter because we have no right context. Okay? So, we have to push a little deeper into this gamma exposure to see what is going to happen right here.
And for me, how I use order flow, I kind of simplify it down to law of effort from Richard Wyckoff. So, let's pause real quick. So, for me, it's very important to track track participants. That's the first step. So, someone has to get trapped. At this point, what I see here is you can see these buyers stepping in. So, on the footprint chart, 151 here, 254. These are two footprint charts that I use, right? So, bunch of buyers here at the top were trying to push the price up, right?
And here, there's even deeper effort zone got created. Perfect. Essentially, what we need right now, we would need to see some seller step in on the footprint chart, maybe big trades. Same here, around this imbalance, around this deep effort zone, and I'm going to take this trade, okay? So, I kind of simplify it down, you know, I didn't really try to look at uh depth of market. I don't spend my hours there and uh you know, over complicate it.
For me, confirmation is the very, very, very last piece of the puzzle. So, you see some trapped buyers, then reorder the sellers, and this is it, right? So, that's that's your confirmation. So, let's see what happens here. Whether we ran this zone right here, so you can see some seller stepping in. Perfect. That's my confirmation to take that setup. Stop loss goes, I'd say, right here. And then, for my targets, what I usually do, I go over here, and then, for example, my target is going to be this volume area low right here on this bell curve because we've had this um you know, we got out of the volume then we get get back to this volume.
And um according to auction market theory, we have to run down to this volume area low. So, that's the first target. And then for a second target I'll take something here, probably this seven 739 7 38 whatever, you know. So, going to take it here and let's just replay it real quick to see what happened here. So, let's take my target probably here. That would be the best. You can see some sellers trying to step in. I'll trail the stop loss at this point.
If we're going to run this seller, yeah, perfect. Trail my stop loss. Retesting that VWAP. Let's replay a little bit to make it quicker. So, trapping this guy right here. Can even trail my stop loss a little bit more. Then we see those deep efforts on get created. But, where we at? Well, we are at the middle of this range. So, as I said, you know, location and context, they do matter, you know. And it doesn't make sense to trade without context, right?
So, you are just simply going to lose money, right? That's why I emphasize using Gamma Explorer, I emphasize doing pre-market plans, you know, um paying attention to macros to all of these, you know, different things that are going to give you this solid understanding of what is going to happen in the markets, right? So, we said that this whole move up is synthetic, right? So, it's not real. It's basically fake. They're just pushing uh the price up to get better prices for their positions, right?
And we sell right here. See this on the net trip. So, volume is also negative. This is negative. Here we have this level and then we have this confirmation. Okay, let's do one more quick example right here. That was a Thursday's trade that I took and here you can see this is my pre-market plan as I always post them. Yesterday Micron and Nvidia earnings came out, which led QQQ going from 705 up to 725. Looking at unusual flow from credit options, someone bought 152 worth of calls yesterday at the open that expire on 26th, bullish sign.
The earnings report pushes above the 4720 level, meaning now we, you know, next target is 730s, which has the biggest positive gamma and will act as a magnet if we can hold above 725, right? That's very, very important. I always go for two scenarios. If not, already negative gamma surface on SPX will help us going back to 720-717 range. Look at how after GDP came out, we rejected exactly from this 728 level. Coincidence?
Let's cook. Perfect. So, you look at these levels that marked off 728, 725, right? So, I was saying, "Okay, well, if we can hold above 20 725, then let's go up to 728. Let's reclaim this and then let's see uh whether we've had we have some, you know, push up to 730, which is also very important level. But, what happened here? Well, we opened very, very aggressively and broke this level, right? So, for me, my bullish idea was invalidated this this second, okay?
But, it's all cool. We can, you know, adapt and see what's going to happen next, right? So, we broke this level. We are ultimately bearish this point. Okay, let's confirm it with options flow again. So, let's go back here. And then what I saw on options flow, well, the options flow, we had this level right here 725 that we reclaimed, but then we had 744. But, I had no gamma exposure. This is why I always have NDX open.
What we saw on NDX, we had some more clean level right here. So, this level right here of 100 million. And you have to understand it's not going to happen as precise always, right? For me it was enough to have this kind of pullback, right? Because gamma is not like a specific price point. It's more like a zone. So, you have to treat it as a zone, not as a as a price point. So, like, let's say 745. This is why I always, when it comes to QQQ, you see I mark this up as a zone, right?
Same thing on NDX. So, we came back on NDX, this is major positive gamma, we know that. Positive gamma acts as a support and resistance. And what we saw here on QQQ was not as good as yesterday on on previous this on previous example, but you see around 735, regardless we've had some puts dominant, you know? Also here, we've had negative volume. So, that is valid as well, especially uh taking this aggressive order flow into consideration that I'm going to show you real quick.
So, let's take a look. This is where we open. This is this huge candle. Let's replay a little bit. And let's take this trade. So, we see this aggression. We see deep efforts on try you know, trying to get created. And then buyers try to push every leg. You see this? And they cannot succeed. So, here we see some major selling. And now all I need basically is to wait for a solid pullback, right? So, it's like I don't need anything else.
I need a pullback. I need to get in because to me looks very, very nice. And you see how I combine it with volume as well. So, this trade was from this um cash session POC. That's another confirmation here. So, you see how I stack these confluences. You see those buyers step in. Here buyers step in retesting those sellers, you know, one uh Here we are testing this POC once again. You see that? And then we see some sellers stepping in right now.
And this is my entry confirmation, right? So, I usually go with the flow. And you're going to see why I do this because this trade was pretty insane. To be honest, I really closed it very, very early. Which is not the best, but you know, it's because of consistency rule. I could I could go max for 1,500 per account, but you know, it is what it is. I closed it way too early, but ideally this is what my trade management should look like.
So, my first TP is probably check this out. Yeah, 720 pretty much. You see that? 720 is the cleanest one and here there's like huge potential in this day. So, we are consolidating a little bit. Those buyers tried to step in at the uh bottom right here. And my thinking process was, "Okay, if we can run these guys, that means that sellers uh you know, clearly won this. So, you see some sellers trying to step in and this is exactly, you know, the squeezed I was waiting for.
So, then that's the first TP right here. And then you can ultimately target whatever you wish, you know, 720. That's probably, you know, probably the best target right here. I don't even know what it was in NQ right now. Yeah, around this high. So, 720 was around here. But, there is a potential, you know, to run. And every time I'm in a position, trail my stop loss. Pretty much behind those deep effort zones. That's very nice.
Here, let's trail it more aggressively. Perfect. And we hit this trade.
The words are the caption track's own and nothing is reworded or re-transcribed. Paragraph breaks are placed between sentences so the text reads as prose.
Free tools for your own script: paste a draft and see where it stands before you record it.
Paste your draft and see where viewers are likely to drop off, with a rewrite for each weak line.
Paste the first 30 seconds of your own draft for a hook score and rewrites.
Check your draft against YouTube's advertiser-friendly guidelines before you record it.
Read this channel's public videos and transcripts, and download a writing brief for it.