Getting the transcript
Reading the captions from YouTube. A video nobody has opened here before takes 10 to 30 seconds; this page fills in on its own.
Getting the transcript
Reading the captions from YouTube. A video nobody has opened here before takes 10 to 30 seconds; this page fills in on its own.
The Inner Circle Trader · @InnerCircleTrader
This video has no Most replayed graph yet: YouTube shows one only once a video has enough views. These are the moments viewers replayed most in The Inner Circle Trader's most watched videos.
Most replayed moment at 51:50
3.7x that video's typical replay level
Okay? So, now we have two points of reference. Now, when I have this like that, I have two little sweet spots in the previous day's range and to the left of that, why? Cuz we're going to go back 3 days.
Said at 51:44
Most replayed moment at 12:06
4.1x that video's typical replay level
So we have relative equal highs during lunch macro, 11:30 Eastern time to 1:30 p.m. Eastern time. The setup usually forms in the first hour of that 2-hour lunch period. Okay? So between 12:30 noon
Said at 11:59
Most replayed moment at 10:06
3.2x that video's typical replay level
towards that of this buy side imbalance or side inefficiency, which is a suspension block, which has a volume imbalance on the high end and a volume imbalance on the low end. All right, so let's move into the lower time frames now. So, we're at a 1-minute chart.
Said at 9:58
The graph counts replays. It does not show where viewers stopped watching.
Words
4,991
Runtime
36:11
Speaking pace
138wpm
Reading time
21min
138 words per minute, below the 160 25th percentile of 349 measured videos. That distribution comes from the 349-video hook study.
Opening (first 30 seconds)
All right, folks. Welcome back. All right, so this is the NASDAQ daily chart. And if you see this wick, we were concerned about it going down and making a meaningful run below its consequent encroachment or midpoint in here. So since we went below it, obviously this is going to be a factor for price on the upside. So we're just going to take these lines off and
69 words, the words spoken in the first 30 seconds at 138 words per minute.
Free, no signup. See how the first 30 seconds hold attention, with rewrites.
Sentence shape
| Measure | This transcript |
|---|---|
| Sentences | 363 |
| Average words per sentence | 13.7 |
| Longest sentence | 162 words |
| Questions asked | 27 |
| Sentences containing a number | 23 |
Most used terms
Filler phrases
89 in total: like 30 · uh 20 · um 12 · you know 10 · kind of 7 · literally 4 · right? 4 · actually 1 · basically 1.
A literal whole-word count of the same phrase list the Prepublish browser extension uses, so a phrase inside another word is not counted and a phrase used in its ordinary sense still is. It is a count and not a judgement.
Run the check on the words above: where attention is likely to drop, with a rewrite for each weak line. The free check shows the scores and the one issue costing the most.
What this transcript is
Every word below is the caption track YouTube publishes for this video, pulled from the video itself and reproduced unchanged. It is not Prepublish's writing, not a summary, and not a re-transcription: it is the video's own published captions. English captions, generated automatically by YouTube, in the video’s original language. Source: the video on YouTube. A channel that would rather this page did not exist can ask for its removal through the contact page, and it is removed.
All right, folks. Welcome back. All right, so this is the NASDAQ daily chart. And if you see this wick, we were concerned about it going down and making a meaningful run below its consequent encroachment or midpoint in here. So since we went below it, obviously this is going to be a factor for price on the upside. So we're just going to take these lines off and just focus on consequent encroachment level. And you can see it's red here, that hue.
Okay, I'm going to make it a more vibrant red so it stands out on the chart a little bit. And I'm going to beef it up a little bit. All right. So that way you know that is this discount wick become premium array. All right. Uh these levels here we'll we'll look at that in a moment. We did clear out the relative equal lows we're aiming for last week and a little bit of a give back is reasonable. Immediate rebalance would be to this low and consequent encroachment of that daily chart. candlestick.
Let's go into an hourly chart. This buy side and balance sell side and efficiency from last week. Set price lower. And then we got to go into a one minute time frame. Okay. and I'll show you the business. So price climbed overnight reaching back towards that 1 hour buy bounce outside efficiency and when we opened at 9:30 Right there we ran above relative equal highs and towards that buy side balance sell side efficiency on the hourly chart.
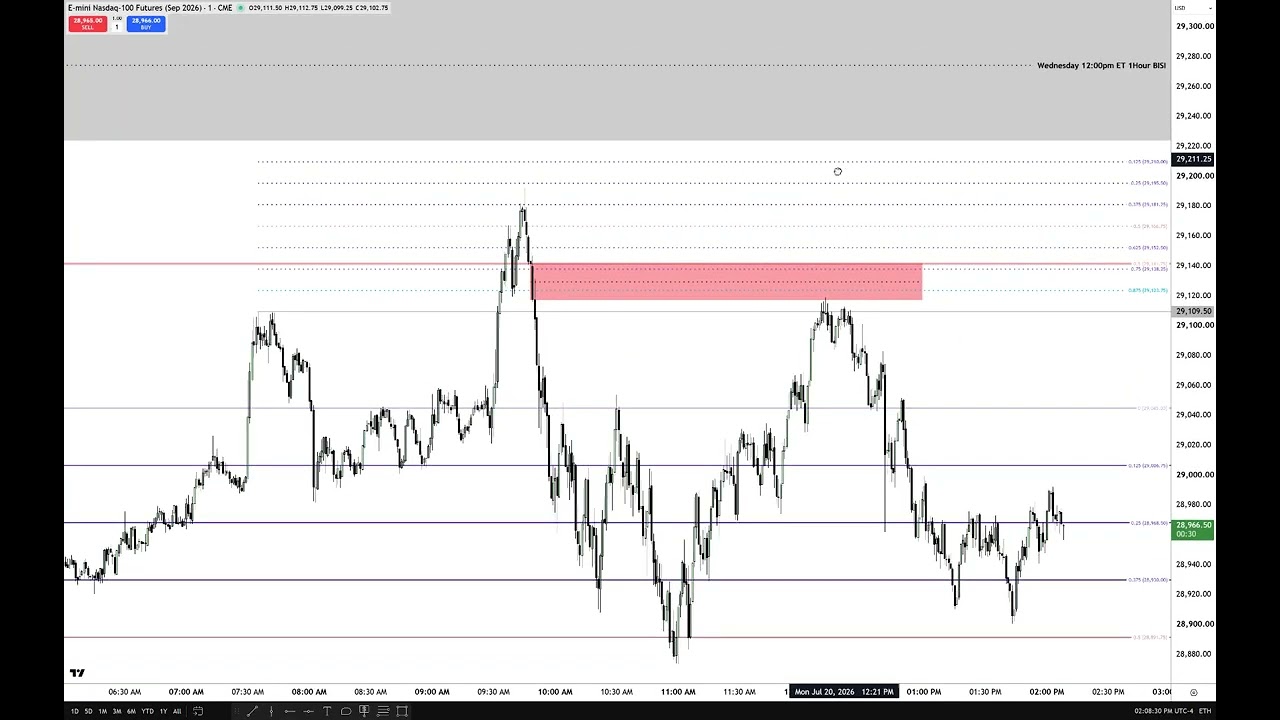
[sighs] Admittedly, as I outlined in the pre-market session, I wanted to see it drop down into buy side and trade into the regular trading hours, opening range gap consequent encroachment level in here. And they chose to do swing it first. This fib up here is anchored to this high. Let me make it a little bolder. This high. Drag the fib up to below the hourly bus sell efficiency. Now I want you to take close look at this level right here.
Okay? See that? This is not going to be the same number that the consequent encouragement of the trade execution video at the beginning of this video and what I shared on X. It's because I didn't have this one anchored. I just did a rough idea where I was just pulling it up like like this. I was doing this trying to you figure out where it should be visually and just let go of it. This is the actual level. Okay. And this is the actual level.
So if you want to be very very precise, then obviously go to your chart and place them on the key highs and lows that make up the ranges in which you're going to measure. And I indicated that the halfway point in here between this high and the buy center balance sell sign efficiencies low. So it's it's the hourly chart. See that right up here. So when price went above these relative equal highs, how high can it go, Michael?
Well, between that high and the low of the buy sign balance sell efficiency. Why am I even referring to that? Because it's the most salient specific price level on the hourly chart that stands out going to the left. And we went through it last week. So, it's reasonable as I gave guidance in the pre-market session that I wanted to see it drop down, take sell side, and then run up there. And then I would have went short using this area up in here.
But because it just started right out the gate at 9:30, right there, that's a Judais swing. It took out buy side. We gapped higher. Uh 930's opening right there. That's the opening price. That's the regular trading hours, opening range gap high. Why is it the high? Because we settled down here on regular trading hours. toggle back to the regular trading hours on Friday right here. And here's the opening at 9:30 Eastern time for regular trading hours.
Restart for Monday's trading. So that's your that's your gap. Consequent encroachments here. We traded down into that. It didn't get there by 10:00. U the first time it reached it was 1055. That's okay. Then we traded all the way back up. Touched the gap. that will go back into the electronic trading hours four. So when price went to consequent encroachment of the gap between the old high here and the low of the hourly buy sign balance sellside sign efficiency from Wednesday noon Eastern time that's where you anchored it to by it trading to a high here.
Look at look at this candlestick's high. 29,167.25. Look at that price right there. Same bit of business here. a high not shell in the Got to make sure I'm on the right candlestick here. Old eyes, folks. High is 29,167.25 and 166.75. So, we essentially hit it, came back down lower, rallied one more time. But notice the first time it hit consequent encouragement, that's this level right here. The bodies couldn't touch it.
It was just the wick. And then we ran right through it here and we get to this octin here and it fails to touch the upper quadrant. So, there's three things here happening. the bodies can't touch consequent encouragement breaks lower then it runs through these highs. This is engineered buy liquidity. That's why you watched me shorting it when we went above here. And I'm trying to short it anywhere between the upper quadrant level between the 1 hour bissy's low from last Wednesday at noon to this old high.
So I'm measuring some range that nobody else would have been paying any mind to. There's no other school of thought that's going to be focused on this bit of price action. No, no one else is looking at that. Not in the way in the context I'm giving you here. So, if I'm going to concern myself with this old high and this buy sell side efficiency from last Wednesday's hourly chart at noon time, Eastern time, if I think it's going to fail to get there, well, I I want to see it create a short-term high and give me evidence around consequent encouragement because if it's bearish, the upper half this right here, that's going to stay heavy and below it, it's okay to see bodies left in there.
But if we create a short-term high, then I'm expecting this to be a turtle soup false breakout run on engineered liquidity. So they ran right from 9:30 right there on that candlestick right from the open straight up short-term high run it then breakd down. Well with that what I was looking at is we went above a short-term high right off of a juda swing which is one directional rate at the 9:30 opening regular trading hours beginning time and we're getting the evidence that the bodies can't touch consequent encroachment we ran through.
So, if you're struggling with, well, what about this? There's bodies in the upper half, right? It has to have bodies up there. If it's going to run this high out, think about it. I want to see buy side engineered and then ran out, but still keep the same signatures with the orderflow concepts that I teach where the candlestick body ain't touching the consequent encroachment between here and here. This is event horizon.
It's a midpoint between two key PD arrays. rallies up the bodies can't even touch the upper co octin at 875 I'm sorry 375 pardon me and then the high here can't even touch the upper quadrant so failure to touch there failure to leave a body and touch it there and failure to put a body at the consequent encouragement and then running by side there right off of the opening at 9:30 which is just straight parabolically going higher when we gapped higher And mid gap is down here.
Consequent encouragement register trading hours opening range gap midpoint right there. So because we're taking buy side here because it was a straight shot and because we're failing at levels that are key to determine this as it's probably run its course. Now what happens if it kept going higher? Then I would have stopped out. Then it would be a losing trade. How's that for logic? So you're afraid of that. I'm looking at all the things that's suggesting that it shouldn't be doing that.
It shouldn't do it because all things are indicating that it's just to get people chasing price higher. Now price breaks below that short-term low here and then we have market open trade up into consequent corrosion of this sell bounce by side efficiency then breaks aggressively lower. I liked this relative equal low initially and then this one here. So I had a limit order resting there and then I changed it down to here and then I wanted to see it reach down into consequent encouragement of the regular trading average opening range gap which again you see that when you toggle it like this.
That's this gap right here. Yesterday's regular trading hour settlement or Friday's rather. and then Monday's opening. So that's your regular trading hours opening range gap and mid gap or consequent encroachment is this level here. It has a very very strong likelihood to draw back down into that by 10:00, but it just so happened it took a little bit longer to get there today. And that's okay for a lackluster economic driver type of day today.
It's moved pretty handsomely. All right, so now let's take a look at the the details here. All right. So, first bit of business. I'll zoom in so you can see it. Really take in where I'm entering. And because of the logic I've been teaching ongoing and this is real order flow, algorithmic order flow that cannot hide from you. You can see it visually represented in the candlesticks. Okay? That's why you should not be looking at anything that's modifying the open, high, low, and close.
If you have anything like range bars or some kind of concoction that you want to present as a supposed an algorithm, [laughter] no. Um, the the bodies are not touching consequent encouragement. The wick can, but the wicks are allowed to do damage. The narrative and volume is really shown in the bodies. Then it rallies up and the bodies can't even lay on this octen. and then the wick can't even touch the upper quadrant.
So with an X-ray view, seeing price like this, we're seeing them heavily distribute into this run. So smart money can go long here, sell, and sell more to the engineered liquidity that it forms. When this starts to break down, people like to see that and say, "Oh, wow. It's going to start selling off and maybe it might run for these relative equal lows." right here. They put a stop loss right above that and then market rallies higher.
Not because of buying pressure, but because the algorithm will see this high and just simply repric up there. It doesn't matter how many contracts fill up here. Not every contract that had an order here was filled. Just because there's an old high here doesn't mean every contract with an interest to buy or sell there gets filled. The algorithm is not trying to make sure everybody gets a fill. the algorithm is simply presenting the opportunity for smart money to ride this rigged game.
So, because I have a little bit of experience and I know what I'm looking at, I recognize my algorithm and it's me selling short right here. Look at the look at the close. I'm selling right there as it's closing up right above this high. And then I start filling in real close to where I got filled here. Watch. Look there. Next candle there. And then a cell more up here. All where the bodies are. See that? So, a little bit of heat here, but then on the way down, bang.
All in this vicinity, right where smart money is going to want to try to accumulate. So, I'm in there doing an amazing feat of precision. So, and I'm not trying to be facitious or funny. I'm this is the facts. getting short and I'm going to be aiming for initially right below these lows here and you'll see that you saw that in the video but I'm trying to keep the annotations a little bit cleaner and then I'm moved it down here because I felt that the way it was coming down the speed at which it was doing it I felt that this was going to be pretty easy to get to.
So, there was a breaker here. High, low, higher high. This is your breaker. Okay? If it's a good, valid breaker, you wouldn't want to see the bodies trade up outside of it in the bodies. And it doesn't do that. Um, market breaks. There's a shift in market structure. Then we trade up to this volume and bounce high. That candlesticks open. We open, trade right up into that beautiful, beautiful delivery. immediately folds and goes lower and what could have been potentially a bullish um fair value gap turn inversion fair value gap uh it just wilted right on through that.
So that was giving me the confidence that right below these lows was not enough. I could put a a limit order to take out something below that. So let's do it like this. It started like this. This is my focus here first and then during the execution video you see me send then once this goes then focus right here. So with those two levels there you can then see my fills short short right here right below these lows. Watch right there.
You see it? It's real hard to see. Keep your eye right there. Watch. See it? Boom. There's that fill. And then we retraced a little bit in here. Uh I got a little concerned that it might have a sharper retracement. So I took one more off there. There was a fill. So below those relative of equal low still. That's one of those things I like to do is distribute my positions where uh retail may be wanting to take the opposite side of the trade.
And then we wilt here. I take one more opportunity. to close one position or one contract and then I was looking for consequent corrosion of the regular trading average opening range gap. That's that's this midpoint here and then by lowering my stop it came up and tagged it. So them's the brakes they call it. But eventually it did in fact go down into consequent corrosion on the reg trading hours opening range gap rallied up order block changing stay delivery here hits it and then we're using a octant which is the uh 375 level in agreement with an order block right here change the state delivery rallies up.
Same bit of business here. Rise up, consolidates, and then sends it right back up to this gap. Touches it right there. Does it do a body? No. Is that bullish? No. It's bearish. So, where's liquidity at? Resting right below these relative equal lows here. So, we could anticipate a run into that for lunch macro. Smoked. Look at that. Then we have another sell sign of bounce by sign of efficiency. And to the left of it, we have a wick.
Okay. So, let's measure that here to there. So, we want to see the inability to keep price above with the bodies. Here we have it there, but immediately look what happens. It opens and then gives up to go very very quickly. Okay. So, then we watch price meander around here. Now, we're sitting here. Okay. So, um, for a non news driven market environment today, um, that's pretty handsome distribution of, uh, shorts into a market that looked bullish to the public and then taking logical levels here to get out, then uh, getting stopped out on the balance, then going to my target, which is fine, you know um in the last I guess year I've seen a lot of this type of stuff happening and also a lot of my students are taking note that they're understanding more and more why I don't sit out here and give you entries and stop losses because I'm the largest one in the industry right now when it comes to this kind of stuff and if I get on live stream and I like I showed today I showed where my stop loss was I They even said that, you know, we're in that area where it's going to either go or it's going to stop me out.
And my stop loss was lowered down. And then it ended up hitting it right there. Look right here. That's where the stop was. Okay. It came up, made sure it took out that short-term low, and then went down to my target. Okay? If everybody that's following me and I tell them what I'm aiming for and where my stop loss is, 90% likelihood is going to go to where my stop loss is because it's easier to dis disrupt that because you're all basically going to try to piggyback what I'm trying to do with my own position, right?
So that in and of itself should tell you it's not buying selling pressure. It's 100% rigged. So if they can make me look like I don't know what I'm doing in front of all of you and whether there's an algorithm or not [laughter] I would do it. You if I was if I was watching a guy like me Mr. Hot Shot over here um claiming to know this that and the other thing if I put my positions out there and I put my stop loss there I would muscle it up there and just there it is by any means necessary.
And some of you say well they don't do that. Well, go listen to Pax Trader. He was a floor trader for the NASDAQ and he's literally I'm in a I'm in a space with him with Kit and he's re reliving a moment where he's out there he's trading and he had other entities in the pit with him that were literally trying to you know size him up and push him out of his trade and you but yet you say that stuff doesn't happen. Get out of here, man.
You listen to these people on the internet that maybe are on the stock exchange floor, but they can't be out there telling you that kind of stuff because everybody will lose interest in and trust in trading in it. So, they got to keep with the status quo narrative that it's it's a random market. It's buying and selling pressure and it's supplying demand. No, it's not. But you can believe that it's fun if if you want to have that.
You play time and make believe is is is interesting. But if you're going to think like a child, don't be surprised if you get childlike results. Okay? But uh the market came back up, hit the let me take this relative equal low line off this one here too. And we'll just have the opening range gap levels. Here's the open at 9:30 mid gap here. It trades all the way back up into the low of this inefficiency. Gives up the ghost works lower here.
And we have what I thought was actually an interesting point for u a full gap closure. If it can go all the way down into here, full gap a full gap closure. We have these lows here. And I I still think that these are potentially available. So let me address it like this. Okay. So that's still on my radar just like I think that um the relative equal highs on the uh NASDAQ they're potentially uh target on the upside. So I I I really favor it going down to go up.
That's kind of like what I'm getting at. Uh I wanted to see it do it this morning where it would would have went down first, then I would have targeted the 1 hour busy, then I would have shorted somewhere up here. But you got to you got to trade what they gave you, right? And if it's going to be a straight line shot right out of the opening range at 9:30 here when I'm already opening with a gap. So this is where we opened and this is where we were settled last Friday at regular trading hours.
So that's a big formidable gap. So, if we're if we're running right from opening at 9:30, chances are it's going to run out of steam somewhere. And you have to know the technical science. [laughter] I say that with tongue and cheek. Uh you have to know where they're likely to peter out. And there's no necessity for looking at any kind of tools outside of what I'm showing you here. What's so hard about this old high with relative equal highs and a 60-minute buy side and bounce sellside efficiency where it could draw to that was mentioned in my pre-market analysis. like I wanted to see it drop down first to go long to go that that would be where I would sell short.
I would sell my longs and reverse there. Uh but the market's being very very fickle right now. So I had to earn it this morning. This is this was not as easy as I make it look like. But um I was kind of regretting that I showed my stop loss publicly. But I get folks all the time saying that I I cherrypicked out of you know half a dozen laptops or whatnot. And you can literally see in the recording that I'm recording only one screen.
I'm not doing other screens. Um I'm constantly staying busy on this one. And it would be very very hard for someone to manage what they'd say I do and be able to be this precise with it. Okay. I I show you that Camtasia, which is the the element I use for recording my screen. Um, I show that I'm as I'm doing the things in the chart, I'm screenshotting them and then I'm tweeting them. So, I get a couple tweets together and then I post them.
If I move my stop loss, I post that. So, I I'm showing it publicly, but the wonderful thing I'm enjoying is that everybody sees how they're eventually gravitating to where my stop is when it's made public. That's not random, okay? That's not me not knowing how to trade. That's me sharing the very thing I tell you that these markets operate under liquidity. And if I have a stop-loss at a particular price level and I have 2 million plus people following me, it's safe to say at least 10% of you are contemplating doing something similar to that.
Even if it means chasing price action, which is why I say don't copy me and don't copy anybody else. Don't do that because you are not taking that trade because you figured something out. You're just assuming that I might be right because I'm popular in this industry. That doesn't mean I'm going to be right. I wasn't right here. It was I was right where it was going to go to, but they came up for my stop loss first and then went down to it.
And that was pretty much it. And that's been the low of the session so far. So, we're just meanding around in here. So hopefully you found something insightful in this. I gave a little bit of talking points today. I reprised the role of the inner circle trader and I had to go repent of it. That's what I meant by my tweet earlier. By the way, it takes a lot of effort for me to pretend to be that, you know, Stone Cold Steve Austin kind of guy.
Like it if you if you saw my kids and they had conversation with you that that that whole shtick that whole uh mask I use for marketing is very popular and a lot of you want me to talk like that and do those types of things. Uh but I don't want to do that and it's it's something I have to I I have to do periodically just to prove it's a turn on turn off type thing. It's a choice I'm making when I'm presenting stuff. Uh, in in these lectures, you know, I try to be the the do the Dr.
Jackekal. Okay. But when ICT persona is implemented, that's Mr. Hyde. That's a choice I'm making. Okay? It's not an imbalance. It's not me losing my control. It's literally me putting on a show to wake you guys up because I'm talking about something that may be very dry or boring. And if I get you all fired up or make you laugh about something and you feel like you're part of a joke that's, you know, pointed at another less inferior way of interpreting price action, it makes you feel like you're connected to me.
And that's just audience control. Okay? As a young magician, when I was a kid, I spent a lot of time studying how to engage with the audience and how to build a rapport with the audience. And I use a lot of those techniques when I'm educating and when I'm doing a lot of things in my lectures. I know how to pace things and because I talk to you in a certain way and I try to treat my audience as I'm talking to my kids, it makes you feel like I'm talking to you specifically, like I answered just your question.
So, there's been a whole lot of study on my part over the last 50 years as a an [clears throat] adult on how to deal with people on a psychological level. um giving them enough evidence to feel like they have something to pursue here and then staying long enough because I keep you engaged to prove that it was worth you staying here because you can do it in your own hands and it's okay for me to lay what you perceive as a weakness or a character flaw in your hands because then you feel like you're superior and you want to leave me a comment and say you need to see a psychiatrist.
Listen, if this is what look if this is what crazy looks like, then I got no problem with it. Okay? I got no I got no problem. If you knew me, you would know that I'm doing a really good job of acting as the inner circle trader guy, but that's not my persona. I'm I'm Mr. Rogers in reality. And I I I just tossed out because I had a couple people say, you know, I really miss the ICT persona. You know, it's a little boring listening to you now.
That's okay. You're going to have to start getting used to being boring, okay? Because the man's getting tired. He's getting old. And again, I can't promise I'm going to do that type of stuff in the future. It's just I just tossed it out there today to the raz razzle the the community up a little bit and I'm sure they're going to be sending me emails and saying you need to repent and if you're a Christian you wouldn't talk like that and they give me all the guilt checks but meanwhile they're probably at the bar looking at the girl at the other end of the bar hiding it from the rest of their family.
So they all we all have our things that's wrong with us, right? Okay. The only difference is I've not lied about mine. I've said it out here. is a ploy to hold young attention spans in my grip long enough for you to appreciate what I'm gifting to you and I could have sold to you. You could have been paying me money for all this stuff gladly and feeling pro to be honest with you probably most of you would probably feel like it was worth more to you because you paid for it not appreciation not appreciating the fact that I'm giving it to you for free because you're thinking it's if it's given to me for free then it isn't all that valuable and that's why a lot of you pay my students for them to echo what I've already said and sometimes they don't even echo it correctly but because you paid you feel like you're you're part of the initiated crowd.
No, you're just paying for something that's made available to you for free. And I'll leave you to that what that means in a sane uh person. Let's just put it that way. So, that's going to be it for today. Uh I'm not certain I'll be back here for anything else for the rest of the day. Uh but I'll come back at this again tomorrow, Lord willing, and we'll see what the market gives us. And hope you found something insightful today.
I hope you you're encouraged until talk to you tomorrow, Lord willing.
The words are the caption track's own and nothing is reworded or re-transcribed. Paragraph breaks are placed between sentences so the text reads as prose.
Free tools for your own script: paste a draft and see where it stands before you record it.
Paste your draft and see where viewers are likely to drop off, with a rewrite for each weak line.
Paste the first 30 seconds of your own draft for a hook score and rewrites.
Check your draft against YouTube's advertiser-friendly guidelines before you record it.
Read this channel's public videos and transcripts, and download a writing brief for it.