Getting the transcript
Reading the captions from YouTube. A video nobody has opened here before takes 10 to 30 seconds; this page fills in on its own.
Getting the transcript
Reading the captions from YouTube. A video nobody has opened here before takes 10 to 30 seconds; this page fills in on its own.
The Inner Circle Trader · @InnerCircleTrader
This video has no Most replayed graph yet: YouTube shows one only once a video has enough views. These are the moments viewers replayed most in The Inner Circle Trader's most watched videos.
Most replayed moment at 51:50
3.7x that video's typical replay level
Okay? So, now we have two points of reference. Now, when I have this like that, I have two little sweet spots in the previous day's range and to the left of that, why? Cuz we're going to go back 3 days.
Said at 51:44
Most replayed moment at 12:06
4.1x that video's typical replay level
So we have relative equal highs during lunch macro, 11:30 Eastern time to 1:30 p.m. Eastern time. The setup usually forms in the first hour of that 2-hour lunch period. Okay? So between 12:30 noon
Said at 11:59
Most replayed moment at 10:06
3.2x that video's typical replay level
towards that of this buy side imbalance or side inefficiency, which is a suspension block, which has a volume imbalance on the high end and a volume imbalance on the low end. All right, so let's move into the lower time frames now. So, we're at a 1-minute chart.
Said at 9:58
The graph counts replays. It does not show where viewers stopped watching.
Words
1,815
Runtime
14:40
Speaking pace
124wpm
Reading time
8min
124 words per minute, below the 160 25th percentile of 349 measured videos. That distribution comes from the 349-video hook study.
Opening (first 30 seconds)
Well, good morning, folks. Happy Thursday. Welcome back. All right, so we're going to take a quick look at FOMC for September 2026 for Nasdaq. We're at the daily chart here. I want to bring a couple things to your attention. So, this is obviously today, Thursday's trading so far. This is FOMC Wednesday. Tuesday, Monday. Now, I'm going to show you
62 words, the words spoken in the first 30 seconds at 124 words per minute.
Free, no signup. See how the first 30 seconds hold attention, with rewrites.
Sentence shape
| Measure | This transcript |
|---|---|
| Sentences | 177 |
| Average words per sentence | 10.3 |
| Longest sentence | 56 words |
| Questions asked | 9 |
| Sentences containing a number | 20 |
Most used terms
Filler phrases
24 in total: uh 9 · you know 8 · um 4 · like 3.
A literal whole-word count of the same phrase list the Prepublish browser extension uses, so a phrase inside another word is not counted and a phrase used in its ordinary sense still is. It is a count and not a judgement.
Run the check on the words above: where attention is likely to drop, with a rewrite for each weak line. The free check shows the scores and the one issue costing the most.
What this transcript is
Every word below is the caption track YouTube publishes for this video, pulled from the video itself and reproduced unchanged. It is not Prepublish's writing, not a summary, and not a re-transcription: it is the video's own published captions. English captions, generated automatically by YouTube, in the video’s original language. Source: the video on YouTube. A channel that would rather this page did not exist can ask for its removal through the contact page, and it is removed.
Well, good morning, folks. Happy Thursday. Welcome back. All right, so we're going to take a quick look at FOMC for September 2026 for Nasdaq. We're at the daily chart here. I want to bring a couple things to your attention. So, this is obviously today, Thursday's trading so far. This is FOMC Wednesday. Tuesday, Monday. Now, I'm going to show you what I was mentioning yesterday before the 9:30 regular trading hours opening session began.
So, there is Monday's high. And we're going to do this in black. And Monday's low. Okay. So, there's Monday's high and Monday's low of this week. And then here's Tuesday, same bit of business. I'm going to copy that, bring that down here. All right, and then we'll do the same thing here. All right, so Monday and Tuesday's respective intraday highs. Now, on Wednesday, we're going to drop down into lower time frames. I just know that this suspension block is what we keyed off of post FOMC.
So, that's what we have there. Okay, so we'll highlight that. And that'll make sense to you on the lower time frame. So, when we draw down to the 1-minute time frame, okay? And we'll grade it real quick. Don't need that. Okay, and then we don't need we don't need that. Okay? So, there's that bit of business. Now, we drop down to the 1-minute time frame. I got to add it, folks. People are taking my content, pretending they're doing all this themselves.
So, here at 9:21 a.m. yesterday, I stated a large range expansion was incoming, and not simply on the FOMC calendar because of the obvious nature of FOMC. Uh but, the daily chart and Q, uh we have inside days back-to-back. Meaning that that's scrunch this down once more. Okay, so here's Monday's daily low. Tuesday's daily low. Tuesday's daily high. Monday's daily high. Okay, so at this moment, we had yet to trade above Tuesday's high or Monday's high, or below Monday and or Tuesday's respective daily lows.
So, we'll go back here and show you. With new week opening gap here. So, now we can take these levels and calibrate them to this. So, we have that actual high from Monday and the relative equal lows here on Monday. And we can highlight these now as a sell side. And the same bit of business here, we're going to take this level for Tuesday's low. Bring it to that level there. So, there's your sell side. And then look at the relative equal highs here.
See how smooth that is? It's going to make sense in a moment, folks. I promise. Promise. And there's buy side here from Monday's high. See how painless that was? Very simple. But at this moment when I tweeted, we had yet to trade above these relative equal highs, which is Tuesday's high intraday, or daily high, rather, and then Monday's high. We had yet to do that, and we didn't take out Tuesday's low. Why is it not showing that?
Yeah, it's because of this. Bring it to the front, and it'll look right now. There you go. And same thing here. Bring it to the front. And then now you'll see the hue of being red. Now, let's bring our attention back to the session leading to FOMC. So, FOMC is usually a two-stage delivery. And I taught this many times before in the past. Okay, and [clears throat] this is Tuesday's daily high and the relative equal highs.
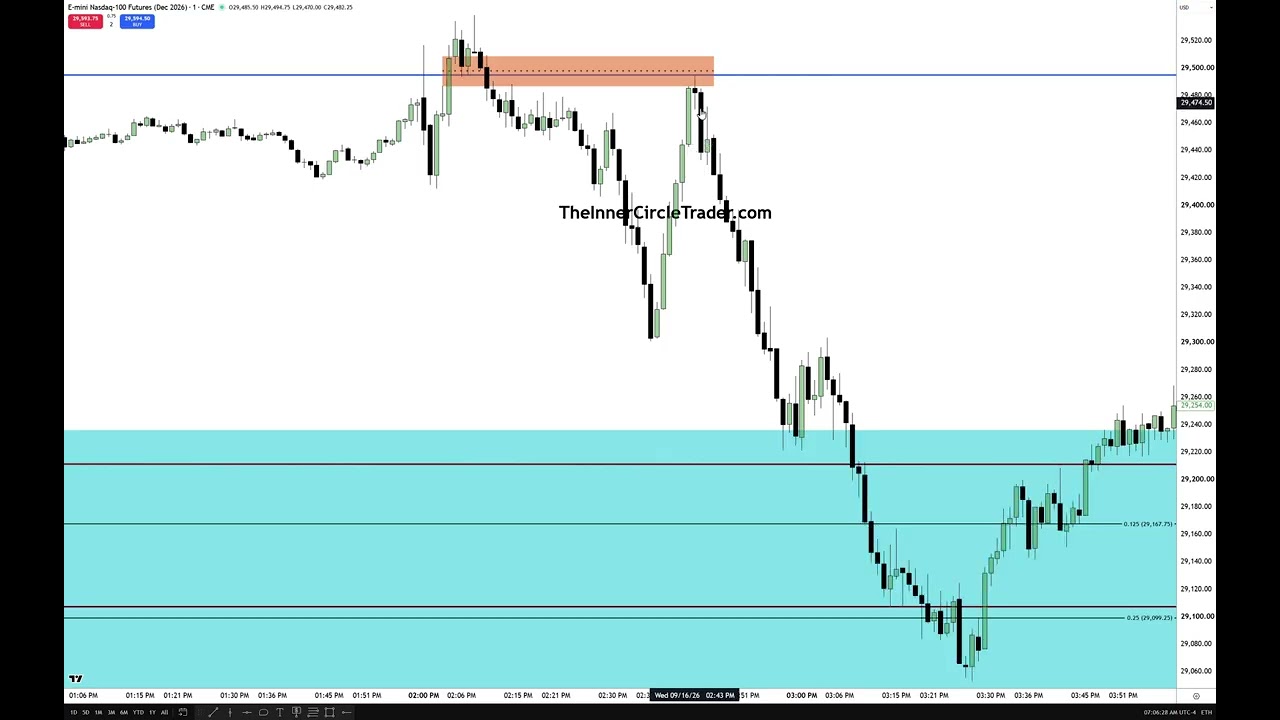
So, we pierced that already at 2:00. It came down and one more time we rallied back above it. And then once it took out this high, we want to go back in and look at any inefficiency that formed prior to that because it's going to act as an inversion fair value gap, my inversion fair value gap. Now, if you look at what we got here on this candlestick's close, we have 47 467 even. The open on the very next candle is 6 466.75.
So, there is no volume imbalance, so you have to use the candlestick wick high. There is definitely a volume imbalance there, you can see between the difference between the bodies. So, this is what you see me draw on the recorded execution that only appears on X. So, you go back and look at my uh my post on X yesterday. Um right now as I'm recording, I learned that if I try to do a screenshot when you do the Windows alt button then tap the R button, you can record your screen as I indicated during the lecture series last week where you can do uh back testing and and recording the data and whatnot.
I I didn't realize that if I did something outside the window I'm recording, it automatically turns it off and I had to close the trade manually outside of the recording, but you know, you'll see it. And and if people get all upset and bent out of shape about that, then I I really don't care. You know, three you know, $33,800, you know, whether you watch it or not, it doesn't change the fact that it happened. So, I could care less.
I I'm I'm getting older, folks, and my ability to deal with the the BS is is is waning. So, I really don't care who believes me. And then we have this here. So, we were just about to take out those highs here. And back into this inversion fair value gap that beautifully traded up into Tuesday's high. Okay? And this little bug thing is in my way, and I can't move that. That's a little bothersome for me. It's a little recording thing.
So, yeah. I'll have to deal with it. Sorry. The fair value gap prior to the running out these relative equal highs and trading into the inversion fair value gap there. You saw me draw this out as well. Volume balance at the low to the wick low. Draw that out. Body respected lower half. Open couldn't even touch consequent encroachment or consequent encroachment that wick. Broke down. They are absolute characteristics of an inversion fair value gap.
And it wilts, goes lower. And what I was looking at was how we had these levels down here. Monday and Tuesday. Monday, Tuesday's daily low, respectively. But we were trading down into that daily suspension block that's shaded in blue. Which was a cause for my concern, and it was the first FOMC conference with the new Fed chair. So, I was expecting a little bit of you know, give and take a little bit more than normally.
So, I was more inclined to take off partials and not reach for Monday's low, which obviously in hindsight, it's easy to say, "Why didn't you do that?" Well, you know, you didn't make $33,800 yesterday. I did. So, looking at the wick here to that low, if we look at this, we drop this from there. Now, watch. what you're looking for is that big gap here that's missing the 50% level. I add that now. And I'm going to anchor Okay, I'm going to anchor this low right here to that 50 level.
Right there. And I'll add the 100 percentiles to the range. You can see how we had already traded below that low. And when it when it broke this, then I can take this logic and add to the same thing to here. This is simply just swing projections. That's all it is. It's not it's not you know, magic or anything like that. But, there is there's the business right there. All right. So, it takes us down to that level there.
Now, when we're looking at it like this, you can see how bringing us down into those levels gets us real close to the low, but not entirely to the actual low. And I was looking at several factors here. These are all things that I was running calculations on with my phone. So, you can see all those uh levels and how that relates to what NQ did. Clearing Tuesday's high, failing to go back above that there with an inversion fair value gap, it sets the stage and tone for the market wanting to reach down into that daily suspension block, which is shaded in blue.
And ultimately took out Monday's low. Now, I was not on board for that portion of the run. I got real close to it, as you'll see here. And no other trades this week. I've been planning for the holidays. And September is, by the way, is um National Preparedness Month. And I've said these things in the past. You better get yourself prepared to some bad stuff's coming. All right. And then we'll look at the uh the information here.
You can see that the fill here on the initial entry was 29,483.7 I'm sorry. 29,483.25. And then this one here, another three contracts at 29,483.75, which is why I seen 75s. I knew my fills on a 0.75 level. And once we cleared that low here, uh I wanted to take some profit right there. You can see right there, little arrow thing pops up there. And again, you can watch the recording of all this. That. And then we finally broke lower.
So, I'm I'm utilizing this um blue shaded area as a daily bullish suspension block. And then we went a little bit lower. So, there's that. Right there. Look right there. Look there. You see that? And then finally closing it manually when it got down to a level that I felt was uh worthy of a close. And I missed that little piece of the move there. And then ultimately it rallied me back up. And then came all the way back up just to take out now Monday's high.
See that? So that was the skinny. That was the things I was looking at. The the reference points that I had on my notepad here. You know, I tell you all the time you have your your notes. Keeping a clean chart is one of the things I like to work with, but uh that's the business. And you'll know I also posted a little period on X to a post I made back in 2022, which I was reminded of by another student because they replied to that by sharing what they did with the market.
Um when you're trading FOMC I believe that at 2:40 to 2:50 p.m. Eastern time that's usually when the sweet spot entry forms and you'll notice that that logic right there on that high that I entered on 2:43 baby. >> [laughter] >> It's probably random. Till I talk to you next time. Be safe.
The words are the caption track's own and nothing is reworded or re-transcribed. Paragraph breaks are placed between sentences so the text reads as prose.
Free tools for your own script: paste a draft and see where it stands before you record it.
Paste your draft and see where viewers are likely to drop off, with a rewrite for each weak line.
Paste the first 30 seconds of your own draft for a hook score and rewrites.
Check your draft against YouTube's advertiser-friendly guidelines before you record it.
Read this channel's public videos and transcripts, and download a writing brief for it.