Getting the transcript
Reading the captions from YouTube. A video nobody has opened here before takes 10 to 30 seconds; this page fills in on its own.
Getting the transcript
Reading the captions from YouTube. A video nobody has opened here before takes 10 to 30 seconds; this page fills in on its own.
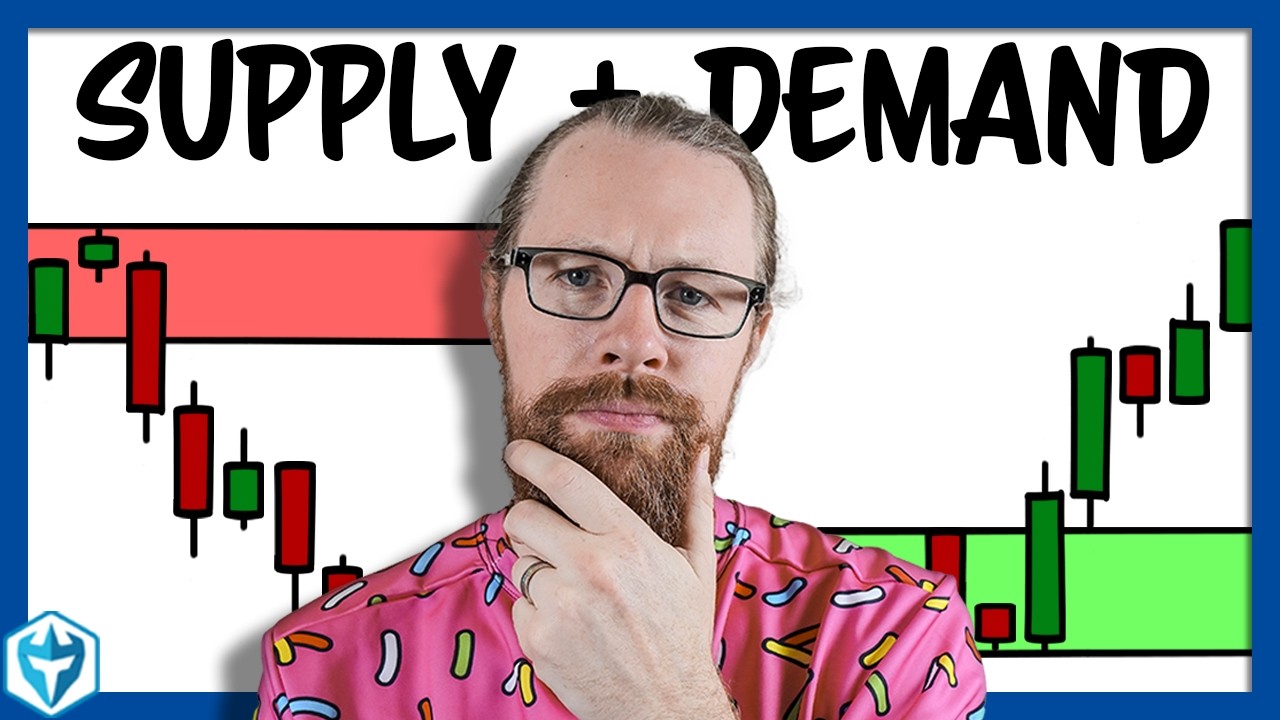
Ross Cameron - Warrior Trading · @DaytradeWarrior
Where viewers went back to watch this video again, from YouTube's public Most replayed graph, lined up with what was said at that moment.
Most replayed moment #1
9:412.5x the video's typical replay level
know, buying and holding and um, you know, being more of an investor. But, but you can day trade with them uh because there's no pattern day trader rule. Now, of course, many of you know that FINRA, the regulator of the US financial markets, has uh just approved an amendment to the pattern day trader
Said at 9:34
Most replayed moment #2
20:132.4x the video's typical replay level
that amount of selling? Absolutely. Very easily. Now, if this was only 1 million shares of volume or 1.4 and it was only one XFL rotation, you know, that additional selling would weigh more heavily on it. So, there's a couple things that kind of need to happen in order for these stocks to make a big
Said at 20:06
Most replayed moment #3
14:152.3x the video's typical replay level
shares. 4.1 billion shares. They've sold a lot of shares. Nvidia, 23 billion shares. And let's look at SGBX right here. SGBX has sold only 4.7 million
Said at 14:10
The graph counts replays. It does not show where viewers stopped watching.
Words
5,597
Runtime
28:29
Speaking pace
197wpm
Reading time
23min
197 words per minute, between the 181 median and the 201 75th percentile of 349 measured videos. That distribution comes from the 349-video hook study.
Opening (first 30 seconds)
Today is day two of my brand new small account challenge of trading in a $2,000 cash account using Weeble as my broker. In today's episode, I'm going to give you a recap of my trades from this morning. I am currently maintaining 100% accuracy on the challenge, which is awesome. All winners, no losers. But I'm also going to teach you something really important. I'm going to teach you my supply and demand trading strategy that I'm currently using right now to grow this account. Now, you may know as a day trader, I don't profit by buying
99 words, the words spoken in the first 30 seconds at 197 words per minute.
Free, no signup. See how the first 30 seconds hold attention, with rewrites.
Sentence shape
| Measure | This transcript |
|---|---|
| Sentences | 357 |
| Average words per sentence | 15.7 |
| Longest sentence | 69 words |
| Questions asked | 24 |
| Sentences containing a number | 89 |
Most used terms
Filler phrases
81 in total: like 19 · you know 17 · uh 14 · kind of 7 · um 7 · actually 6 · right? 5 · I mean 3 · sort of 2 · basically 1.
A literal whole-word count of the same phrase list the Prepublish browser extension uses, so a phrase inside another word is not counted and a phrase used in its ordinary sense still is. It is a count and not a judgement.
Free, no account. See where attention is likely to drop, with a rewrite for each weak line. The free check shows the scores and the one issue costing the most. Or run it on the words above first.
Free · No login · See a sample audit first if you prefer.
What this transcript is
Every word below is the caption track YouTube publishes for this video, pulled from the video itself and reproduced unchanged. It is not Prepublish's writing, not a summary, and not a re-transcription: it is the video's own published captions. English captions, generated automatically by YouTube, in the video’s original language. Source: the video on YouTube. A channel that would rather this page did not exist can ask for its removal through the contact page, and it is removed.
Today is day two of my brand new small account challenge of trading in a $2,000 cash account using Weeble as my broker. In today's episode, I'm going to give you a recap of my trades from this morning. I am currently maintaining 100% accuracy on the challenge, which is awesome. All winners, no losers. But I'm also going to teach you something really important. I'm going to teach you my supply and demand trading strategy that I'm currently using right now to grow this account.
Now, you may know as a day trader, I don't profit by buying a stock at five and selling it at five. I make money by buying a stock at five and selling it at 550. That means a stock needs to go up 10%. What allows a stock to go up 10% ultimately is an imbalance between the supply and the demand that is typically generated by the stock having breaking news. But we're going to dive a little bit deeper into it here today and I'm going to share with you some tips and tricks that I think will help you build your daily watch list and hopefully get yourself focused on the right stocks to trade on any given morning.
Okay, so let's go ahead and jump on the screen share. We've got a lot to cover today and I want to start high level by giving you an update on our fundraising challenge. Remember all of the profit from these small account challenges that I'm doing is getting donated to charity and I'm giving you guys the opportunity to help me double that donation with a dollar for-dollar match. So, every time you guys hit the thumbs up or subscribe to the channel on these episodes, it adds an extra dollar to the donation.
So, as of today, we are over $163,000 raised, which is phenomenal. I've already written checks for $145,000, which means I've got about $18,000 that's ready to go out the door. I appreciate you guys giving me recommendations of charitable organizations you'd like to see me donate to. And thank you guys for hitting the thumbs up and helping grow the amount of money that we've raised for charity. All of this is for a good cause.
We're learning to trade together. I hope many of you guys are learning here and we're raising money for these um foundations and organizations. So, this is really exciting. I'm thrilled to do it and thank you guys for uh being part of this uh small account challenge. Okay, so today is day two and my account currently is up 40%. Not on the day, but in total 40% since day one. In total dollars, I'm up $89.19, which gives me a total new account value as of the end of today of $2,89.19.
You'll see that the one stock I traded is right here, PBM, and I'm up $49.77. Yikes. Well, that doesn't seem so great compared to my gain yesterday. You're right. That's a great observation. Yesterday was a fantastic day. Today, well, it was a little bit slower. And I'm going to talk about that a little bit. One of the things that I think is important to mention is that trading is a marathon. It's not a sprint. Days like today in the moment don't feel super thrilling.
They don't feel super exciting. But this is the reality of growing a small account. It's showing up every single day and just chipping away. So, this is going to add a little bit more buying power to my account for tomorrow, which is good. And each of these days that I show up and get small gains certainly is better than losing. And if I show up every single day and I keep focusing on the right stocks to trade, the stocks that show the greatest likelihood of a big supply and demand imbalance, I'm going to get a couple more of those big winners like I had yesterday.
And that those are the days where the account's really going to grow a little bit faster. Now, I did get a bit hung up this morning um because the stock that I traded ultimately, as you can see on this chart, didn't make a really big move. Now, how did I find this stock? I basically the process of finding the stock was the same as how I found yesterday's big winner. I used my scanners. So, this software that you can see on the screen share, these are the scanners I'm using.
And PBM was right here on this scanner, which is called Ross' Five Pillars Scan. So, it's searching for stocks that meet all five pillars of stock selection. Many of you guys have watched, I'm sure, a number of my episodes here to understand these five pillars. So, just to jot them down quickly, number one is price, number two is rate of change today, number three is relative volume, number four is news, and number five is float.
So, we like the price to be between two and 20. We like the stock to already be up at least 10%. We like at least five times relative volume. It should have news. and the float should be under 20 million shares. So, this stock met all five of these pillars or criteria for stock selection, which means it did have a high likelihood of experiencing a fairly large imbalance between supply and demand. However, it didn't end up making as big of a move as I hoped.
So, in this case, what was kind of interesting was if we look at the top gainers scanner right here, this is looking at the top gainers in the entire market this morning. And we had a stock MNDR that was up 80%. And as you can see, it had 16 million shares of volume and a float of well 93,000 shares. So it's a very low float stock. It was squeezing up with news. And in fact, it had already gone up nearly 200% this morning, but it had made that big move up and then it had pulled back quite a bit.
So when I looked at PBM, I thought to myself, this one actually looks very similar to MNDR. And sometimes what happens is that when you have one stock that makes a big move, traders are looking for the next one. And when the next one pops up, if it looks similar, it gets better followthrough and better price action. That ended up not being the case. So, as this first popped up right here, it was on my scanners. I evaluated it for the five pillars and now I'm watching it.
It pops up right here. And on this dip, I took my entry. And what I was looking for was a squeeze through the high a day. We call this a pullback entry. So, it popped up. It pulled back for a moment and I got in right there. My max loss was the low of this candle right down here. So that was my risk and my reward potential was, you know, roughly 2x that risk. But what ended up happening is it was unable to break through the previous high of day.
So what ended up happening is that was resistance. There was a big seller up there and so we had a wall and we couldn't break through it. And now this is where I had a choice to make. On the one hand, my gut instinct was to bail out. I was like, sell. This is obviously not working. It didn't break through resistance. But I hesitated on that gut instinct. Why did I hesitate? Because I knew this was my one trade that I would be able to take today because this is a cash account.
So with a cash account, once I've used all my buying power, I can't take any more trades till the next day. And on this trade right here, well, I use my hotkey to use all of my buying power on that one position. So, with $2,700, how many shares could I afford? About 700 shares. Now, I got into it kind of quickly. And and this is another challenge with a cash account. There's this feeling of FOMO. I don't want to miss the opportunity because if I miss it, that might be my one good chance for the entire day.
So, I don't want to miss the opportunity. It's not like a margin account where if I miss the first trade, I could just take five or six more trades later. even if they're smaller, I could just take smaller trades later and still do well. With a cash account, I've got one shot and I want to make it count. So, I kind of jumped in a little impulsively right here very quickly, thinking this had more potential than it did.
I didn't fully calculate the max position size for me was going to be only 700 shares. And so, the reality is the goal for this account was to try to grow the account by 10% each day. So, with $2,700 in the account, I needed to grow the account by 270 bucks today to stay on track. Doing that with 700 shares, so 7* 4 is 28, 280 bucks. I would need to get almost 40 cents a share. That's that's kind of setting the bar pretty high.
Well, it it is setting the bar pretty high. In fact, if we looked at my metrics, and we'll get into this um in a few minutes, but if we looked at my metrics here and I compare all of my winners and all of my losers, what you would notice is that even I mean, even for me, I I've done extremely well trading. We'll just look at year-to- date. So, all the winners and all the losers year to date. I want you to speculate knowing right now that I'm up about $6 million on the year.
How big do you think my average winners are? You might think they're huge. In fact, they're only about 18 cents a share. For me, this is about the marathon of trading, showing up every single day and just chipping away on those winners. 18 cents, 18 cents. You do that with 10,000 shares, it's 1,800 bucks. You know, you do that a,000 times, boom, you've got 1.8 million. Not factoring in the losers, but you get the idea.
So, for me, my success has been built on consistency in relatively small base hit winners. But that's difficult with a small account because with a small account, small base hit winners of $49 might feel like they don't move the needle. But as I said, showing up every single day is important because there will be days like today that are small, but then there will be days where I get it and boom, next thing you know, the account's up 37% like it was yesterday.
So, I jumped in and I jumped out. I did hesitate a little bit to sell and I ended up selling as it started to come back down again. This is the interesting thing where a cash account is sort of designed to protect you because you don't have any margin. So, you can't take any big big risk. But then the unintended consequence of this type of account is the way it affects your mindset, especially if you're trying to day trade in it, which ultimately these accounts weren't designed for day trading.
They were designed for, you know, buying and holding and um, you know, being more of an investor. But, but you can day trade with them uh because there's no pattern day trader rule. Now, of course, many of you know that FINRA, the regulator of the US financial markets, has uh just approved an amendment to the pattern day trader rule to reduce it from what is currently $25,000 minimum account size to just $2,000, which is why, of course, I funded this account with $2,000.
So, what I know is that whatever I do for performance during this challenge, I would be able to exceed that once the SEC and hopefully they do uh approve this uh rule change or this amendment to the rule relatively soon once that goes into effect. Okay, so this is where I sit here for day two. A relatively small winner. And where that puts me on uh in terms of account growth uh total started with $2,000. Today's profit, not a lot.
New balance is 20 uh $2,800. Accounts up about 40%. I've taken two trades with 100% accuracy. There we go. Average winner is $44 thanks mostly to yesterday's big win. Okay, so that's where we sit here as as of the end of day one or day two. Uh, and let's now talk about the supply and demand trading strategies. So to accompany this class I'm going to teach you today, I want to give you guys a link to download my small account worksheet and my small account trading plan.
This is essentially the business plan that dictates the way I approach growing a small account. So, if you're thinking about growing a small account or you currently have a small account, you haven't already downloaded this worksheet and my trading plan, I'm going to put a link. It'll be pinned at the top of the comments and in the description where you can download it today. You can download it, print it out, utilize it in your own trading, and I think you're going to get a lot of value out of it.
So, when we're talking about supply and demand, in order for a stock to go up 100% or more, there needs to be a significant imbalance between supply and demand. And that's created by a surge in demand, which is typically the result of, you guessed it, breaking news. Okay, so on the one hand, one way to create our watch list each day would be to search for all of the stocks in the entire market that have breaking news.
Well, that's going to be a problem. You've probably noticed there's breaking news if you look at the news headlines that's coming out all day long on uh thousands of stocks and different commodities and different financial instruments. So, it would be impossible to try to keep up with the news feed. So, searching for every single news headline is not the way that you're going to find these stocks to trade. And that's confusing because aren't we focusing on breaking news?
How would you find breaking news if not for reading the news? There is another way. So, here's how I approach it and this is the way I look at it. We're going to take a peek at my metrics again and I'm going to show you something. This is what I'm sharing with you here today. You could extrapolate if you just spent enough time looking at my metrics the strategy that I'm trading and I'm going to walk you through it. So, this is all of the data that essentially backs up my position here that in order to make a lot of money trading, especially as a retail trader, you need to focus on stocks that are experiencing an imbalance between supply and demand.
So, we're going to go over to my metrics here under the detailed column. This is actually 10 years of trading data that's all in here. So, sometimes this takes a minute to load because it's pulling up so much data, but we're just going to start high level and I'm going to go into this um ta data table of price and volume. So, what you'll see here is that my performance by price shows that I tend to make the most money in this price range here, which is on stocks between $2 and $20.
So, when I say that of the five pillars of stock selection, pillar number one is price between two and 20. It's not just my opinion that I think that that's a good idea and we should just go with that. It's actually based on all of my trading data. So, what I know is that stocks that are between two and 20 tend to have a higher likelihood of exhibiting large imbalances between supply and demand. Why would that be? Well, there's some other things that are often common about these lowerric stocks. lower price stocks typically they're typically uh shares that are traded of smaller companies and these companies typically have smaller numbers of shares that they've sold onto the open market.
You know you look at a big company like Amazon or Netflix and these companies have sold hundreds of millions of shares onto the open market. So Netflix has a float of 4.1 billion shares. 4.1 billion shares. They've sold a lot of shares. Nvidia, 23 billion shares. And let's look at SGBX right here. SGBX has sold only 4.7 million shares. And this is actually a really good example here. So SGBX, as we look at it right now, this stock is up, let's see, what's the percentage change?
Let's just make this a little bit bigger. So SGBX currently sitting on the day up about 44%. It's got 34 million shares of volume and the float is 4.7 million shares. We got to jump onto the whiteboard here. So, I'm going to kind of break this down in a different way for you. So, we've got volume. And so, in this case, the volume on the stock is 34 million shares. It's 34 million shares. And then we're going to talk about the float.
The float, the number of shares available to trade is 4 million shares. And the percentage change today is currently plus 44%. Now, because there's 4 million shares that are outstanding in the float on this company, what we know is that there's 4 million shares today that are up 44%. Those are shares that yesterday were worth that much less. So, in theory, you could have people out there, and you likely will, who are going to sit down and are going to see, whoa, my shares are up 44% today, I should probably take some of this profit off the table.
This is unbelievable. This is a huge day. This doesn't happen all the time, right? So, since there's 4.4 4 million shares that are outstanding in total approximately. If let's say the volume today was only 1 million shares, then if all of these people wanted to sell, well certainly some of them would sell. And with 1 million shares, there's not enough volume to absorb all of their selling. And so in fact, you wouldn't see a 44% gain because there's not enough volume, which is also demand to generate that move.
So in order for a stock to move up, you need to be able to have enough volume that as it goes up 10%, 15%, 20%. It's able to absorb all of the people who want to sell, who have profit. So this comes into the concept of float rotation. Oh, we'll keep this here because we're going to need that probably for later. So, I'm just going to write down here. So, float rotation and float rotation is an indic is indicative of a high level of imbalance between supply and demand.
Float rotation is the ratio of the number of times the float has turned over based on the volume. So when this has 40 million shares of volume, which is only a matter of time before we hit that level, it'll have a float ratio, float rotation ratio of 10x. So that means that all of these people who are holding, all of those shares from yesterday that are now up, you know, currently 40 50%, let's just round up to 50%. All of them, every single one of them could have sold because there's enough demand to support all of them selling.
And yet the stock is continuing higher. And so what I've noticed is that stocks that have a high float rotation ratio are often the stocks that make the biggest percentage moves. Because sometimes you would argue, well, let's just say this had a float of, you know, 400 million shares. If there are 400 million shares out there that are up 50% today, you know that there would be people that want to sell. How many want to sell?
Not every single share. Look, there's going to be people that own shares that are not going to be selling. They could be insiders. They could be own have stock benefits, things like that. So, and there could be institutional investors that are own that own the stock and are not planning on selling. But let's just say, let's even be conservative that on a stock like this that's up 50% that only 25% of the people want to sell.
That would still be a 100 million shares of volume. So, if you had a 100 million shares seller that came in, it would wipe out the stock, right? And this is because the supply, this is supply, float is supply. The supply in this case is too large. So in order for a stock to make a big move, there needs to be an imbalance here between supply and demand. And these are the two things we're looking at. So this is demand.
This is supply. So each morning when I sit down, especially if it's early in the morning, what am I looking at? I'm looking at stocks that may not have a lot of volume yet. I'm looking at stocks that may not have a big percentage change yet because those are sort of unknown. But what I can determine is the float. That's the number of shares the public that the company has sold onto the open market. So that represents a level of supply.
So if I see a stock that has like PBM, so a 1.4 I think it was 1.4 million share float. I see a stock that has a 1.4 4 million share float and then I also notice that it has breaking news and maybe it is up 10 or 15%. Right? And may and the price is within the price range where I do the best then I can make a prediction that this is the type of stock that could most likely experience a big imbalance between supply and demand.
In fact, even if this had a float rotation of well, I mean, if this had 10x a float rotation, then we would have um 14 million shares of volume. It would only take 14 million shares of volume for us to get 10x. So, if we had 7 million shares of volume, even just 7 million shares of volume, we would still have 5x float rotation. Now, if we figured 25% of these people that have been owning this are probably going to want to take profit, you know, 25% we're talking about three 300,000 shares.
So, can this absorb that that that amount of selling? Absolutely. Very easily. Now, if this was only 1 million shares of volume or 1.4 and it was only one XFL rotation, you know, that additional selling would weigh more heavily on it. So, there's a couple things that kind of need to happen in order for these stocks to make a big move. Yes, they need to have news, but if a stock has news and the supply is already 400 million shares, that news typically falls on deaf ears.
People don't really pay much attention to it because the float is so high, no one really expects the stock to make a big move. You would need to have an unthinkable an unthinkably good catalyst for that stock to make a big move. I mean, even Nvidia, Nvidia today had earnings and you know, currently the stock is actually selling off. And this is a perfect example. In fact, why is the stock selling off? Because there's enough people out there that were holding before the earnings came out and they're taking profit today.
They're selling. And there's just not enough buying to accumulate all of that selling and keep it going higher. Why is that? Maybe because Nvidia is near its all-time highs and there just only so many people who are confident buying it. you know, only 10% off the highs. It's extended and, you know, there's a lot of speculation that's gonna continue going higher, but they can only continue to beat quarterly earnings so many times in a row before they miss.
So, it's at a position right now where just structurally there are more people selling today than there are buying and that's what's created this red candle. Now, of course, it's got 23 billion share float and the amount of volume today on it right now is about 82 million shares. So clearly there's not even close to enough volume to absorb if a large percentage of the float decide to take profit. And this as a side note is one of the reasons that people worry about potential bubbles because when you have a company that is valued this high with such a huge float with such such a low ratio of daily volume to that float.
If suddenly there's some insiders who say I want to dump a billion shares on the market, it's going to take them a week to get out based on the average daily volume. And that's just one person. That person would be 5% of the float. But if there's a 5% stakeholder who wants to cash out, what if all of a sudden panic sets in and there's a few more that want to sell? You've got 15 um 15%. All that's where things start to get scary and you're going to have a really hard sell-off.
Now, with a small cap market and SGBX is continuing higher here, which is great to see. So now we're at four uh still 4.7 million share float but we're up here now let's see percentage change is now 51% and the float is now crossed over 40 million or the volume is now 40 million shares. So, initially it was a news headline at 7:30 that kind of got this thing going and now it's just grinding higher. And I think the the bullish case on this is that you've got so much volume.
It supports that anyone who wanted to take profit could have easily sold and yet it's continuing to go higher. So that tells us who's in control. It is the buyers. The bulls are in control. When the sellers are in control, we have stocks that pop up and then just sell off all day long. And that's a problem. We don't like to see that happen. Now, there's not to make things more complicated, but there's another variable that we have to talk about.
So, we need these stocks to have high relative volume. Relative is what's average for this company. So if a stock on average trades with a million shares of volume and then today trades on 10 million shares of volume, the relative volume is at a ratio of 10x, which is good. That's what we like to see. So let me just jump over here and show you my metrics here in terms of relative volume. So we're going to go to instrument.
This is going to load for a second. And now we're going to look at the performance by today's volume relative to the 50-day average volume. And you can see right here, I make the most money when today's volume is 500% higher than the 50-day average. So, this speaks to something happening today that is significant. And that significant thing that's happening today is we've got a company that's got breaking news. Traders have started to jump on it.
And very quickly, any sellers that existed on this were overwhelmed. Right? There were sellers. No doubt there'll be sellers on any stock that pops up, but the sellers on this were overwhelmed very quickly because the float was so small to begin with. Now, if we had started with a 30 or 40 million share float, then it would have been less likely that we would have seen this big imbalance, right? Because we would have already been coming from a starting point that was just too high.
But coming from this lower starting point with a 1.4 million share float, it initially didn't take a lot of volume for us to immediately have a float rotation of one. Then next thing you know it's a float rotation at two and that's five, six, seven, eight. And now things are really starting to crank higher. So generally speaking the stocks each day that make the biggest move will have floats of under 20 million shares and under 10 and lower is only going to amplify the imbalance between supply and demand.
So float is a critical component. Now the the PR the headline is is important as well. It's a chicken or the egg. Now, this is, and again, I I don't want to get into analyzing that too deeply, but you So, you could have the headline, but if you don't have the right float, it doesn't matter. You could have the float, but if you don't have the headline, well, it doesn't matter either in that case because there's no reason to buy it.
So, yes, I suppose it's the float that comes first, and then it's the headline that adds on to that. And then, you know what happens is there's high frequency trading algorithms that execute. the second a stock has news that has a float of less than x and is up more than x in the last certain number of uh days because that's what triggers that algo buying. So those algorithms that initiate those buy orders are what first send the stock up 15 20 30%.
Now traders like myself see the stock hitting our scanner. We see that it's up, it has a news headline, the price is right, and the relative volume's picking up. Maybe it's also a hot sector, crypto, biotech, AI, and it's a time of day where we most likely or where we're most likely to see these big moves. That's when we strike. And so for me, I don't sit here reading the news all day long. I sit here watching my scanners because my scanners will show me something that's moving.
It needs to be moving. And then I identify, does this have a news catalyst behind it? What is the float? What is the current volume? And does this stock have a high likelihood of continuing to exhibit this imbalance? So the result of an imbalance is a rapid change in price. So when you have a big imbalance, whether it's to the sell side or the buy side, the price changes quickly. So my daily watch list each morning is the stocks that have the greatest likelihood for having a large imbalance.
And so I actually have a scanner. It's my lowflat scanner right here. And this is a scanner just of lower float stocks. and I search it by the leading percentage gainer. And then I can see this one is starting to move up. We've got the green arrows. And so I can check it and see what's the catalyst, does it have enough volume, what's the daily chart? And if it does, then I'm happy to jump in. And so this is how I'm building my watch list each day.
It's not by scanning for all the news headlines. It's by looking for the stocks that have the lowest level of supply initially that are starting to creep higher. This is the small account growth strategy. And again, those of you guys that want to download the PDF resources, you can download them, you can print them out, you can utilize them in your own trading, and if you want to take the leap and do a two-eek trial here at Warrior Trading During the rest of this challenge and anytime you guys are watching this in the future, you could do this twoe trial.
You can watch over my shoulder. You can use the same scanners, the same charting tools that I'm using every single day, and you can get a sense of what it's like to be immersed in a community of active traders. So, I want to thank you guys as always for watching today's episode. I'm going to put a link to another one I think you'll enjoy right up here. And I want to remind you that trading is risky. My results aren't typical, and there's no guarantee you'll find success whether you trade on your own or you learn with me.
So, please take it slow and always practice in a simulator before putting real money on the line. I will see you for day three coming tomorrow.
The words are the caption track's own and nothing is reworded or re-transcribed. Paragraph breaks are placed between sentences so the text reads as prose.
Free tools for your own script: paste a draft and see where it stands before you record it.
Paste your draft and see where viewers are likely to drop off, with a rewrite for each weak line.
Paste the first 30 seconds of your own draft for a hook score and rewrites.
Check your draft against YouTube's advertiser-friendly guidelines before you record it.
Read this channel's public videos and transcripts, and download a writing brief for it.