Getting the transcript
Reading the captions from YouTube. A video nobody has opened here before takes 10 to 30 seconds; this page fills in on its own.
Getting the transcript
Reading the captions from YouTube. A video nobody has opened here before takes 10 to 30 seconds; this page fills in on its own.
The Inner Circle Trader · @InnerCircleTrader
This video has no Most replayed graph yet: YouTube shows one only once a video has enough views. These are the moments viewers replayed most in The Inner Circle Trader's most watched videos.
Most replayed moment at 51:50
3.7x that video's typical replay level
Okay? So, now we have two points of reference. Now, when I have this like that, I have two little sweet spots in the previous day's range and to the left of that, why? Cuz we're going to go back 3 days.
Said at 51:44
Most replayed moment at 12:06
4.1x that video's typical replay level
So we have relative equal highs during lunch macro, 11:30 Eastern time to 1:30 p.m. Eastern time. The setup usually forms in the first hour of that 2-hour lunch period. Okay? So between 12:30 noon
Said at 11:59
Most replayed moment at 10:06
3.2x that video's typical replay level
towards that of this buy side imbalance or side inefficiency, which is a suspension block, which has a volume imbalance on the high end and a volume imbalance on the low end. All right, so let's move into the lower time frames now. So, we're at a 1-minute chart.
Said at 9:58
The graph counts replays. It does not show where viewers stopped watching.
Words
15,048
Runtime
1:59:25
Speaking pace
126wpm
Reading time
63min
126 words per minute, below the 160 25th percentile of 349 measured videos. That distribution comes from the 349-video hook study.
Opening (first 30 seconds)
Good morning, Caleb. How are you? >> So, we're looking at a new month that begins tomorrow. Today is August 31st, 2026. And kind of like walk you through a new week, a new month. Uh we're entering the seasonal tendency months where market price delivery gets a whole lot better. It gets very clean. Um it's just a lot of economic drivers
63 words, the words spoken in the first 30 seconds at 126 words per minute.
Free, no signup. See how the first 30 seconds hold attention, with rewrites.
Sentence shape
| Measure | This transcript |
|---|---|
| Sentences | 1,064 |
| Average words per sentence | 14.1 |
| Longest sentence | 108 words |
| Questions asked | 64 |
| Sentences containing a number | 73 |
Most used terms
Filler phrases
264 in total: like 119 · uh 47 · um 34 · you know 31 · kind of 15 · basically 6 · actually 4 · right? 4 · I mean 3 · literally 1.
A literal whole-word count of the same phrase list the Prepublish browser extension uses, so a phrase inside another word is not counted and a phrase used in its ordinary sense still is. It is a count and not a judgement.
Run the check on the words above: where attention is likely to drop, with a rewrite for each weak line. The free check shows the scores and the one issue costing the most.
What this transcript is
Every word below is the caption track YouTube publishes for this video, pulled from the video itself and reproduced unchanged. It is not Prepublish's writing, not a summary, and not a re-transcription: it is the video's own published captions. English captions, generated automatically by YouTube, in the video’s original language. Source: the video on YouTube. A channel that would rather this page did not exist can ask for its removal through the contact page, and it is removed.
Good morning, Caleb. How are you? >> So, we're looking at a new month that begins tomorrow. Today is August 31st, 2026. And kind of like walk you through a new week, a new month. Uh we're entering the seasonal tendency months where market price delivery gets a whole lot better. It gets very clean. Um it's just a lot of economic drivers come into the marketplace because of the holidays, end of year spending. So it's going to be uh in my opinion a whole lot better in terms of price action.
But we want to take a look at the economic calendar and what I have up here is Forex Factories economic calendar. I've zoomed in as much as I could that way everything could be shown. More specifically to block all the advertisements because I don't do advertisings for companies on other people's websites. So I have every filter turned on right now. Okay. So, one of the most important things I like to do since I'm not actively trading forex right now, but if you are trading forex, any pair that would be germanine to whatever pair you're trading or currency you're trading, you would have that toggled.
So, since I'm not concerned about that at the moment, forex will be back on the menu soon, but as it is right now, it's not. So, we won't be doing anything with that. But we do want to toggle the US dollar. And then over here, I'm not so concerned about the gray box area or the yellow, but I'm going to keep it on today because I want you to see and your your brother Caden, I want him to see the difference between the important medium impact and high impact.
So these right here, they're low impact. It doesn't mean that you can't have fluctuations in price action around them. I'm not concerned about them. And the gray usually is just for like speeches, things of that nature. So, you want to know a little bit about some of that stuff. And all these things here, we'll just keep that in play. And we apply it and it condenses the the list of things that was larger. Now it's smaller.
Okay. So, we took out all the foreign currency related things. So as you can see we have G20 meetings. It's low impact but still it has an impact. The the absence of anything significant for either high impact or medium impact and again you would recognize them with the little folders in this column. So where it says impact straight down there. So, generally what I like to do is on a weekend, and we're doing it this week because I already told everybody I wasn't taking any trades this week.
They think I'm lying. [laughter] Whenever I say sincerely, it means I'm sincere about what I'm saying. I'm not joshing anybody. I'm not trying to be sarcastic. But we have a light economic calendar on today. And then we have for the first day of September, we have ISM manufacturing PMI at 10:00 a.m. we have the Jolts jobs opening medium impact. So at 10:00 tomorrow, there's a lot of interest around the data that comes out at that moment.
So Monday is pure price action because it's non-farm payroll Friday, which I'll show you in a moment. Every Monday of non-farm payroll is a day that you should be drilled in and trying to find a setup. Any other Monday, it's pot luck, meaning that it could give you a good day, but sometimes it won't. Just means that you have to know what you're doing with experience. New traders, I try to tell the new trader, don't be so demanding to get into, I guess, a setup every Monday.
And because the importance of patience and building a a disciplinary approach to engaging the market is crucial in the beginning because whatever you start doing in the beginning tends to stay with you. And if you're toxic about what you're doing and how you think and and the reactions of trying to do something you don't know or rushing to try to, you know, take trades or try to assume you're correct. And if you're not correct in the beginning, which is natural, it's normal because you don't know exactly what you're doing yet.
Uh it can weigh on you mentally and psychologically and it's very easy to talk yourself out of doing this at all. So when we're looking at the economic calendar, we are seeing where the big waves of interference with normal price delivery occur. And that's going to be determined by the orange and red folder events. And note the time that they form and on what day they form. So, as I mentioned, we'll just breeze right through it real quick.
On Tuesday, the big hitters 10:00 ISM manufacturing PMI and Jolts job opening. On Wednesday, we have at 8:15 non-farm payroll employment change. Thursday is a day where new traders should not be engaging price action, but they should be studying it. Uh at 8:30 we have unemployment claims and then ISM PMI at 10:00 a.m. And then finally, Friday right here we have average hourly earnings, non-farm payroll change, and employment rate.
This is where the market gets wonky at 8:30. It usually does all kinds of crazy stuff and it's all using uh moving on fake data because for years now our government has been putting out fake data and it's unreliable. So I don't care about what the data is. I don't care about the the actual numbers. I don't care about the change in the numbers because they're always going to revise them later on and this it just proves that data is false.
I don't know why people can't recognize that in trading. Nobody really spends too much time talking about that, but they just know that that report at 8:30, usually the first Friday of every month, non-farm payroll, creates volatility. And that volatility is like a flame. And every little moth flies closer and closer closer to that flame and they get burned. I teach my students, whether they're brand new or they don't have a lot of experience to avoid trading on Thursdays and Fridays of non-farm payroll week up to 11:00 in the morning, Wednesday.
That's like your safe spot for finding setups that are not meant to cannibalize you as much as Thursday and Friday of non-farm payroll. So, if you're brand new, you're generally going to be challenged on Thursday and Friday of that week every month. If you focus your attention on Mondays for certain because everybody's going to want to try to say save themselves the trouble of traveling through dangerous waters on Thursday and Friday.
So, they're going to try to get their pound of flesh, their profit, their little piece of uh the cake as soon as they can right out the gate on Monday. So, that's always a given. And I teach this all the time. And somehow over the years, people have said, you know, Michael or ICT says never trade on Mondays. And that's not true. That's not true at all. So, what I just said is the actual definition of why I say what I say about Mondays.
Every nonfarm payroll Friday is an absolute guarantee that you should be in your seat trying to find a setup because it's going to be there. Every other Monday is hit or miss based on your experience. Now, my experienced students and myself obviously I can sit down and find a setup every single Monday, but I want to be practical as an educator and not say that you should be able to find setups in a Monday that's not related to the week of non-farm payroll.
So I include that here just for the sake of people that hear nonsense on the internet now they've been schooled in regards to that. So we have basically a light calendar today. So we have to rely entirely on price action which is fine. Tomorrow um we'll have a 10:00 news driver. So that means usually you want to wait for the first 30 minutes of trading and let let whatever sets up in terms of liquidity or inefficiency prior to that 10:00 news.
Let the news hit and then work with what's in the wake of that on Wednesday. You know, you want to be done by 11:00. Let's just say it that way. And then the rest of the week, we already said it's a is a no touch for for a new student. Like for instance, if say Kaden was prepared to uh start engaging price action with a demo account, which is technically not yet, he should not be trying to do it on Thursday and Friday this week.
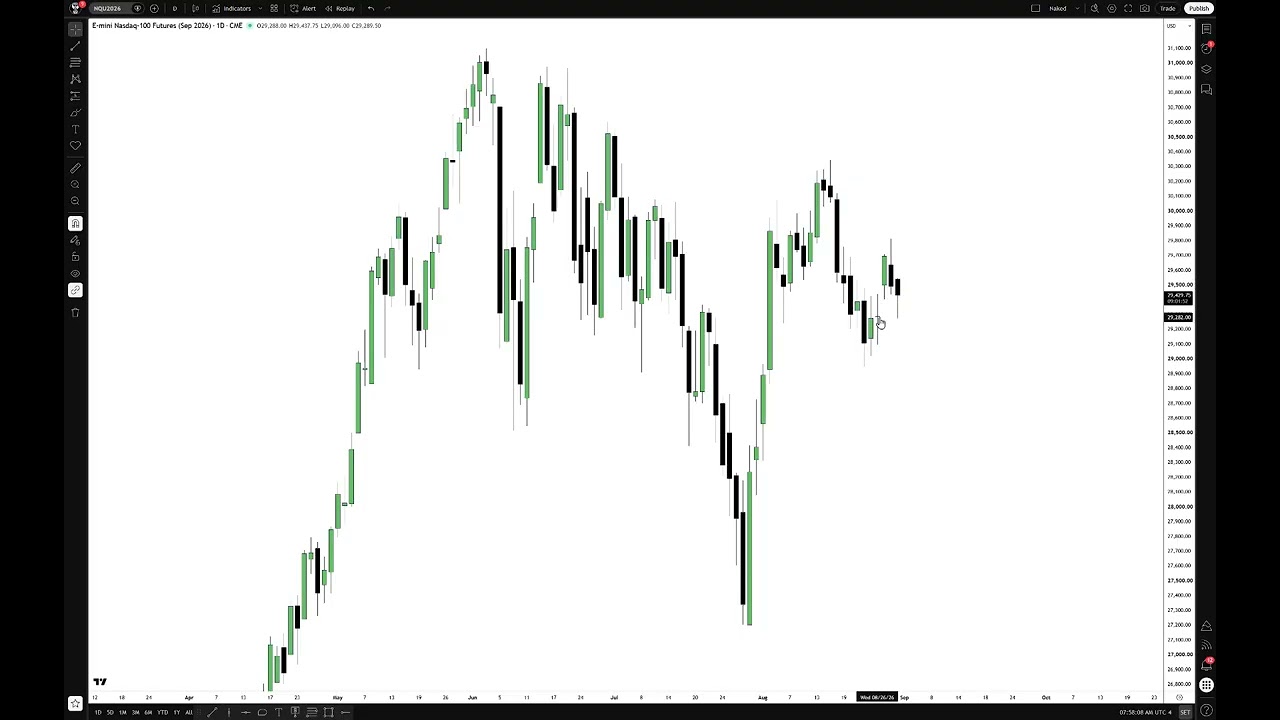
Does that make sense? >> Yes. >> All right. So, with that, let's go over to the chart now. Give me a second. Let me transition over to that. You should see the uh NASDAQ daily chart. All right. So, what we have here is the highest high and the lowest low of each daily range for September delivery contract of the E- mini NASDAQ. Okay, as you can see up here, not that it matters, but the market is open and we're not trying to do anything over live price action.
We're just kind of like getting a feel for what we should be doing on a week-by-eek basis. This is technically something you should be doing on a Saturday evening um or a Sunday afternoon before the market opens up. It only takes a little bit of time. I'm taking more time talking about explaining why it's important, why it's salient, what what the benefit is of it is. That's kind of like what this message is going to be about.
So, it kind of like gives you a primer for how to prepare for the week to come. So, we already have the benefit of having some trading happening today. So, if you were disregarding this candle, we would have been left with just Friday's candle, Thursday, Wednesday, Tuesday, and Monday. All right? So, let's go through a bit of business here. Um, let's go to a a monthly chart real quick. All right. So, what you want to do is you want to note the previous month's high.
And this is that right here is July. That's the high low and where we stop trading and you want to label that. So you double tap on it. Your details for changing things and settings will pop up. You go to text You want to put in here that you're looking at the what am I on? Let me check which one I was doing. Let's start with the top one first. July monthly high. And you want that to be in the middle, right? Justified.
So it'll be over here. And things like this very, very high time frame, you want them to be bold and black. And here you're going to do the same thing. middle right justified in the same bit of business here. And you see it doesn't take very long to do this, but having these annotated on your chart and making sure that they show on all time frames. Okay? And you want them to show on every minute. And if you're going to trade sub one minute, then make sure that the second tab is is toggled too.
Uh the hourly, daily for sure, and weekly. Okay. So we have all the the levels highlighted here. So that way on every time frame, no matter what time frame we drop down, these larger term macro big picture levels are visible to us. And then you know obviously today the likelihood of us taking out the higher low of August you know it's it's not likely to happen today. We'll do the same thing here. Benefit of this now you can hover over July like that.
Don't go to the end of it but like right in here when it highlights and that little thing pops up at the end showing that it's it's active. You're highlighting the right one. Hold down control and then press your mouse button down and drag away and it's easier to just do it not explain it. Now this bit of business we're going to do simply this. We're going to change the July by double tapping it to August separated. Done.
Now, we can't do the close yet because that won't happen until we close today at 5 or at Yeah. 5:59 p.m. Eastern time. So, we have the low thing here. We'll drag that up. Nope. Can't do that one. I had two of them highlighted at the same time. We'll drag that right there. And then we'll double tap monthly low. Okay. So, you're probably saying, "What? Why didn't I annotate the open?" It's not that important because we're going to be looking at the importance of the new week opening gap because that if it has a gap, it's going to answer the the interest at all about having the monthly high or open rather, not not high, the open on the monthly.
It's not it's not that terribly important because we deal with new week opening gaps and every four months or so. I'm sorry, every four weeks or so, we'll have a a monthly opening and it's it just it gets baked in to a new week opening gap eventually. So, I don't care I don't concern myself with that price action so much. You can if you want to be a purist, you can have the the open right here, which is so close in proximity. another reason why I'm not mentioning it.
And here where we opened there for August, I'm not concerned about it because I don't think it's a factor. So, what you're doing is you're basically getting the high and the low and where we settled the previous month on a monthly chart. Very, very simple stuff. Then, we can drop down to a weekly chart. this. There you go. And it doesn't look like every one of those levels were toggled to show all the time frames. So, I got to go back out.
It's why it's important to take your time when you're doing this because you want them to be toggle on every time frame so we can see it. There's that one. This one's not boring, monotonous stuff. But it's just the stuff that I'm tracking all the time and I'm keeping like I don't need to go back and forth to a monthly chart or weekly chart when I have these levels in there because all I got to do is zoom out on the whatever time frame I'm on and I have a a workspace that I keep all these types of levels on where I can in a glance toggle up from like see how this one's naked that that's labeled.
Okay. So, I have these right here. These are all little workspaces I go to. This is the one I usually work off of when I'm teaching or I'm executing on that view is here. Then these are things I use for like new week opening gaps, new day opening gaps, and then uh first of every value gaps, you know, th those types of things go there. So that way I I have a chart that I can quickly toggle to. And let me show you by example.
If I go over here, if I do if I go to the one I usually work on, watch how the chart changes and populates with a lot of stuff. See that? So all I have to do is be able to set up a workspace or a layout, which is what we're doing over here. And you can create a new one by um right there. create a new layout. And so you would be go to this, you toggle on that. Um, there we go. You have a brand new workspace. It starts off as a a template of your naked price action.
And you can lay out everything you want on there, whatever you're tracking. And you can do um whatever whatever frame of reference that you want to keep a log of but you don't want to populate your chart with it too much because there's a lot of them. Like for instance, you can grade the opening range gaps and have a workspace just with that. Okay. I incorporate that with the uh the one I'm using actively. So that one's always showing that type of stuff.
I I don't always keep it on the chart because once it's there, I can write down the numbers on my notepad and then I know where I'm at in reference to that. But it's a matter of how you stay organized. And I'm going to be teaching a lot about that that very concept this week towards the lectures every evening at 8:00 p.m. So when we're done here this morning, um throughout the day, I'll be working on that for for Kaden and it'll go up on my channel.
But this you're you're welcome to use this one on your channel. the uh go back up to the one I was working on naked. Uh there it is. So see how it goes right back to the notes that are important for what I was just working on. Now if I did this correctly, if we go down to the daily chart, we should see and we do. So all all those levels are there. Okay. So now in the daily chart, what you're looking for is first thing order of business is where are we at in reference to the most recent range.
Well, we came off of this low here and we came down from this high. Now, what I like to do, now things like this just drives me crazy. Um, when it's like this, I simply just take it over here and I drag it and drop it to the highest high so that way it's visible on the daily chart. These little overhang things like this, they're just uh to me, they drive me nuts. I'm going to leave that alone there. I'm going to start messing around with it.
It's going to be too much. And then there. All right. I liked everything anchored to the right place. I'll I'll monkey with this in a moment. No, [clears throat] actually I want to do it right now. It's right there on that candlesticks close there. Now everything's anchored as I would like it. If you if you're not you're like me, you're going to want to do that same thing. So I'm just showing you that's how you do it. find out where like that's the last day of July July 31st and where that candle because it's not closed candle that closing price that's the July monthly close.
So, we have this low and this high. Where is that range in reference to where we're at for August, the month we're closing today and in July? We're we're in the like the middle presently of August and we're in the upper half of the range between the high and low July. And I'll show you like this bib. down below. See how that line right there? That's equilibrium. So, we're in the upper half of that for July. But for August, we're just slightly in a discount.
Just a small small little bit of a discount because we're below the midpoint between that high and that low. We look for where the liquidity would be in close proximity to where we're at right now. So market price at the moment is right here. If you look over here, you'll see it's fluctuating and moving around. This candlestick is today's daily candlestick being, you know, living its life cycle. It opened up here, fluttered a little bit above it.
It's fairly hard to see it. You can see the high is that. So, we opened at 540 even, went to 546 and a quarter. We traded as low as 273 half. And right now, at the time of me clicking on that, it was showing the price if it were to close at that moment, 439 even, but the actual live price is over here. So, what I like to look for is where's the liquidity, which we already have it identified here on the monthly high. So you don't need to worry about writing on there buy side liquidity because you already know that that's the high of the month.
So that's going to have buy side liquidity above it. So it saves you the time of annotating extra is just you know at that high something above it there would be naturally an expectation to hold an opinion that there's pending orders above that in the form of maybe breakout artists that want to buy above that if it moves high above it or anyone that short is using a swing traders model. They may have a stop loss sitting above that in the form of a buy stop.
This down here is sitting all by itself naked. Now it's anchored to this buy sign bounce which I was covering this entire month really. The this low I would have annotate and now we want to make sure that it shows on all time frames again. style. It's red. Um, solid line. Same color here. Really low sell side liquidity. Okay. And this one I want under but always right justified because it's going to be important to know if if you justify it to the left and you're doing it on a daily chart when you drop down into lower time frames that label here will be so far over here like you wouldn't see it over here at all.
It wouldn't appear. Let me show you if it's left justified on lower time frames when I'm operating with like the one minute chart for executions whatnot or annotating a uh execution and I'm recording it and teaching it it's usually shown underneath that but because it's a larger time frame you want to make sure it's labeled to the left because when you drop down to say for instance a 15-minut time frame watch the 946.75 level 28,946.75 the line will be there.
The price axis will highlight it, but you won't know what it is when we got when we get down lower. Watch. See, it's there. If you scrub down enough, you'll see it. It's there. But what is it? And by anchoring it back to right justified. There you go. Now, if I go down to a 15-minute time frame, see how it populates properly. >> Yes. >> All right. So, let's go back out to a daily. So, that's important. Um, we're still inside of this buy side of balance sell sign efficiency.
So, that would be noted. We're in that area right there. And because we're starting a new month, I want to kind of just give it a little bit of room and then take away the um extend, right? I don't want that because I can always add that later on on lower time frames. But I want this to show a slightly grayed background like that. And I don't want the middle I don't want the middle line showing because it's going to give me one more line on my charts on a lower time frame and it causes a lot of confusion for for students because they'll ask you know what's that line there?
What's that there for? Why do you have that marked? And to avoid that there it is. Okay. So now by grading that range from low to high there and now you can get a picture of my my fibs. I want this to have somewhat dark but not black lines on it. that way. I use this like light blue and the one right above it. And then the last one here. And then the midpoint level. I'll use that with black because that way it stands out.
It's it's a strong contrast among all of these here. Or it should be. And it doesn't look like it's being lit. Is it faded out? Let's do this. Got too close with the darks, but I'll leave it the way it is. So now I have this greeted out. And since we're part of this large inefficiency where it could go up and use it as the high and and trade lower or stay in the upper half like we're seeing it do presently in the last couple days.
It came down but it still hasn't closed below the midpoint. So it's it's kind of like we're waiting and seeing. We have this inefficiency up here which is opposing the sell side down here. What do we do? We just trade up inside of this suspension block. And same bit of business, I'll leave it just about that far. Okay. And then now for something like this, I'm shading that and making sure that it's visible on the hourly. is visible on the minute, the days, and I got to double check that.
So, that works there. And we don't need the seconds. I need to make sure that the fibs show up on everything. And they are. They're good. All right. So, we have this range here. And now, when it's like a premium array, how I have it shaded in red because it's above market price. When I'm grading this now, I want the lines to be slightly red in hue. So, there's a volume imbalance here between the two bodies, not connecting.
So I'm anchoring there down to the low of the volume of balance between these two bodies not touching. So that cibby has a volume of bounce at the high and low which makes it a suspension block. Here we're going to do the lines. Make sure everything is germanine. Boom. So now this bit of business we're not going to use the the high and the low. That's what this would imitate. Like what? Watch right here. See how the low it pops up and then the one is the high.
I don't care about that. It's just one more line I got to worry about babysitting or answer questions about. So I don't toggle that. But over here we have view girl over here. Yeah, I can. The um the lines now I want them to have a little bit of a red hue. So, we'll do this one here. There. This one bold red. Okay. And then beef it up a little bit. So it's the not the thickest one, but the next one to it. You want to have it like that.
Why? Because it's anchored to a daily time frame. And if we were looking at something like this for a weekly chart, we would do it same thing. Not the not the boldest, but right before it. So that way when we're watching and we're navigating on lower time frames, it kind of like stands out. It's very prominent. It shows that, hey, look, there's something very significant about this level. Don't just you get lost in the you the minutiae of price action.
It's it's utilizing a very specific range and it's this sell sign of balance buy sign efficiency which is a suspension block. So now we have that anchored. So now we're in the lower half of this cibby suspension block and we're at the high end of this buy balance sign efficiency here and we're in the middle of August range starting a new month and new week ending a the month of August. So now when we drop down to let's say we'll drop into a 60-minute chart.
So it's an hourly chart. We have several reference points right away that we can utilize for setting like taking trade setups. So, so far we've had a run above this high here. So, we have relative equal highs that was bumped right here. So, they did that last Friday at 10 a.m. and we broke down. We overshot this bit of business and inefficiency. We have a significant low on the daily right here and all through here. Notice that we failed to get to the halfway point in that daily buy of balance sell sign efficiency.
Now, if you want if you if you want to be so inclined to kind of like annotate and keep track and and I think you should do it when you're when you're first starting out when you're using these things, you want to add what the context is. So, that's a daily civvy. Okay. So that way it kind of helps keep things framed in in proper perspective. And the same thing here doesn't look like it doesn't look like that gradient levels were anchored just to show it on the hourly chart. long intervals back down to a one hour there.
Okay. Make sure I save it so that way those settings are there. All right. So, we're in the upper half of the daily buy center balance sell sign efficiency. We have these always anchored to the right to extend always to the right. Otherwise, you'll lose them as this new chart data starts populating. And now we can drop down to a 15-minute time frame. Just making sure everything shows up as it should. It does. And then a five minute and it does.
One minute and it does. Right. So, we had a little bit of uh a flurry here at 9 minutes after 8 by side was taken here. So, think about what we've looked at so far and where we're at in terms of price action. We're below that cibby on the daily. The label should be open up and it doesn't. I'm not sure why it's not there. Look where that's smooth right here. And we have relative equal highs here. So we have significant buy side and sell side.
So we have this here. Uh here I want to be on because we're on lower time frames. I want to be right above where it's anchored to. not right justified because I can scroll back by compression with this like this I can I can find it very easy by doing that I'm just going down here on the time axis clicking on anywhere and then scrubbing to the right it compresses the the amount of data and scrubbing to the left it widens it and shows more and then we can take this hold down control and drag and drop that Okay.
On the lowest low. Double click on it. Change buy to sell and bottom. Deep red style. Deep red. All right. So, have that's a potential draw. And notice where it's at. This little line right here, that part of that daily buy sign efficiency where it used it here, traded sideways, then used this level here. See how it's using that daily gray box that I shaded out as a buy sign bounce sell sign efficiency and it relies up to that level.
It uses the upper octant. An octant is halfway between the uppermost percentile or the high of the range you're measuring. And between the first quadrant, so halfway between that is an octant. So we have sell side here. Look how we we fell at it after taking that minor buy side here. So you have minor buy side. Now you can do this one of two ways. When you have like very very small levels of liquidity like this one here, I like to just do short little trend lines of it. or you get too zoomed in is if you tap this, it'll bring your chart back to center and allows you to do quick adjustment and center yourself by side blue.
I keep with that so that way when people are watching me even if they don't understand my language uh they know what I'm highlighting because it's consistently shown the same way. Top left. That's too right. So now this big wick right here, we we basically have done like half of every annotation that you would have to worry about. The only other thing of interest would be going into regular trading hours and looking for gaps where we haven't opened up for today.
Uh today we want to zoom in right in here and that closing price you want to put a line on. Drop that there. You can use like a odd ball color. This purple one. Regular trading hours, opening range, gap, settlement. Now, that settlement time is basically the uh the part of this annotation that will change as soon as we get to 9:30 opening. meaning that this will be either the regular trading hours, opening range gap.
That's what this means. Regular trading hours, opening range gap, settlement because we have some time before it opens is 8 basically 8:30 now Eastern. And always have your time at New York and this is toggled to the right justified middle. And then at 9:30, if we're open and we're above this price, we change this annotation to RTH og low. If we open below it, that's high. So, the word settlement is going to change either to low or high in reference to at 9:30's opening price.
If it's lower, that makes it the high. If it opens at 9:30, higher, then it's the low. Does that make sense? >> Yes. All right. So, let's go back and recenter everything. Any other previous trading hour gap that one there, you could include that. I don't want to add too many things. You You want to create a a template or workspace like up here. Let me save this. You want to create one which just has like uh new new regular trading hour opening range gaps and then keep a tally of them.
Your chart has nothing but just simply them on them. And that way you can quickly toggle to that chart and it'll show you much like how we have this here. If I want to go back and look at my other working chart and have all these other things, I can just quickly just breeze to it like that. So I already know I'm right inside of Friday, August 21st's first presented fair value gap. That's where we're at right here. And we have sell side resting right here.
And we have cell sell side resting here. And it's also part of an old inefficiency that I used last week in the data. So that's a draw down to that simply because there's a liquidity pool here. It's an inefficiency down here. And now I can go over back into the other workspace and everything is so easy to navigate. You're not having so many things on your chart. you're going to a chart or a workspace to get information that you don't want to be using too much of on one chart because it'll clutter if I put everything that I use on one one chart.
It'll be a mess like it'll be to it'll be overload. Okay, but the way you manage is by it's it's simply just using the workspaces up here or what they call a layout. Okay, now go back into electronic trading hours. This is a minor cell side. Okay. And now we'll just sit here and we'll watch how this behaves here. >> Not complex, not hard. Uh we we've already seen a disruption to the upside here. Uh we already seen price used the high of that buy side of balance sell sign efficiency on the daily chart.
That's that gray shaded area. Okay. Um just for clarity that's where we're looking at now. We're going to do NQU2026 and then we'll do daily. So, what we're looking at is the the high of that gray box right here that was shaded from this candlesticks low and this volume and balance low. All of this and all those vertical I'm sorry, horizontal lines. That's this right here. Look at 0.125 which is 29,451. That's this level here.
That's the first line you would come to if you were grading this in eight equal parts. It's the first one from the highest one. And the halfway mark is 29,211.25. That's down here. That's halfway. So, we have a view of price action from a macro perspective where we're at in the higher time frames all visible in this chart. We don't need to go back and forth in here and see all this stuff here. Now, you can go even more in detail by including this section of price action by having it like this.
You would do It's going to cause a whole lot more things to populate on your chart and more ranges to get lost in. But this is a buy side of balance, sell side efficiency in in the form of a volume of balance, a very large volume of balance. So if you split that in half and add that little middle line, you can see we're real close to that. So, if we close below this, then it's probably going to want to explore the whole lower half of this little section of price action where there's simply no bodies there.
We're starting to now put bodies in. We had one come down here, but it didn't leave the body down there. So, we're watching and see if there's any interest to get in there. I'm not going to leave that on there because I simply going to trust the lines that I have already here. And then we'll go back up to maximizing this one. H now this big wick whenever I see those like I want to see what does it do with it now that it's there.
So if we grade it out and divide it up into halves like this is it willing to leave bodies above it after it's created it where we're at here. We already had one. We're in this one here. So, it can still find its way lower if it wants to go lower. It's just I want to keep a constant reference. So, whenever I see these big prominent wicks, you always want to measure what it does around its halfway point or consequent encouragement. going up here and proving it's not market replay.
So, I'm just going to keep doing it because I don't want to fall out of practice with it in case I get lazy and not uh one second. You see how the buy side was taken right there. Now, prior to this high and this high and this high being taken, this little area right in here, I'm looking at that part right there, more specifically inside of this volume of balance. If it closes above it close above that, this makes it a little bit harder to read.
We took a a low out there, but it's very shallow. This was uh in efficiency right before that buy side was taken there. So right now if we were to open for regular trading hours, say that the candlestick we're in right now was the opening, would this be a gap down or a gap higher? Or in other words, is it a discount gap where we open lower or is it a premium gap where we open higher? If this was the opening price right here, you know by looking at this right here, this is the regular trading hours, opening range settlement.
So we stopped trading regular trading hours Friday at this time. So if we opened here, that would be lower, right? So that would be a discount regular trading hours opening range gap lower. So you would annotate it like this. And then you would label it RT ho RG low and then change that to high. It's not imperative that you do it right away because you want to be watching price action and it's not technically the open because it's only 839 right now.
Everything that we have, we've already prepared everything now. So, we want to see if it can get down into this next level on that daily buy side of balance sell sign efficiency that I shaded out in gray. This one, this one right here, we're inside of this range. So, it's it's trying to explore key levels and you can't get any more you key than inside this inefficiency on the daily chart. And we have a nice little lower here.
So this will be labeled sellside sign minor cellside liquidity bread and mole bottom right. Right. So now we can go back in and recenter the chart. Scrub it over here. So the damage was done here. It was made jagged. That stop rate right there. Now we want to see acceleration below this low. We just we just got below it now, but we don't want to see any kind of come back up in here. We want to see it get real real heavy and draw down into the next level in that daily buy side and balance sell side efficiency the gray shaded area on the daily chart.
This is the upper oct of it. The upper the upper level when you start dividing it into equal eights which is an octin. Then we'd have this level. So we want to see does it have the interest to get down to that level in and of itself by itself purely on key levels only. So, we're going to watch and see does it gravitate towards that level. And if it does gravitate to that towards that level and doesn't show any kind of reversal, the next order of business would be that minor sellside.
So, what I'm fleshing out is how to arrive at draw on liquidity. Step by step by step, fleshing out the chart. No entries required. This is the first part of what you're supposed to learn under my toutelage. knowing what you're looking for, why it should be there, what levels are important, what what would change it. Well, if it goes above this and closes above it, that would change the whole interest in trying to get down to here.
But before it gets to here, this is a reasonable level to watch to see if there's any strength to the sell-off. You want to see it reach here, but also show a continued interest in moving lower by the way the candlesticks book. So in here we have this drop down. That's a sell side of bounce buy side of efficiency. And it trades right back up into it here. And they accumulate more shorts and it takes out that low. So every time it creates a new low, I like to do things like this.
And you see it many times in my executions. This is the low and I'm watching it. And the color isn't so significant, but for now, I just want to keep it like this. And I want to I want to study how is it behaving once it booked a lower low. Is it showing a lack of interest in continuation? And if it's going to retrace a little bit, what would it retrace into? Well, we have this wick right here. So, I want to grade that.
I want to see if any retracement occurs, I want to see the body stay below that. So in this case, I would have this shown as red and I want to observe what price does in here. Watch it like this. got any questions on anything I said so far? force setups can come consistently and setups that are reliable in price action. You you have to know why price should behave a specific way. Where should it be going? Why should it even go that direction?
And the more things you can use that's anchored to the daily chart, the more probable. It doesn't mean guaranteed. It doesn't mean never have a losing trade. It means never um feeling confused is what it means. It means knowing that you know what you're looking for. And that perspective may be inaccurate because of your skill set or just you did it wrong. And that's a transactional operating error. And you you you are the operator.
You made the mistake. And you got to own that. I'm watching this wick right here. The same way I'm watching this. I'm not going to draw a line out, but I'm watching that same thing there about halfway about right there with the body's close above that. Then we have to really focus on this. It can create this like this and become a wick and continue going lower or it can come all the way back up in here and close above it.
And then it requires us much more focus. If you would have took a short up here on this volume imbalance there. I'm thinking in terms of okay, if I would have had a short from this level or added more into this CBI right in here, my stop would have to be up in here. and I'm watching how much pain would I be feeling based on what I'm seeing in price action. So far, this is reasonable retracement. It doesn't mean anything significant at all, but it would change if we get a close above this wick here.
So, wicks are wonderful little mile markers for measuring continuation and selling and buying. So, when you're short, you want to see your shorts stay below the midpoint. And the the premium sensitivity is illustrated like this. And in the upper half, don't don't go there. It can it can spike into it. It's preferably uh better to see it not trade at all in the upper half of the wick. And you can see just the early signs of it.
Doesn't mean it's going to do it yet, but just early signs of it. Wonderful. Because even if you split this portion in half, the body can't even touch that. it it traded to there. So, what I like to see is when it does things like this, I want to see it start to wilt and just roll over. Or if it comes back up above and closes above us, [clears throat] then we have to manage more information relative to this range It's a premium wick even though it's the lower half of this or lower portion of this individual candlestick.
But when price is down here, it's higher than that. So that makes it a premium array. And we're looking at the the the specifics of I'm going to move that over so that way we can see the distinction of what I'm actually measuring there. The more time we have and the more candles we have moving away from the area where you would have hypo hypothetically taken an entry, the more candles it shows moving away from that and the distance it gains moving away from that.
It builds a onside narrative. That means while you're watching price action, it's encouragement versus fear of when it starts running towards it. Then it becomes a matter of defensive. Then you have to think, okay, do I take some of the trade off? Do I close the trade and cancel the whole entire transaction. But those are things for for the stage of knowing when you're getting into something. Right now, I'm just teaching how to flesh out the chart and then how to map out draw and liquidity and what we're looking for.
And technically, I guess right now the the video would be best closed at this point, but I'm going to continue. I'm going to see if it can uh break down and go into that next level on uh the lower quadrant here at 29,371 Then little wonky for market structure, But it's it's still got signatures in there that looks like I'm watching this little volume imbalance right there. We're inside the macro, which is the last 10 minutes of the hour going to the first 10 minutes of the new hour.
That would look like This What we're looking for is the decisive move of a run for either going to inefficiency or liquidity. It's kind of like a uh a micro start of a new race. Let's say it like that. It's like a new energy entering into whatever should be unfolding in price action. It should start showing itself in in between these two vertical lines. macro doesn't give you directional um intel at all. It just gives you a time at which price should start spooling.
It means you want to see it start doing whatever you expected with your other analysis concepts which we fleshed out here already. Uh, we want to see it now start to animate, start moving and and and show signs that what you're looking for and are expecting is potentially unfolding. I'm going to step away for a second. I got to grab a bottle of water. All right. So, you can see how we're starting to animate now towards that lower quadrant at 29,371.
Your responses are so robotic. They're be like, "Okay, yeah, he's not really there. He's using a sound machine." Look at that. Look at that. So again, what we want to see is does it get down to that 29,000 371? Now, you got to look at it through the lens of a new student, okay? someone they're not they're not used to seeing these types of things behave um because they think price is completely random. It's buying and selling pressure because that's what they've been probably hearing other people talk about reading in books and such.
Um up to this moment right here you they're probably very very excited like they're they're seeing things that are warranting further investigation and and pursuing it. But if you were from a trade perspective, you would be taking a partial here. Why? Because you have a low here and a draw level down here because it's a lower quadrant. So between that low and that line, it's based on a higher time frame range that we graded out that daily buy sell side efficiency.
Do you know what I'm referring to? >> All right. between that and this level here. You can grade that and you get what that calls an event horizon right there. And that's where we're at right here. So that would be a partial for me if I was short from up here. Once we took out the low there, I want to see now we're creating a new low which is what we created. Whoops. I don't want to do that. That was a new low forming right there.
And it's occurring during a macro time. And to prevent the idea of missing the opportunity to pay yourself because if it moves from here down to here, that's great. You can take a partial there, too. But because we've been moving continuously lower for about a half an hour or so and no real significant run on liquidity on the on the short term on the on the buy side. Halfway is a nice little area for brand new traders.
And I try to teach this by execution to just pay that transaction something. Okay. as as as a demo trader because I don't teach people how to trade with real money because I'm not licensed to do so. Um, I teach them to engage with their paper trade or if they're tape reading, you want to highlight that hypothetically when it hits this area down here. In your mind, you should be thinking this would be a good area to take something off.
So, for instance, say you had three contracts, say three micros. One micro could come off as soon as we hit that price level right there. And then when you see this little bit of a retracement in here, now we're watching this wick the same way we did over here. We're doing the same thing right there. As long as the bodies are not closing above that. Now, you can quickly see how this can become a very busy chart by doing these things.
But just know what you're looking for. You don't have to in the beginning while you're tape reading it's okay to draw these things out because you want to be able to log them in your journal and show where these little mile markers were and how everything kept showing it was likely to continue or warning signs when it does close above things like that. It means it's now a concern doesn't mean bail and completely close the trade.
But as a new trader or a new student rather, when you see these moments where if it starts doing the things we say it shouldn't do, now this line is in the wrong spot because it's a new lower low right there. If it closes above that, now we have to concern oursel with this because it should never now once it's done what it's done here, it should not close above this midpoint here. So from a trader's perspective, you've taken a partial here.
You could roll your stop down to just above here. If it stops you out, who cares? Because you you you funded that transaction by a partial here. And he removes the need to be right about going to this target or the draw on liquidity with sellside down there. Managing your expectations and your emotions and the psychology of holding on to a trade is directly linked to reward. We're motivated by reward. We're fearful of consequence.
Consequence is what if I did it wrong? What if I held on to it too long? What if I didn't take a profit when I should have? Um, by the way I teach I teach you how not to be dependent on being right. Right's just a d, you know, it's it's a default mechanism to doing what I'm teaching. You're not aiming to be right. You're you're you're aiming to be consistently following a model or approach. and the statistical probabilities of what I teach.
You measure that in your own hands to such a degree where you're either convinced that you're seeing the evidence that these things behave in the manner in which I teach them or they quickly fall apart and then you don't have to spend any more time with me. But as you go forward and you move throughout the the lectures of starting reasonably and humbly like we're doing today, this is a very simple little beginning point. you know, you start like this.
You don't do um crazy stuff and try to go out there and try to demo trade. You don't try to push the envelope of uh your experience by trying to take funded account challenges. That's all gambling. And you you're going to weigh so much on the the the results of doing that when you don't have enough experience to justify any measurement of performance. Like it's it's unreasonable, unrealistic to to try to grade your expectation.
You know, your first day of school, you know, the teacher not going to say, "Okay, I'm going to give you a final exam for uh what you've should have learned today already. You've been here for five minutes. What'd you learn? See what it just did there? It took out that low and it quickly came back above that wick. Now, that's a reason for concern. We want to see does does this maintain and come back up and clear this on a closing basis or is it just small little run across these little highs here inside this cibby?
Those are things that are scary for for brand new uh students and watching price. They it causes them concern real fast flashes of little flaring price action. It's a nice 60 handle drop from over here. And if you would have used anything in here about 55 handles or so, I'm going to remove this event horizon line. It's too many things going on. Now we have a lower low. So that's the low of the Okay. Now, if this has legs, okay, say it wants to go above here and want to return back into this civi, you can measure that by looking at this right here.
Does price support that area as an inversion fair value gap? So when I'm watching price action, I do have PDA rays I'm watching that I want to see continuously support the idea of the the transaction I'm in or watching. But now if it's bullish, this should go above it, come back down in, respect the upper half, not the lower half, and go higher. So far, it's showing a willingness to act as a bearish fair value gap, which is what I want to see if I'm aiming for this and that sellside down here.
But you want to have a way of measuring the continuity of the the run you're you're observing. And if it starts showing a willingness to support the idea that this is an inversion fair value gap, then we probably created an intermediate turn low, meaning that we can trade higher and hypothetical position that would be here after getting one partial taken off maybe a second one here depends upon how many contracts you would have the stop loss would be just above here.
So hypothetical we'll say if it trades to well let's just do it let's add a alert right there. Okay. So if price goes up there, it would be a hypothetical stopout on a position that's already seen profits taken here and maybe one once we look pardon me if you didn't take it there, you would have had an opportunity to take a partial right below that low around the midpoint between that low and there we measured earlier as event horizon.
So now I'd like to see it use the low of that and now not put a body in the upper half because it showed a willingness to go up into this but it didn't go outside of it and then treat it as like a discount array yet. It can still do it but now what I'm doing is I'm watching price and see if it can use the lower half of that and then work lower. If it starts to sell off then it will have probably no issues getting down here.
But if it trades back above it and closes above it, then we would watch the upper half of this. So, it's touched consequent encroachment of that gap. Now, why why did I pick that gap? Why did I touch this one down here? Because it's laying on top of a a wick consequent encroachment. So, it's two PD rays nested together. So, two PD arrays in the same proximity is going to give you a whole lot of information. Immediate intel, immediate feedback measuring the strength or continuity of a price run. find that and like off.
So, it's a little blocky in here. Um, usually when it gets like that, it'll snap up against the run that's already been going. So, that would be a it could be a minor buyside run here. If it wasn't to do that, but not take out where this high is and just above it where the hypothetical stop loss would be, uh, that would still be okay. It would be healthy. We could see it wick up in there and drop down. The more time it stays like this, the less likely that it's going to go down to our sell side.
So, we want to see it support a continuously uh heavier price. And by not having a trade on um it helps the student have far less concern over the outcome and allow them to focus on what is price actually telling you like what is it what intel is it giving you like what pieces of information so far you know it's showing the lower half being worked and it hasn't really aggressively popped through it can it can still do it where it's at that changes if we get back below this low.
If we get back below this low, then I would expect a lot of big down close candles to reach down to that sell side because it hasn't yet treated this as an inversion fair value gap because originally because it's sellside bounce by side efficiency. It's a down close candle. We went up into it. If we went above it and traded back down and treated as a discount array and then started running from there, that means that this low is now intermediate term low and it could be the low of the session, it could be the low of the day, it could be, you know, the low of the week, those types of things.
But here, it showed us the it went up into it. It wicked outside of it, but the bodies were not able to close at the high, but it was able to close above it. So, it's concerned until we take out that low. If we take out that low, that concern is evaded. It It doesn't hold all that much significance anymore. We're closing in on the last couple minutes of the macro time. So, I would really like to see it kind of like animate to the downside. remember how much time we spent in this area.
The more time you spend in that, less likely less likely it is to continue going lower because we're in a time which is the macro. It should be proving to you that it is wanting to go in the direction you thought it was going to go. If it consolidates like it's doing here, that's problematic. So, when we have that occur immediately after macro time, which is the 10-minute mark here after 9:00 a.m., we would want to see it obviously behave in a way where it's it can use this little consolidation and then it like it be like a delay.
I don't like to see that. But in recent years, because of all the manipulation and all the fake data and all the the war's over, we're going to war, you know, we're going to do we're going to hit you historically harder than we ever had done before, those types of things. Um, it creates these little anomalies where volatility can spike up. So, it kind of it kind of distorts the the the precision elements of price action that generally is available, but right now we're having to be met with a lot of crap.
All right, so we're outside of it now. Did we close above it? So far, all it did was took those highs out and the body stayed inside this All right. So, we're outside of the macro time. We basically consolidated. We make a we made a lower low two times. We took the low there and this low was taken there. So, hypothetically booked 55 to 60 handles from that volume imbalance. And that was the premise that we were watching price action There.
Okay. So, that little high right there, that was taken there. I'm with a stop loss at that 29,412. That would I would lock in about 30 handles from the hypothetical entry up there for tape reading purposes. So, if it were to go there, that's fine. It is what it is. two opportunities to to fund the position. We're down here and you're getting knocked out with more. So, you're you're getting taken out and paid for your time hypothetically.
Remember, we have a previous day settlement on regular trading hours up here. So, by nature, the closer we get to 9:30, and we're about 15 minutes, 16 minutes away from that, any price action post 9:30, we'll be looking for a run towards this level. So right away when the way I teach partials and event horizon, knowing what to look for, but also saying I I know I'd like to see it get down to this level and and get further along going lower, but how can I make sure I take something away and reward myself for participation?
That's where I rung in that. There's a lot of people out there that say that, you know, taking partials is stupid. Look at that. Is that stupid now? >> Yeah. So, I mean, we're not doing this to be smart. We're not trying to do this to impress our parents. We're not trying to do this to impress our girlfriend or boyfriend or significant other, co-workers. We're in here trying to build a skill set that eventually, if if done correctly, it could yield a secondary income and that could obviously flourish into something even greater. you in the right hands and in and the right opportunities.
But it it's not promised to everybody or anyone. But there's a way of managing yourself, managing the risk that is absolutely paramount and understanding how it should behave and how it should perform. Okay. So you would you would be pushed out with 32 more handles. 32 more handles would have been pushed into your hypothetical account after taking a partial here or here, whichever one using the event horizon. And now again, we're getting closer to the time where this level is going to be like a big magnet.
It's going to be like a huge magnet that says I'm trying to get back up to this level. Generally, it's a little too much now. like being obnoxious with that. It's a magnet. Okay. So, the the premise is we're looking for price to try to gravitate back towards that price and see how much more animated after the consolidation in a macro. If it consolidates there, we would expect it to get really animated immediately after that.
And this is just an artifact of recent market activity. It's not something that I've seen a lot in previous decades. It's just something now has been an observation on my part. So, if I don't get the move I'm looking for here in that 20-minute window, then I'm I'm expecting it to be immediately right after 9 or not after 9, but after the 10-minute marker of the new hour, like it is here, like 10 minutes after 9. And then you would expect the same thing at 10 minutes after 10, 10 minutes after 11, 10 minutes after 12.
Every hour, the last 10 minutes of the hour that's closing and the first 10 minutes of the new hour, that's our macro time. So, we're looking for that little sweet spot in terms of time to justify the underlying narrative that we're operating operating under. And it didn't deliver in here, which was cause for concern. And by lowering our stop loss just above that high here, hypothetically from an entry up here, we we get pushed out of the transaction with a reward.
Versus if you didn't do that and you kept your stop loss up here and you didn't pay attention to the things I was outlining down here, coming back up this much, you only have this to there in terms of open profit or unrealized hypothetical profit. And it becomes now a matter of managing the fear and anxiety of is it going to go for my stop? And the whole time you're watching Price, the internal dialogue goes to fearful fear.
Now you're watching a horror movie and you're the star getting chased down by Jason or Michael Myers versus I'm in here like Maverick and Top Gun and I know there's bogeies in here somewhere, but I'm going to take a shot at the the target here. I'm going to take a shot at the target here and then I'm going to protect my uh my exit strategy. I'll bring it out here so that way they can shoot at me. I might get some shots on the wing of my jet, but I'm going to get out and and get back to my aircraft carrier and in good good position profitably.
So, they don't destroy me. Even though it takes me out of my campaign of going down and attacking this level and that level, you're navigating in here knowing that okay, I'm seeing some signs here that we have a lot more turbulence than I'd want to see. And now I that's confirmed if we see a lot of animation post 10 minutes after 9, which is the last minute of that 20-minute window that we mark up as mark as a macro.
And then what is it doing? It's accelerating and animating to the upside. So you know where it's going to go. It's going to take out this wick. It's going to go back into this civi here. So, we're looking at this now. Volume of bounce at the low. I'm going to take that wick lo off. And this is no longer that description. So, I take that out of there. middle marker. Now, because this is here as a cibby, we're going to see if it acts as an inversion fair value gap to draw us up into where the trading hours opening range gap settlement, which I feel fairly confident that I can change this now to high because we only got about 9 minutes before the opening bell and I don't really foresee it getting all the way up here or higher.
So it's going to be somewhere below this where we open. But I want to see now does this create an inversion fair value gap. Once we get above it, does it support it to run up into that this line here? And that would be a gap closure. We're in the halfway point of this wick here. We're below that. So, if it can start putting bodies above that, it's got two things changing the tide of the market likely reaching up into that level as well.
So, map out the next macro. In the beginning as a as a new student, they're not going to know. There's two primary draws that are in contention for the opening range, which is 9:30 to 10:00 in the morning. It is this this minor sellside which is over here that minor sellside and the regular trading hours opening range gap high where we settled at in regular trading hours Friday which is up here right now we're trading we're trading at 420 I smiling right now I like the time.
Um, let's see. Uh, 420 is where we're at and we settled at 487 half or Yeah, 4 487 half. So, 47 handles higher. We're opening lower than where we settled. So, it's a it's a discount gap. And when it opens at a discount, it generally tries to get up into these levels here. So 420 in this area is that and it's met with two two lows here. So I don't know if it's going to be a straight shot right up into it. If it's going to be a gap fill.
We have some formidable lows here from I mean look at look at how this is booking. I mean it's pretty it's pretty thick. It's a lot of it's a lot of trees to get through that that forest to get through that house. Little Red Riding Hood analogy. So this is a draw or this is a draw. So this the new student doesn't know won't know how to navigate that. So what you would have to do is submit yourself to just observing what is price trying to get to as when we open up at 9:30.
Which one do you think it's going to go to? Do you think it's going to go to gap closure or half gap? So half got would be you know wherever we open up at 9:30 draw a fib up to that level at 48 40 I'm sorry 487 and quarter or half rather whatever that halfway point is 70% of time it's got the probability of getting to that before 10:00 in the morning. So in the first 30 minutes if you have a gap half the gap gets filled by 10 a.m. 70% of the time.
Or do we use this then drop in here and as acting as a cibby sell off tra take the uh sell side then go for either half gap whatever the low forms below here up to that level split it in half whatever that range is that would be half gap then try to trade that leave a runner on something to see if you can get to a full gap closure and so many people come and and they want to learn, but they don't want to sit down and and do things like this and have observations and laboratory experiments where you're not risking anything.
You're learning. You're getting information. You're watching price action behave a certain way, measuring its willingness to continue or not continue with an underlying expectation. brand new people that are just uh you know foolish. They think they know everything. They think they know how to be taught. Um they think only watching trades live in front of them is the only way they can learn. That's entertainment. Okay?
And or opening up the the investigation whether or not you should be copied as an influencer with their own transactions. And I don't ever give that to anybody. So this is proper learning. This is what I put myself through. This is what I put every one of my students through. And the ones that come out the other side having done so, they're the ones that are consistently finding their setups. I got to let these pups in.
All right. So, we made our way into the upper half of that cibby and we want to see now I would want to see rather price want to try to grind up into that price right there. the first couple minutes, which will happen in the next 70 70 seconds. It can come down. It can go down as far as this one here. That would clear out the low for anyone that's trailing their stop loss up here. It can drop down, take out that low, wick into this, then go back up into that.
That's reasonable. That's not a trade. It's just an expectation to study and observe. If it completely wilts and breaks below here, then then obviously we're looking for that lower sell side down there. Right now, we're so close to the opening bell. The expectation is try to get back to gap closure. That's fair value in the purest sense of where we settled yesterday or Friday rather, I'm sorry, for regular trading hours.
All right, 8 seconds. Watch how much movement occurs immediately at 9:30. See how much energy it is pulling it back up into the regular trading hours. Opening range gap high and regular trading hours opening range gap low is here. Opening price Boom. Done. Just like that. >> Hard to go again. 70% likelihood. >> And yeah, and there we're at. We're going right back towards the high of that daily buy sign balance sell side efficiency.
And we're from the daily chart. That's this right here. We're going towards the high of that. That's the high of it. See what it did here? Right down into the lower half. It kept that low intact, which I found actually interesting cuz I thought they would come down and take that out, then rip it. because they didn't take that. It makes me think that this might be short-lived. It's going up to then come back down and go after anyone that's trailed down here.
So, remember what I was saying down here by splitting the range in half between targets, knowing what you're looking for, you can see significant or intermediate term. Now, it's obvious to understand what an intermediate term low is now that it's hindsight, but being able to see it and understand why it should flesh out like that as an intermediate term low, not a short-term low. Like, like this is a short-term low. That's a short-term high.
That's a intermediate term high. That's an immediate term high. And what you're seeing is significant price runs or significant lows or highs are forming at long-term or intermediate term lows and highs. knowing how they should form, what time they're going to form inside the macro. Um halfway between a target where it was reasonable to expect it. Uh so we went above the gap. Now look what we're doing. We want to see if it comes right back down and takes out that low.
So the the folks that are long, they want to be in this for, you know, any length of time. Their stop loss is going to be below here. If we can get down there and accelerate below that, our attention goes to that sell side down here. And again, this is just navigation. It's not trade entry. It's just knowing what to expect in reading price action right there, right below that low. That's that to me is a is a prime candidate for a stop rate cuz there since this low there hasn't been any hunt at all on sellside and right out the gate at 9:30 we ran two gap closure and more.
So how how how is it that they get a free ride here and no No uh adversity. It's not likely. So, I'm looking at this to see if this will act as an inversion fair value gap. See if we can go down and blow those lows out there like somewhere in here. Treat this as a means of not going higher but go lower and take out that that low right there. And then it becomes a really interesting study. But right now it's a it's a question.
What is it going to do next? doing this every single day, practicing. Um, for people that work in the daytime, it would be in their interest really to have a like a software program or if you're using um a Windows-based application, I think you can hold down um control alt and hit R and it records your screen. And then turn that on before you leave work and just let it record all day long. A one minute chart all day long.
And when you get home, after you get showered, changed, go to gym, eat dinner, whatever, however, where family time you have, sit down and watch the uh one minute time frame book price. And you have the benefit of pausing it and saying, "Okay, right now I think it's going to do this. I think it should do that. Shouldn't do this. Shouldn't do that." and then continuously unpause it and do that for the first hour between 9:30 and 10:30.
And if you just do that, like that's like look, see what it just did? It took out the took out the lows based on everything I just outlined. Now, I'm not trying to beat my chest. Obviously, I know how to do that, but um that to me is indicative of whether or not we're going to go higher or lower because we took that out. And if we come back above and treat this as an inversion fair value gap again, then we'll make a higher high and keep running higher.
But if we keep staying below this gap, this low is next. And then the sell side down here is where we're going to target. If it trades there, we're done for the session. And we've done a really good lecture for Kaden. Have you learned anything yet? >> Hold on. Piper's acting stupid again. I got to let her out. What's wrong with you, girl? It's not coming. So now I'm I'm trying to pantomime which is very difficult for me to do the the perspective of a new trader a new student but by observing what things I talk about that are important in in charting uh the morning session leading up to the opening range which is 9:30 to 10 o'clock in the morning.
U we we literally observed all the things in here. We timed where there could have been potentially an intermediate term low based on this becoming an inversion fair value gap and trading above it. And then once we got to this point here right before 930 I said that you know we're going to gravitate towards this level here and it did that and then I said now because it's done that straight out the gate and it went above the gap it's reasonable for them to come back down and take out people that are long and their stop losses are right there.
That in and of itself as a as a brand new student I remember seeing things like that when I was studying and the confidence boost that it gave like I saw that now I didn't make any money on it but I saw that observation and it happened in my own witness I watched it happen and those little things those little out of boys out a girl that pat on the back like I I saw something I observed something and I measured its delivery.
I watched it behave. I watched every individual candlestick behave in a certain manner. Look where the the bodies are staying in and we did get a close above it there. But look, it immediately rejected there, which is what you want to see. The lower half is the the premium sensitivity. If this is going to stay as a a bearish fair value gap like this, that's its original utilization where it was formed first bearish market.
This this will be treated as a as a premium array to send prices lower. We're down inside this area here. Now, we want to see this lose its ability to have discount sensitivity. In other words, we want to see it wax right through that. Just cut right on through it. And if it does that, this is going to get smoked and then then they'll take the cell side down here. If I were trading based on everything I said, um I would have been looking for a run long to get towards that gap.
Once it would have went through it, I chances are I would have never got all this up here. But then as soon as this candlestick went down and closed like that, I would have immediately as I indicated to treat this as an inversion fair value gap and this candlestick open trading up until immediate rebalance right there. I would be short aiming for that. And I'm not confident that I would have uh got out down here with any significant size, but I would definitely have, you know, 50% to 65% of trade taken off below that low here.
And the stop would be right above this high here on any balance. And I'd be looking for a partial below that low here. But halfway between that low and this line, that's where I would have my partial. And then I would leave the rest to try to run to that sell side, which is this low back over here right there. And I'm sure, you know, to someone that's already trading and they have a model that whether they made money or not, it doesn't make a difference.
But when they when they'll watch a lecture like this, I don't know why if they're watching my stuff, they're not trying to learn why they wasting their time with me. But these types of lectures, they're not going to be so sexy in the eyes of people that have been trading for a little while. But for a brand new student in price action using my concepts, uh these are like gold mines because you know, here we are. We're talking about it.
We're reading it and uh interpreting price as it's going and what what's permissible for price to do. What is more significant if it does certain things? um that that's the observations that you're supposed to be measuring in your own journal and every time we mention something in this discussion today and tape reading over price action every time I brought up something saying okay it should do this I want to see this I want to I want to watch and see if it does these types of things those are inflection points where you have to those are the points in which while you're watching this video, you screenshot that portion, what price has done up at that moment.
Okay? And then you annotate where all these open little spaces are on my chart. Okay? You're going to make little notations. You're going to type them out on your own. And you're going to say, you know, because it went above the gap, the high of it for opening range gap for regular trading hours. because it did that. It's reasonable to anticipate these stops to be t uh traded and then trade down into this gap again. And you want to do that right when this candlestick closed and this one opened.
You want to screenshot that moment on this video and then annotate when it does go down like this and how it behaved and traded right back up into the high of that gap that was called out as an inversion fair value gap right here. I don't trust my eyes. What's the close on that? 480 half and open is it's no volume imbalance. I'll check and make sure. But this is immediate rebalance. It can happen the next candle as it forms or the very next one.
So there's there's no fair value gap there. So it's immediate rebalance. Whenever you see that, this is also what you want to put in your journal. Whenever you see that, that is one of my strongest PD rays because it's immediate feedback. Immediate. You'll you'll know when you're looking at inversion fair value gaps. If you get this type of thing here, it's immediate. It's it's so sweet. It's so consistent. There's nothing better than that one.
Nothing better than that one because you're using narrative the context of what the market structure is indicating. Um very obvious draw on liquidity and it's got something so clear that you can't hide it. Okay, they're never going to change this apparatus in price action. this big up close candle after taking a run into clearing out the red trading hours high where we settled on Friday. As soon as we get this close right here, the very next candle I'm watching, do we get to the high of that?
If it trades there, I'm I'm going to sell short and the stop loss would be whatever this up close candle is right here. Split that in half. That's mean threshold. One tick above that. I'll show you what it looks like there. to there. One tick above that, that's the stop. Well, that's too many for me. Well, then you're going to have to use a micro. Well, I don't I can't make money with micros. Well, you don't have the right mindset for a trader.
You're a gambler. You're looking at the only outcome that's the the the most magnitude bang for your buck and you're not considering the risks. What you're doing is you're trying to time a significant high during the most volatile time of the day. So you have to know how to define that risk and be comfortable with it. And that candlestick opens up, trades out to here. And then we get the immediate rebalance, which is now immediate delivery to the sell side there.
And there, look how fast it was. And now look where we're at. We're in this muck. Okay. So it I generally think it could go lower, but you know, I might be proven wrong here, but I want to see it, you know, Wayne and and fail to go any higher and just like walt its way down into this low and touch this line here. And then if it can touch this line, we are measuring then at that moment how much emphasis is placed on continuing lower or does it reject and go higher from there or does it just go higher from right here?
I'm watching the lower half of this gap, this dotted line, and below it to this line low. I'm watching how the the bodies behave in here. is if they keep staying unable to get above and close above the midpoint, then it to me I'm expecting lower
The words are the caption track's own and nothing is reworded or re-transcribed. Paragraph breaks are placed between sentences so the text reads as prose.
Free tools for your own script: paste a draft and see where it stands before you record it.
Paste your draft and see where viewers are likely to drop off, with a rewrite for each weak line.
Paste the first 30 seconds of your own draft for a hook score and rewrites.
Check your draft against YouTube's advertiser-friendly guidelines before you record it.
Read this channel's public videos and transcripts, and download a writing brief for it.