Getting the transcript
Reading the captions from YouTube. A video nobody has opened here before takes 10 to 30 seconds; this page fills in on its own.
Getting the transcript
Reading the captions from YouTube. A video nobody has opened here before takes 10 to 30 seconds; this page fills in on its own.
The Inner Circle Trader · @InnerCircleTrader
This video has no Most replayed graph yet: YouTube shows one only once a video has enough views. These are the moments viewers replayed most in The Inner Circle Trader's most watched videos.
Most replayed moment at 51:50
3.7x that video's typical replay level
Okay? So, now we have two points of reference. Now, when I have this like that, I have two little sweet spots in the previous day's range and to the left of that, why? Cuz we're going to go back 3 days.
Said at 51:44
Most replayed moment at 12:06
4.1x that video's typical replay level
So we have relative equal highs during lunch macro, 11:30 Eastern time to 1:30 p.m. Eastern time. The setup usually forms in the first hour of that 2-hour lunch period. Okay? So between 12:30 noon
Said at 11:59
Most replayed moment at 10:06
3.2x that video's typical replay level
towards that of this buy side imbalance or side inefficiency, which is a suspension block, which has a volume imbalance on the high end and a volume imbalance on the low end. All right, so let's move into the lower time frames now. So, we're at a 1-minute chart.
Said at 9:58
The graph counts replays. It does not show where viewers stopped watching.
Words
2,651
Runtime
16:47
Speaking pace
158wpm
Reading time
11min
158 words per minute, below the 160 25th percentile of 349 measured videos. That distribution comes from the 349-video hook study.
Opening (first 30 seconds)
All right, folks. Welcome back. All right, so I want to give you a little bit of amplification of what I was visualizing today in price. Uh where some of the levels were derived from, why I trusted certain things versus other things. And if you look at last Friday and you see the low here, that's the low, the lowest low in the last portion of the day. So, here's 4:00 or thereabouts. Okay? And I'm measuring the
79 words, the words spoken in the first 30 seconds at 158 words per minute.
Free, no signup. See how the first 30 seconds hold attention, with rewrites.
Sentence shape
| Measure | This transcript |
|---|---|
| Sentences | 205 |
| Average words per sentence | 12.9 |
| Longest sentence | 81 words |
| Questions asked | 33 |
| Sentences containing a number | 25 |
Most used terms
Filler phrases
32 in total: like 14 · uh 6 · you know 5 · kind of 3 · um 3 · I mean 1.
A literal whole-word count of the same phrase list the Prepublish browser extension uses, so a phrase inside another word is not counted and a phrase used in its ordinary sense still is. It is a count and not a judgement.
Run the check on the words above: where attention is likely to drop, with a rewrite for each weak line. The free check shows the scores and the one issue costing the most.
What this transcript is
Every word below is the caption track YouTube publishes for this video, pulled from the video itself and reproduced unchanged. It is not Prepublish's writing, not a summary, and not a re-transcription: it is the video's own published captions. English captions, generated automatically by YouTube, in the video’s original language. Source: the video on YouTube. A channel that would rather this page did not exist can ask for its removal through the contact page, and it is removed.
All right, folks. Welcome back. All right, so I want to give you a little bit of amplification of what I was visualizing today in price. Uh where some of the levels were derived from, why I trusted certain things versus other things. And if you look at last Friday and you see the low here, that's the low, the lowest low in the last portion of the day. So, here's 4:00 or thereabouts. Okay? And I'm measuring the highest high from the lowest low.
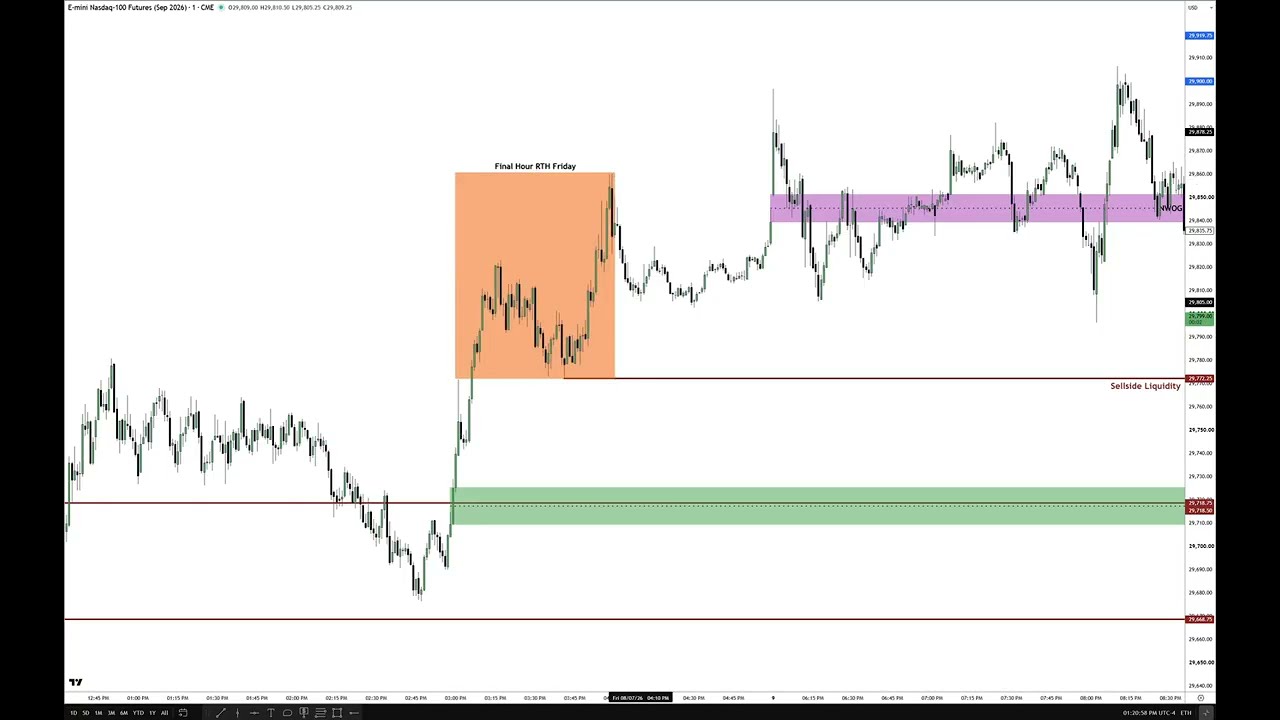
And I'm drawing the fib from the low up to the high. And right on this lower quadrant, 0.75, you can see that this candlestick lays directly on and crosses that level right there. Okay? See that? Right there. Right there. It's a suspension block. Okay? So, that level's important. And the final hour regular trading hours on Friday, it's low. It's lowest low is right here. That's highest high. So, your final hour regular trading hours dealing range is right here.
So, those two reference points are important for liquidity purposes, also for grading and where the specific key turning points may or may not form in Monday's trading. Now, if you look at the economic calendar, we know that we have CPI on Wednesday, PPI on Thursday, and market sentiment and something else. I can't remember off the top of my head, but it was for Friday, but they're medium impact. So, Monday and Tuesday are going to have It It It's more likely that it's going to be reserved.
It won't have that big blast-off type run or sustained price runs because they're holding all the volatility for the CPI number and the PPI number. Okay, so since since they're coming out on Wednesday and Thursday of this week, respectively, one has to consider that when we're taking trades, we have to look for the best-case scenario, but don't demand it. Anticipate the likelihood of the market being held during regular trading hours.
Now, electronic trading hours, here's the caveat. Electronic trading hours tends to trend. And then we go into regular trading hours, and then it tends to go into like range-bound and potentially high-resistance liquidity run conditions. Now, again, why am I saying it's like that? Because we have CPI and PPI high-impact red folder events on Wednesday and Thursday. Now, think about the weekly range. Why should the first part of the week have these big extrapolated moves when all the volatility is going to be held inside of Wednesday and Thursday's price action?
The big flurry of, you know, one-sidedness on price delivery is more likely to occur on those two days. So, when there isn't equal volatility injections in economic calendar on Monday and Tuesday of the same week, why would why would we expect the the market to be wildly trending? But, during electronic trading hours, we can see those types of events. So, what am I saying? I'm saying that during electronic trading hours, London session, the pre-market session leading up to the 9:30 opening bell, those tend to be the trending environments when we have CPI and PPI numbers towards the middle and back end of the week.
All right, so it's since we graded these levels here, show you the business. That green box down here, you're going to see that's the reason why we made our low in the session this morning around that time. And the sell side of liquidity pools here, we have a new week opening gap there. Now, again, I don't have all this stuff on my chart because I like to keep my chart very simple, but when it's time for me to teach you where I'm getting the information from, why I have an expectation of why am I picking that low, why am I liking that wick, and why am I not doing this, and why am I not There's a rhyme and reason to everything, but this is what I'm using right here, okay?
Now, when we scrub through, you'll see that there's relatively equal highs that form right here over the London session. And the opening price here at midnight New York local time comes in again at 29,878.25. So, the market gyrates around and consolidates around overnight and goes into the close of London session. And then we start to drift lower. So, we enter into a period where it is likely to do what? Trend. Because the market's going to be held inside of the regular trading hours.
It doesn't mean you can't trade it. Doesn't mean you won't have this aberration where that's, you know, permitted to trend for a short period of time or one session out of the day, meaning either AM session or PM session, one of the two gets to be trending, but anticipating these things, kind of like preparing yourself for it, helps when the trade that you're in or looking for isn't forced by you. And it's real important to be able to manage those types of things inside you because if you've never traded with real money, when you trade with real money, you're going to find yourself forcing something to happen because you just want to make a little bit of money.
Even if it's 100 bucks, 50 bucks, it then becomes real to you. And you need to realize it's real in in backtesting and forward testing and demo trading. Because if you can't do it there, you're not going to do it with real money. And I mean that sincerely. I don't mean to be ignorant or or talk down or condescending to anyone, but that's the that's the reality of it, folks. All right. So, we have several things in here.
Now, I'm I'm highlighting the first 30 minutes of the premarket session hours. That being 7:30 a.m. So, here's 7:00 a.m. Okay. And then that's the wick high. Okay. And then the first 30 minutes, we have it right there at 7:30. Now, why am I looking at the first 30 minutes? Because I want to see if there's any range that forms and we get one. High, trades down, makes a low, the lowest low since 7:00 a.m. Then we trade all the way back up to almost 3/4, if not 80% of the entire range.
So, you want to grade this level or these levels here based on this price swing from low to high. You can see that's what I'm doing here. See the fib? It's anchored right there to that low. And I'm anchored to the highest high in that period from 7:00 a.m. to 7:30, the lowest and highest range markers are being utilized there. By having these gradient levels and octant levels, we carry them forward and we can see that they are utilizing this right here.
What is this? Buy side imbalance, sell side inefficiency. Is it valid? Yes. So, because it's touching this level and this level, we can carry that forward. Remember this range here, we can carry this through the entirety of the first hour of trading that pre-market session range. So, we have buy side imbalance, sell side inefficiency. And if we're likely to draw back down into new week opening gap, that's this area down here.
It trades here, opens up, trades up into it, and then hits the upper quadrant level, and then closes here. So, the next candle that we would anticipate what? Lower prices. Lower candlestick low, opening price, volume imbalance. It's bullish here. Remember, going lower and validate it right there. That becomes an inversion fair value gap. Why? Because it's on this level and this level. So, it's valid here. Look where it stops.
Sells off, goes into new week opening gap. Rallies back up to what price? Monday's midnight opening price. Okay? If you don't have your opening price toggled and annotated on your charts, I don't care I don't care what you're trading. If you're trading forex, futures, you know, whatever, midnight opening price, you got to know what that is. The market gravitates back up to it and also into the inversion fair value gap once more, right there during a macro time, 8:10.
Look at that, last minute of the macro from 7:50 to 8:10. Then sells off like gangbusters, blowing out the sell side there. And eventually works its way lower down into that session low of the final regular trading hours on Friday. Okay, and what is that again? It's this. Throw back over here. See it? Final hour regular trading hours. That's liquidity. That's key liquidity. How do you know which lows you like to have?
Why do you Why do you think it's going to go there? Why not this one or that one? Cuz it's based on session highs and lows. Because it's based on daily highs and lows. Because it's based on the London lunch range high and low. Because it's uh previous week high and low. It's the highest high and the lowest low in the last 3 days. These are all the things I've been teaching ad nauseam for years. And because you're not trying to watch the videos and you're trying to give me the responsibility of being AI.
Like you're asking me like I'm chat GPT ICT. >> [laughter] >> All right, I may ask chat G uh chat GPT ICT, what is the reason for that that right there when I've already taught it before? If you just simply submit yourself to the content on this video channel and go through it at your own pace, I promise 99.9% of the questions you have are going to get resolved just by going through the process. I'm not going to try to save your time.
Okay, I'm going to do everything as I do teaching normally, but I'm not going to go out of my way and answer every question that's posted to me in my comment section and or X or worst case scenario, if you start texting me um or if you send me emails, I'm never going to get to those. Okay? I'm not trying to save your time. I've done enough saving time by putting the content out the way I did. Okay, it's in the order that I authored it recognized it and codified it.
So, everything up to this point has been released in the order in which I have discovered it in my own hands and then gifted by the Lord with it and that's the way it is, okay? So, there that's the reason why it goes in the in the process and pathway it has. So, the market then just briefly goes below a little bit and then trades all the way back up to new week opening gap and then breaks aggressively lower, trades down into that inefficiency again from last week.
And then and again this is the PM session. Um dispassion block found in at the beginning of the video. Go back and watch the very few minutes and you'll see what this is. Then it rallies up, comes back up into this area. Now, remember I was telling you to watch this right here. I told I was using cuz I felt confident that we came down here deep enough in a discount relative to last Friday's internals. And then now we can look at I don't want to make this video too long.
The inversion fair value gap starts around this basis here, okay? You can see him again all the business in the previous recording I did all the excuses. There's no reason for me to redo all that again. And then we rallied up to midnight opening price, got into the area I told you that those fair value gaps over here, that would be uh bullish fair value gaps here. I told you that again they would act as what? Inversion fair value gaps because we're below them and that would cause problems.
It would get messy in here. Did it get messy? Sure, it did. And it broke lower, ended up getting stopped out and that's fine. Went one more time up in here. I wasn't with the charts at this time, so uh I would have caught this short right there. I would have sold right on that candlestick as it was trying to get up into the middle of this wick. Okay, and if you've been around for a while now, you know that that is something I would have done.
And this would have become a inversion fair value gap. See, and it breaks lower and comes back down into that sell-side liquidity pool. And then right below these relative equal lows, I would have partialed out and then I would have got stopped out on anything trailing. Go back up to the new week opening gap. That's a really nice short there. That's that's handsome. Came all the way down in here. Closed below halfway of that wick.
It means it's likely to take out that low, which it did. And now we're sitting in here. Now, it's in a period and an area where I would not be all that inclined to want to participate in. But look at the day. Okay? As I stated, it can be problematic for traders that are brand new. If you're trying to force a breakout, if you're forcing some kind of a trending model, um you got to just know where the liquidity is or the key inefficiencies.
And as I indicate where they are based on grading, go back to the first 30 minutes. Now, if it wasn't a day like CPI and PPI, uh we could use the entirety of the first hour, not the first 30 minutes. The first 30 minutes is just like a dealing range concept, like 9:30 to 10:00 Eastern time in the morning. That's the opening range for regular trading hours. That that's our first 30 minutes. That's the dealing range. That is the opening range.
Okay, I don't care what anybody else tells you. Okay? That's that's it. It's not 5 minutes, it's not 15 minutes, it's 30 minutes. Well, the first 30 minutes in the pre-market session when it should be permitted to do what? Trend. It goes up into an area where you can sell short. Breaks lower, comes back in. Midnight opening price. And it's at a key octant point 0375. Right in here. Trades up into it there beautifully and then sells off.
Down into our key discount array from last Friday. I watched this. And I wanted to participate in high resistance cuz you learn more from me doing those things. Because you don't know when they're in high resistance liquid conditions and you just want to trade on everything. So by me forcing myself to participate in these types of environments after the easy part when it gets harder I want you to see what it's like even in my own hands.
Trades won't be so perfect. Sometimes you're going to see me getting stopped out. You're going to see me ring in like I did this morning some ideas on how you can mitigate some of that. How you can secure a little bit more of the potential unrealized profit. And also how to kind of like wrestle your your trade psyche when you're feeling the press of the stress and the I guess the opposition to your trades being real easy and running right to target, okay?
So anyway, I think that's going to be it for today. I've done enough satisfied for what I shared and if you found something insightful on this, let me know in the comment section. And until I talk to you again, Lord willing, be safe.
The words are the caption track's own and nothing is reworded or re-transcribed. Paragraph breaks are placed between sentences so the text reads as prose.
Free tools for your own script: paste a draft and see where it stands before you record it.
Paste your draft and see where viewers are likely to drop off, with a rewrite for each weak line.
Paste the first 30 seconds of your own draft for a hook score and rewrites.
Check your draft against YouTube's advertiser-friendly guidelines before you record it.
Read this channel's public videos and transcripts, and download a writing brief for it.