Getting the transcript
Reading the captions from YouTube. A video nobody has opened here before takes 10 to 30 seconds; this page fills in on its own.
Getting the transcript
Reading the captions from YouTube. A video nobody has opened here before takes 10 to 30 seconds; this page fills in on its own.
Ross Cameron - Warrior Trading · @DaytradeWarrior
Where viewers went back to watch this video again, from YouTube's public Most replayed graph, lined up with what was said at that moment.
Most replayed moment #1
8:132.4x the video's typical replay level
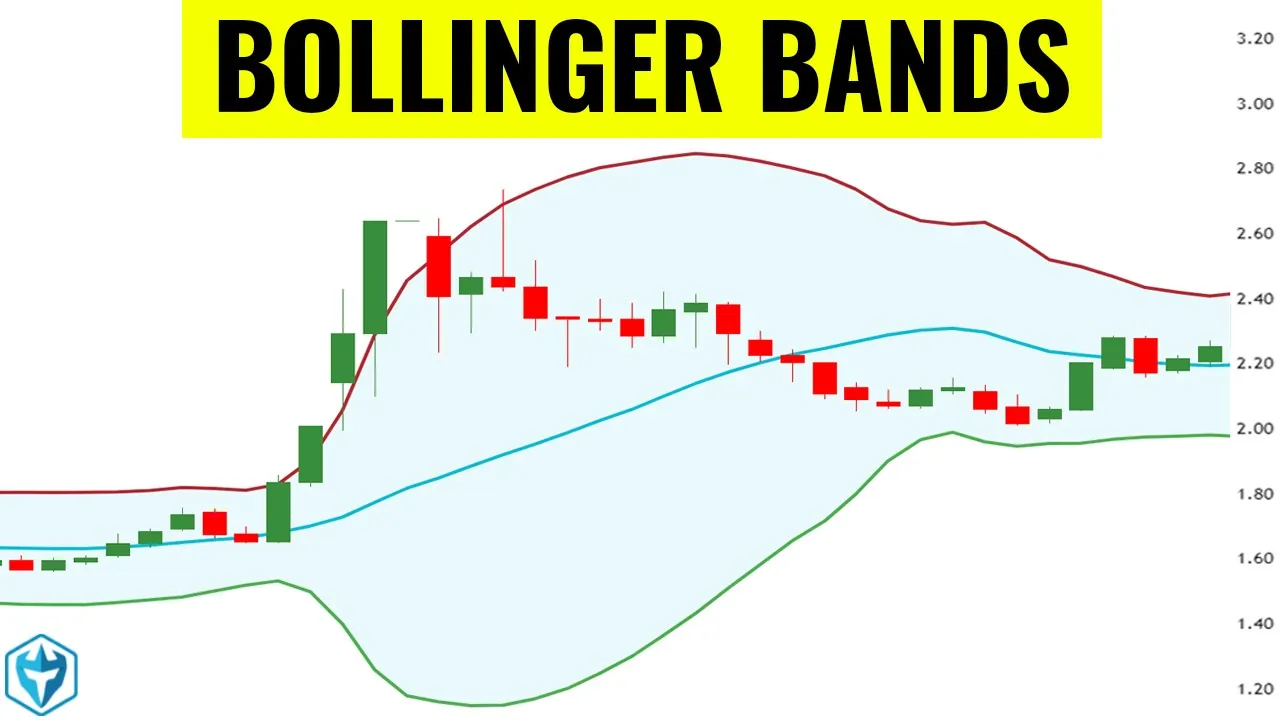
well we've got a couple problems here number one we've got the price which is outside the Binger bands which means it's extended and we've got a higher likelihood of a reversal number two the price is well extended off of the N9 moving average which increases the likelihood of a false breakout and
Said at 8:06
Most replayed moment #2
6:282.0x the video's typical replay level
it did hold for a few minutes and it did make another attempt back up but it ended up being a dramatic reversal this to me was predictable that this would be a reversal because this consolidation was occurring outside the Ballinger
Said at 6:22
Most replayed moment #3
2:591.9x the video's typical replay level
that other people are seeing okay so when we look at this now let's pull up uh full screen five minute chart here's what I look at whenever I see a candle that is fully outside the Binger
Said at 2:51
The graph counts replays. It does not show where viewers stopped watching.
Words
4,599
Runtime
24:54
Speaking pace
185wpm
Reading time
19min
185 words per minute, between the 181 median and the 201 75th percentile of 349 measured videos. That distribution comes from the 349-video hook study.
Opening (first 30 seconds)
[Music] in today's episode I'm going to walk you through how to use Binger bands to help predict when the price is going to reverse Ballinger bands are a technical indicator that you can put on your charts and since they're an indicator they're part of the universal language of the financial markets that is technical analysis what that means is that when a Binger band communicates a buy or a sell signal there are so many other traders that are seeing that same signal and responding to it that in a sense
93 words, the words spoken in the first 30 seconds at 185 words per minute.
Free, no signup. See how the first 30 seconds hold attention, with rewrites.
Sentence shape
| Measure | This transcript |
|---|---|
| Sentences | 1 |
| Average words per sentence | 4599.0 |
| Longest sentence | 4,599 words |
| Questions asked | 0 |
| Sentences containing a number | 1 |
Most used terms
Filler phrases
76 in total: um 23 · like 19 · uh 14 · you know 8 · actually 5 · sort of 4 · basically 3.
A literal whole-word count of the same phrase list the Prepublish browser extension uses, so a phrase inside another word is not counted and a phrase used in its ordinary sense still is. It is a count and not a judgement.
Free, no account. See where attention is likely to drop, with a rewrite for each weak line. The free check shows the scores and the one issue costing the most. Or run it on the words above first.
Free · No login · See a sample audit first if you prefer.
What this transcript is
Every word below is the caption track YouTube publishes for this video, pulled from the video itself and reproduced unchanged. It is not Prepublish's writing, not a summary, and not a re-transcription: it is the video's own published captions. English captions, generated automatically by YouTube, in the video’s original language. Source: the video on YouTube. A channel that would rather this page did not exist can ask for its removal through the contact page, and it is removed.
[Music] in today's episode I'm going to walk you through how to use Binger bands to help predict when the price is going to reverse Ballinger bands are a technical indicator that you can put on your charts and since they're an indicator they're part of the universal language of the financial markets that is technical analysis what that means is that when a Binger band communicates a buy or a sell signal there are so many other traders that are seeing that same signal and responding to it that in a sense it becomes a self-fulfilling prophecy so there's a very clear correlation between a buy and sell signal with the Ballinger bands and then seeing the price react so traders who get really good at recognizing these signals are going to have an edge against other traders in the market and you're the traders who are going to get really good at predicting where the price is going to go next clearly the traders who can predict the future the best will be the ones who are the most consistent in the long run now it doesn't matter whether you're trading stocks Forex Futures you're trading cryptocurrency you can apply Ballinger bands to any Financial instrument where you can pull up a chart so we're going to go over some stocks that I was watching today and we'll look at one of them that I actually traded and I'll help you break down where the Binger bands give you an edge okay so we're going to start by looking at uh CM uh ctmx here this is just a stock that uh is up today about 200% on breaking news which is pretty impressive and you you can see we got this move up here we got a little pullback we got another move higher we got a dip and then notice this false breakout right here what you'll see is that the price popped up and then it rejected and reversed back down now this was somewhat predictable both because of Ballinger bands and a couple of other indicators that I'm going to show you right now so this is the chart without Binger bands on it and now I want to pop the Binger bands on to show you how different it looks so we're going to go over here to um this indicator I'm going to search for Binger bands and I'm going to pop it on right here now when I put on Binger bands the settings that I use are the standard settings I don't edit them in any way here's the problem with editing your Binger band settings if you change them from what everyone else is using you're going to see different buy and sell signals so if you said oh I really want to use a length of like you know 37 and a multiple of two you know 3.5 you're totally changing the way the indicator looks on your chart and now anything that you see is going to be totally different from what other people see so my recommendation is to keep it exactly standard and I do the same thing with all of my indicators whether it's macd or it's RSI I just keep the settings totally standard because I want to make sure that I'm seeing the same things that other people are seeing okay so when we look at this now let's pull up uh full screen five minute chart here's what I look at whenever I see a candle that is fully outside the Binger bands I expect a reversal is coming soon it is an indicator of a reversal it is not a guarantee that we will get a reversal but it is a high likelihood that we will so what that looks like is this candle right here this candle is fully outside the Ballinger bands so this blue band here is the top of the Ballinger band this is the bottom of the Ballinger bands right here and the Ballinger bands depending on your settings may also have an uh an average line that's going to be down the center so you'll have the median line right here you see how it's in Orange so this is the average between uh the two Ballinger bands right in the middle and then you have the upper band and you have the lower band now what some people would do is they would change the color on this and change the gradient to make it um either more difficult to see the price action inside the Ballinger bands or less difficult I think it's fine to leave it again at really this is as you'd like this is more of a visual display but making it a little bit um more contrast I think is helpful for one important reason I like to be focusing on stocks that are either at the moment riding the top of the Ballinger bands right here or are outside the Ballinger bands cuz this is when the price action gets the most interesting when the price comes back within the Binger bands as it is here this is often when we see the stock is going to be choppier we're not going to see clean moves and you're more likely to get caught into false breakouts so the indicator that I look at number one is price outside Binger bands if the price is outside the Binger bands either to the upside or the downside there's a high likelihood that we will reverse soon it it's just the fact is nearly 95% of the price action during the day will occur inside the Binger bands so as you see this is all the price action that's occurring um inside the Binger bands here right we're inside we're inside we're inside so it's a very limited period of time when you're outside and stocks don't remain irrational like this for a long time now there's a saying that they can remain irrational longer than you can remain solvent so just because the price is starting to break outside the top of the Ballinger bands doesn't mean you should sell or go short it just means that we are getting extended and the likelihood and the probability of a retracement and a reversal is now increasing so as we have this candle right here that has the red topping tail it's a red topping tail with this upper candle wick it's a bit of a dogee with this sort of spinning top body right here it's a very small body the confirmation is then when the next candle breaks the low and your stop is always at the high of day so if you had exited this position which you would have been holding let's say to the long side if you had gotten in down here for the red to Green move a proper exit would have been the first candle that made the new low which is right here now it did hold for a few minutes and it did make another attempt back up but it ended up being a dramatic reversal this to me was predictable that this would be a reversal because this consolidation was occurring outside the Ballinger bands and well above the support of the nine exponential moving average those of you guys um so reversal indicators those of you guys who know the way that I trade I like to focus on stocks that are near the 90m and I like to focus on trading when the macd is open or when it's above the signal line and I'll show you that here in just a moment as well so let's go ahead and add macd to this time frame we're looking at a 5 minute chart right now but you can use uh Binger bands really on any time frame the one minute and the 5 minute are both appropriate so macd I primarily use on the one minute but I'll show this to you in any case on the 5 minute all right so we're going to go back to full screen here and what you're going to see is that in this period at the beginning of the move the macd is open so the macd is above o the signal line which is this orange line here we come back down a little bit and we come back up so based on the macd this was open for trading basically from here until here the only problem is you could see right here this is sort of right when the macd was curling against the trade and then we get that crossover right at this big rejection candle so one of the things that is important is using your indicators to help you rule out whether or not you should take a trade so on a position like this if I was watching this consolidation right in this area this is what I would say I would say well we've got a couple problems here number one we've got the price which is outside the Binger bands which means it's extended and we've got a higher likelihood of a reversal number two the price is well extended off of the N9 moving average which increases the likelihood of a false breakout and number three the macd is starting to curl against the trade and number four volume profile shows high volume selling candles both at the open and on this topping tail candle right here for those reasons it would be too risky to take a new position right here and then you know of course as you can see the result was that we ended up getting this um this break where it popped up reversed and came back down and from that point forward this is no longer something I would be interested in trading now some people would have taken this as a short position with a stop at the high and that's perfectly reasonable stop is at the high that's your logical stop right there you're shorting based on the price being extended outside the Binger bands extended off the 9 em and the macd approaching a crossover the the point to cover this position usually is going to be when it comes first down to the 9 EMA then down to the 20 EMA and then down to the volume weight average price we eventually make our way to the midpoint of the Binger bands in this orange line but takes a little bit longer to do that now here we are later in the day the Binger bands have become very compressed they're very close together and the price is trading in a fairly narrow range this can sometimes lead to an expansion where the price will pull away so it wouldn't entirely shock me if that started to happen however from a technical perspective a couple issues we have would be the high of this pivot back here at 522 that we need to cross and then the high of this rejection candle right here so if we can get over 522 and hold that level then the next stop is 568 and then we're back to the high of 587 and that's when we would then look for that secondary move to the upside which would be through Power Hour what you have going for you on this one right now is that the macd is now crossed into the positive but you also have the problem of declining volume as we have come later into the trading session so this is an analysis of ctmx using Binger bands now we're going to switch and look at P pal is actually the stock that I traded this morning which also had breaking news now what's interesting about p is we got this initial squeeze right here on breaking news and then what ended up happening was it basically stalled out so we got a surge higher the macd was certainly open as it surged higher we had a nice big green volume bar but then the following candle was red pulled back and is fully outside the Binger bands that's High likelihood of a reversal it ends up coming back down and as you can see it pulls all the way back down to that nine exponential moving average it then comes down to the 20 moving average and eventually makes its way down to the midpoint so this is again on a 5 minute time frame but you can see how clear it is that those candles were outside the Ballinger bands now if we look at this on um over the course of the day you can see again how in this area uh the Binger bands became very compressed and then that led to a selloff back down so the range became very very narrow and then we broke to the downside which in this case was fairly predictable that if we were going to break one way or the other we would break to the downside because the price was below the volume weighted average price it was really weak it wasn't holding up well overall the stock was showing weakness the macd um at this time right here was actually it was positive and then it it broke to the downside but being below the volume weight average price was really our problem so both of these have been a review on the F minute chart so now what I'm going to do is I'm going to switch this to uh the one minute chart so on the one minute chart I'm going to go ahead and add Binger bands right here the times that I was using Binger bands the most in my career is when I was predominantly trading reversals when I was trading reversals I really wanted to pay super close attention to those candles outside the Ballinger bands to help me get a good indication if we were going to have a reversal so right here we have the initial popup so we have this initial push right here we have a little bit of a a two candle pullback and then we push higher now this is the spot right here where if we had a candle that had made a new low right down here this could have been our reversal indicator right away because that candle was fully outside the B bands but remember this is a caution flag it's not the indicator to sell or go short immediately what you're looking for is the confirmation which is the next candle to make a new low and we didn't get that this candle held and then this one broke the high of this level and so the Bull Run continues it pushes a little higher pushes a little higher pushes a little higher continuing to ride the top of the Ballinger band but because we're at the top of the Ballinger band we can clearly tell that the price is really extended we end up having a small little dogee right here and then the first candle to make a new low is this red candle and at that point it's never able to get back to high a day from that point on for the rest of the day so right there that first candle making a new low as an indicator to sell or or go short depending on your strategy that obviously pulled back down to the N9 moving average then pulled to the 20 and it just kept retracing if we switch back to um ctmx let's see we'll look at this one on the one minute chart this one shows a couple of interesting moments um right here this was the most notable um when we got this extension we got this push higher and you'll notice how sometimes the Ballinger Bands Will compress and then they quickly pull away as it did right here it sort of compresses and then it pulls away so the Ballinger bands are moving on both sides as we're having height and volatility now at the beginning of this move uh let's see back here we were riding the top of the Binger band we pulled back but we more or less went sideways we finally got a candle that made a new low but by that point we were already at the support of the nine moving average so that's not really a good short because you're too close to support it ends up grinding a little higher pulling back coming up again pulling back a little bit more selling off and then doing this uh red to Green move so we get the red to Green move and all of a sudden from here it's back to the top of the the Binger bands top of the Binger band a short-term reversal here back down to the nine moving average sideways sideways and then a spike back up sideways sideways and now it starts to really punch higher little micro pull back it pushes even higher even higher now we're up outside the Binger bands and this gives way to a bigger reversal right here coming back down support at the N9 moving average then support down here around the 20 all right so you know this is the um these these are a couple examples of reversals where we were looking at the move to the top side um smci this is one that gave us a move uh to the downside so let's look at this one for a second okay so this is an after hour selloff here so first you have this massive moment of volatility way above the top of the Binger bands right here the price squeezes up way above it and then a rapid reversal all the way to the bottom outside the Ballinger band and a retracement back up so it's like these these Ballinger bands think of them as rubber bands and when they're really stretched out when the price is at those extremes it's increasing the probability that we're going to have to snap back and when we snap back our Target is volume weighted average price but naturally because we've got a couple of other indicators coming up to us in the way we first look at the nine the the 20 and then we look at the vwap so I'm going to get my drawing tools out here so we've got the Binger bands right here we've got the volume weight average price somewhere in the middle usually something like that we've got if the price is up on the on the upper side we've got um the nine moving average up here and then we would have the 20 right in here just for instance so when the price is up here our first Target when we're getting a reversal would be support at the nine then support at the 20 and then support at volume weight average price if we were trading below so let's see so this isn't going to be exactly perfect but we'll just do it anyways so if we were below like this the price was down here we'd been selling off so we had a candle where we dipped below the bottom then we're looking for that bounce back up here first level of support at the nine second or resistance second level of resistance at the 20 and then ultimate Target back to vwap and vwap right here that's when the rubber band is basically slack that's when you're back to the equilibrium point for the day so here on smci we end up um seeing the price come back to equilibrium and then roll over again and it starts to go lower and it goes lower lower and lower and you see these dois this type of dogee here down there that is like a classic reversal indicator classic reversal indicator dogee at the extension of the move because what this is communicating the dogee candle is communicating the battle between buyers and sellers right the price opens it spikes up it dips down and then it bounces back and closes like that so it's a tug-of-war and when you have this in the context of just having had a long period of selling off this there was very clear Market sentiment it was weak a ton of weakness now right here it's showing a sign of strength the fact that there was enough strength for it to Rally off the low and come back up here and even to bounce up here this is showing that some strength is coming into this candle so dogee is a candle of indecis when you have a dogee candle that occurs when the price is outside of the Binger bands that is amplifying the likelihood that we're going to see this reversal and the reversal is of course we're going to come back to the 9 the 20 and the VF now increasing the likelihood of the reversal is when we're extended off our 9 EMA and when the macd is closed or closing either one closed or closing is going to increase the likelihood of that reversal back in now in my day-to-day trading I have gotten to a point where I can pretty well visualize whether or not the price is outside the Binger bands without actually having them plotted on my chart because I can just recognize that the stock is extended so when I see an extended chart I see that we've got this like really big move we're really stretched out I'm already thinking the prices outside the Binger bands without needing it on there now getting to the point where you can visualize that without having the indicator it's going to take some time and similarly if we look at cmtx um or sorry it was um ctmx if we look back at ctmx traders who have been in the market for a long time will get see there we go it's starting to pull away traders who have been in the market for a long time will start to recognize a pivot like this one here at 522 and you may not need to draw it because you just are able to visualize oh it's right there so that's going to be an issue we're going to run into that but as a beginner Trader it's a great idea to draw these trend lines because they're going to help you just better visualize the price action and better understand areas where we might see possible levels of resistance so you know if that's one maybe you know something like that something in that area so then as this moves forward you would say all right well when it comes back down here I'm going to look for this bounce off this ascending support line so the more experience you have the more second nature it becomes to be able to visualize and predict when the price is outside the Ballinger bands and actually the um just as it it broke there we got up outside the Ballinger bands and then again because of this issue with this resistance here at 522 and the time of the day you know the volume on this candle right here is a fraction of the volume we saw earlier in the day so if we're really going to make it all the way back up to this level presumably we would need more or less that same amount of volume but that's not likely to happen when you've got 15 to 20 minutes to the closing bell right because it's now later in the afternoon so this is a higher likelihood of a false breakout right price is outside the Ballinger bands the volume it's a little a little light and you've got some resistance coming back up here one thing that I would caution is adding too many indicators to your charts because if you had too many indicators you can fall into this pattern of analysis paralysis right your charts just start to get so busy that it's hard to really see um the woods through the trees so to speak and if we go in here um you can see all of these different indicators that you could add and when you start adding a lot of these your charts can get really really messy so when I'm thinking about some of the most essential some of the most valuable indicators these are the ones that I'm thinking about and I'll give you a little list right here so Ballinger bands so we'll say and this isn't in any particular order so Ballinger bands macd RSI relative strength index um EMAs and smas moving averages um so moving averages uh and exponential moving averages and volume weight average price these are these are probably the most essential that you're going to see on most charts now some Traders are going to start searching for the Holy Grail and some of you know exactly what I'm talking about you're searching for an indicator that will give you 100% accuracy so you'll never lose money but let's let's get real trading carries risk and you will have losses even the most successful Traders lose all the time I have over $12 million of gross profit and I'm wrong 30% of the almost 32% of the time so you don't have to be right all the time but you have to get good at cutting your losses and you want to make sure that generally speaking your winners are bigger than your losers using techical indicators can help give you an edge because they help you better understand what type of setup is a quality and which ones are like B or C quality so when you're looking at your indicators these help either confirm or sort of deny whether or not the setup is valid so in the case of um ctmx right here it wouldn't have been hard for me to talk myself out of this trade based on the position of these indicators however if you have 25 indicators that you have to review every time before you take a trade you're going to start getting conflicting signals you're going to get analysis paralysis and you may find yourself Talking yourself out of too many trades and missing what could have been some really solid opportunities now if you want to learn more about technical analysis I will put a link down below pinned to the top of the description and in the comments where you can download My ultimate technical analysis PDF it's a document that you can download you can print it out can have it next to your trading station and it's going to walk you through all of the indicators that I like and it's going to break down uh several Candlestick chart patterns that I rely on in my own trading so if you found this episode interesting I hope you hit that thumbs up and I hope you subscribe to the channel for more episodes about trading strategy just like this [Music]
The words are the caption track's own and nothing is reworded or re-transcribed. Paragraph breaks are placed between sentences so the text reads as prose.
Free tools for your own script: paste a draft and see where it stands before you record it.
Paste your draft and see where viewers are likely to drop off, with a rewrite for each weak line.
Paste the first 30 seconds of your own draft for a hook score and rewrites.
Check your draft against YouTube's advertiser-friendly guidelines before you record it.
Read this channel's public videos and transcripts, and download a writing brief for it.