Getting the transcript
Reading the captions from YouTube. A video nobody has opened here before takes 10 to 30 seconds; this page fills in on its own.
Getting the transcript
Reading the captions from YouTube. A video nobody has opened here before takes 10 to 30 seconds; this page fills in on its own.
The Inner Circle Trader · @InnerCircleTrader
This video has no Most replayed graph yet: YouTube shows one only once a video has enough views. These are the moments viewers replayed most in The Inner Circle Trader's most watched videos.
Most replayed moment at 51:50
3.7x that video's typical replay level
Okay? So, now we have two points of reference. Now, when I have this like that, I have two little sweet spots in the previous day's range and to the left of that, why? Cuz we're going to go back 3 days.
Said at 51:44
Most replayed moment at 12:06
4.1x that video's typical replay level
So we have relative equal highs during lunch macro, 11:30 Eastern time to 1:30 p.m. Eastern time. The setup usually forms in the first hour of that 2-hour lunch period. Okay? So between 12:30 noon
Said at 11:59
Most replayed moment at 10:06
3.2x that video's typical replay level
towards that of this buy side imbalance or side inefficiency, which is a suspension block, which has a volume imbalance on the high end and a volume imbalance on the low end. All right, so let's move into the lower time frames now. So, we're at a 1-minute chart.
Said at 9:58
The graph counts replays. It does not show where viewers stopped watching.
Words
5,732
Runtime
34:29
Speaking pace
166wpm
Reading time
24min
166 words per minute, between the 160 25th percentile and the 181 median of 349 measured videos. That distribution comes from the 349-video hook study.
Opening (first 30 seconds)
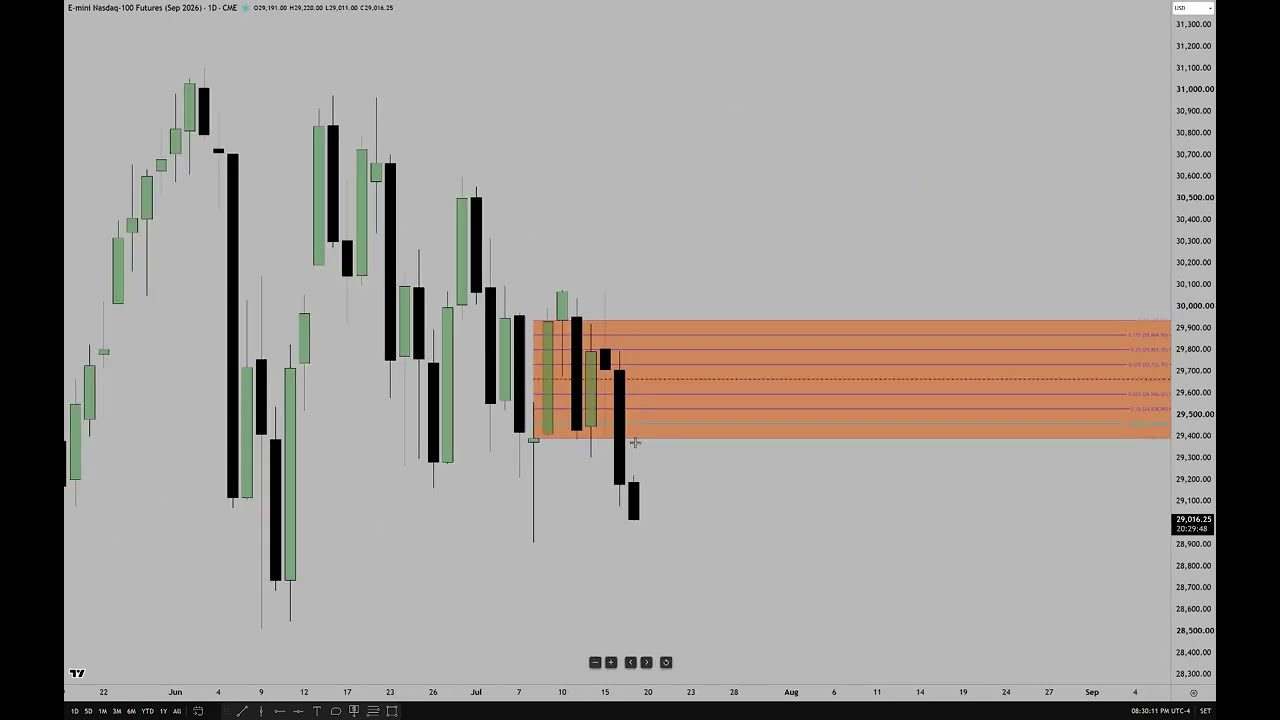
All right, folks. Welcome back. So, we are going to do a brief review. I'll try to be as succinct and to the point as I possibly can. All right, so here's the daily chart and as you may recall if you kept notes in the lecture I gave yesterday, I mentioned how we were likely to continue going lower uh because we had this volume imbalance right here. We closed down below that. So, that really bolsters the idea of seeing lower
83 words, the words spoken in the first 30 seconds at 166 words per minute.
Free, no signup. See how the first 30 seconds hold attention, with rewrites.
Sentence shape
| Measure | This transcript |
|---|---|
| Sentences | 492 |
| Average words per sentence | 11.7 |
| Longest sentence | 58 words |
| Questions asked | 53 |
| Sentences containing a number | 29 |
Most used terms
Filler phrases
94 in total: like 32 · uh 23 · you know 13 · um 12 · kind of 7 · actually 3 · I mean 2 · right? 2.
A literal whole-word count of the same phrase list the Prepublish browser extension uses, so a phrase inside another word is not counted and a phrase used in its ordinary sense still is. It is a count and not a judgement.
Run the check on the words above: where attention is likely to drop, with a rewrite for each weak line. The free check shows the scores and the one issue costing the most.
What this transcript is
Every word below is the caption track YouTube publishes for this video, pulled from the video itself and reproduced unchanged. It is not Prepublish's writing, not a summary, and not a re-transcription: it is the video's own published captions. English captions, generated automatically by YouTube, in the video’s original language. Source: the video on YouTube. A channel that would rather this page did not exist can ask for its removal through the contact page, and it is removed.
All right, folks. Welcome back. So, we are going to do a brief review. I'll try to be as succinct and to the point as I possibly can. All right, so here's the daily chart and as you may recall if you kept notes in the lecture I gave yesterday, I mentioned how we were likely to continue going lower uh because we had this volume imbalance right here. We closed down below that. So, that really bolsters the idea of seeing lower prices.
We have this sell-side liquidity and look at these relatively equal lows here. Okay, so keeping I guess the idea that, you know, we could eventually gravitate below that low. It warrants at least focus there for tomorrow. Uh but it is Friday. So, just be mindful that and if we pick up momentum below here, this is what we'll likely get. And if it doesn't get down here, but we get significantly below this low, we could get like a gap lower opening on Sunday that may see it go below here.
So, it's just a couple scenarios in in concert with what I've outlined uh for this week and what we said we would likely see yesterday and now we're seeing it come to pass. So, let's add some lipstick on here. We have this area over here. And notice that on Wednesday, we opened, we swept above its consequent encroachment. And then let me see if I can just know that this is an inversion. I'm going to make this a little bit different in contrast and color so that way it stands out against that orange casing.
Now you can see that line. The wick goes above it, but the body we closed down right here. And we open traded up into it there and broke down. Now, we were inside of this here. So, as I was talking about it nauseam over the years while teaching, the surest sign of probability being high is if you have something that's anchored to a weekly chart or a daily chart, some key level, some specific draw on liquidity where the market may be pulled to.
And by having that anchored to one of those two time frames, that again being like the weekly and or at least the very minimum daily, you can't really say that you have high probability behind your idea. That's my opinion. You're welcome to disagree. I don't care to see any comments saying that you disagree. I don't care. Um I'm not here to learn. So, by having the movement below this wick here, where we're at. Okay, so here is that's where the encroachment of that or below that now.
So, it's it looks like we could potentially get down here. Now, the only way this changes the bullish for me is we have to take out the open on this candlestick yesterday. Or I guess quote-unquote today still for my local time, but we're in new trading for electronic trading for Friday. So, this is Friday's trading. It's not Friday yet where I'm at, but it is what it is. So, now we have these levels here. I'm going to drop down into an hourly chart and I'll show you something.
All right, so we have that secondary inefficiency that isn't shaded in that dark red. I changed my contrast. So now you can see this is what we're looking at here. And it's being applied to the hourly chart. And right here, right there. You see that? That candlestick's high, that candlestick's low. That buy side imbalance sell side inefficiencies from Wednesday at noon Eastern time. See that? During the recording of my execution this this morning, uh I barely got online just to get it.
Like I I wanted to trade in the first percentage of fair value gap, which I'll show you in a moment what that is. That would have been the better fill. I would have built a larger position and then pyramided in the area where you actually watched me take the initial entry short. But it is what it is. Sometimes you just you can't be there when it needs to be done. All right. So, we we gravitated down into that here. And then retraced back up again, and then now we're down here.
Okay, so just pay attention to the old man. The old man's trying to keep you straight and narrow. Okay? Told you we were going to likely go lower yesterday and there it is. Uh which brings me to a point I want to make. And this is not to like get all get people all bent out of shape or whatnot. Um I was in one of my students' live streams this morning. And I was watching them. I have to be careful cuz I don't want to draw too much attention to it.
N- The only because I don't want drama brought to their channel. But the uh the viewers were insisting that the student of mine should go long. And they just kept saying that going long is the right way. Don't be short. Don't go short. Don't go short. And they were saying that there was relative equal highs and I was watching this and I thought to myself I know what they're looking at. Okay, they're looking at this high here and this high here and they're viewing that from the perspective of it's relatively equal highs and they're going to draw up there and get that.
Cuz it was showing an unwillingness to go above. I'm trying to go to go lower in here. And the student was trying to trying to get short and it was it end up hurting them. Well, then they went long. It was after a comment I made. I said that I feel that 29,538 which is one tick above this high here, that buy side is sus. Okay, in other words, I don't see that as a draw. It's there as relatively equal highs, but I don't see that as a draw.
So, it's suspect. I I don't think that's likely to happen. And the student got messed up here. They got excited about it being short-term profitable, but it was unrealized cuz it went and melted against them. And admittedly, it's very difficult for me to not want to say reverse your position, but if I do that, then then I end up managing their trade. And it it teaches codependency and I don't want that. I don't want you to be tethered to me, okay?
So, I I'll say this. When I look at other live streamers and some of them are students of mine and others are not students of mine and some of them are just don't they don't have any affinity for what it is I teach or or me or, you know, they like to find things to say trolling me whatever. And that's fine. It keeps me relevant. They don't keep talking about me. But the idea of following their chat and when they start cheerleading the live streamer and I know that that live streamer is offside or they're doing a position that's correct and there's a lot of chatter in the chat saying that they shouldn't be in that particular direction and they should be aiming for something the opposite.
That's how I use YouTube. That's how I use it. Otherwise, it's you know, for trading it's comedy. I'm looking for this increase in emotional stimuli when they're trying to correct the person that's actually doing it live in front of them. Which takes a a great deal of moxie. Uh we'll just say it like this. It takes balls for you to talk from the safety of of the sidelines and anonymity trying to tell someone that they're wrong and they should do it the other way.
And I see a lot of that. And when I am looking for a particular trade and I see live streamers chats going off in the other direction and they're getting very like animated about then I know I'm I'm really going side because 90% of the time the public's wrong. They're either chasing price or they're looking for some kind of a breakout. Okay, so um I'm just going to toss this out there. If you live stream, ignore your chat.
Just ignore them. They're going to watch you anyway. Okay, they're going to watch you. They're going to wait for your handouts. They're going to do all the things and if you dress a certain way, they're probably going to watch you because you're eye candy and all those things are are okay if that's what you want to do. I'm not going to give judgment on that, but just ignore your chat because they're many times the best sentiment indicator.
And when things are lining up where it's one-sided, and let's just go with the logic I told you yesterday we're going to go lower. I told you yesterday. Okay, so when I popped online, I I saw that we had already ran up here with a Judas swing. Right here is 9:30's candle right there. Okay, so there's 9:30's open. We rally up and we're hitting a level that is kind of like obvious if you if you're looking at imbalances and inefficiencies and you grade them the way I teach.
Um but if you look at it from this perspective, we have that line right there. Follow that along. I see it. See what it's doing here? See that? Right there. Let me take this off just for a second cuz it's probably confusing you. Let me take that off. Okay, so now we're left with the low of that inefficiency on the daily chart. Then we have a octant and then we have the lower quadrant and it trades right up into that.
Isn't that interesting? That's the high of the day. But they're going to say there's no algorithm. I would have shorted that if I was right in front of the charts. I would have You can clearly see what I've been doing this week. I have no problem getting in there and nailing the high and nailing the lows. I can do a lot of stuff, okay? But if I'm not in front of the chart when it happens, then then obviously I can't do it.
And it's not because of lack of ability or lack of trying. It just means that I just wasn't in front of the charts at the time. I know it's surprising to some of you that I I actually do live a life >> [laughter] >> and it does get in my way sometimes with with teaching and trading. So, on the 9:30 candle, right here, we trade up to that and I'll show you the full range so you can get a feel for what it is I'm showing you.
Okay, you see that? This is that darker one on daily chart. Now we we're going just for a moment so I can use the importance of it up and then delete it from the channel. Or not the the channel but delete it from this chart. See how we worked overnight? 1:00 in the morning, 1:30 in the morning. We're up in here in the upper half of the darker shaded one. I'm going to just highlight this so you can see it. Okay? And then we worked aggressively lower.
And then once we left this one there, we were just using it as a kind of like a a premium array. But then we have to blend this upper range. Okay? This is a shadow where it's a blending of two inefficiencies which I just taught I believe was last week. Now we're going to take it off. Now it's the lower one on daily chart. So when you all ask me, "What's on your pad? Can you show us your notepad? Like what what are the levels you're looking for?" All those types of things are >> [sighs] >> like this.
And the quadrant levels and the octants. And I may have a little notation as to what time that it formed a very key octant or quadrant level. And then I use that information when I'm watching live price action. So I can look at a naked chart and just glance at my notepad and say, "Okay, I'm I'm heading towards this particular octant. I'm heading for this particular quadrant of an inefficiency or a old pool of liquidity or a old daily high or old session low." Something to that effect.
There isn't some super science secret thing I'm hiding on the notepad. It's just some things just have to be kept personal. Okay? And private. Not because I don't want to teach it to you but you know, I I I like to have something that's mine. You know? I I I don't want to give you everything. I don't I don't let you read my diaries. I don't let you read my journals. Okay, they're they're private. And I record things that I think are just important and pertinent to me.
And by you not ever seeing these things doesn't weaken your ability to do what I teach. It doesn't have any bearing on it. So, if you're a person that's obsessively compulsive and you feel like you have to have that. Do yourself a favor and wrestle through that and just acknowledge the fact that I'm telling you you're never going to see that. Okay? You're never going to see it. But, I'm telling you what I am writing down.
But, if I write these things down and I show them to you on a day-by-day basis, you're going to try to build a model around the notations that I'm writing down. And it's going to be a distraction. It's going to make you chase things and you won't develop. You won't have your own unique organic experience creating your own model. And that's what I'm trying to cultivate in you as a student. So, anyway, we we gyrated around in here around the consequent portion of the lower daily inefficiency.
That's this one that's shaded here. And we rallied up. We failed to get to the upper quadrant. Worked lower. Failed to get to consequent encouragement there. Traded down and then we had this rally up. This is that 9:30 open. Okay? And it hit the lower quadrant of that daily inefficiency. Okay? And let me show you what it is again on the daily chart just so that way you guys know what I'm showing you. It's this one here.
Okay? That's what we're looking at. And this octant this quadrant. Okay? That's what's being carried over into the daily chart. Now, to show you, I'm just just going to change this to yellow. So, that way you can see it is in fact what I'm showing you on the on the 1-minute chart. See? That's what happened here. And it hits that lower quadrant. But it's because it was formed, its original utilization was buy side and sell side inefficiency in the form of a suspension block.
So, it's characteristic if the market was bullish when it traded down into on the daily chart, it should propel price higher. But we've wilted and went through the lower end of it, okay? So, we're we're in the we're in the lower thresholds of that. And we're trying one more time to mount an opportunity to go higher, but it fails to do so. At 9:30, hit it. I would have shorted that right there. On first touch of that, I would have been all over it.
Right there. I would have nailed that. And then I would have added more in here. And I know sometimes when you're brand new or you haven't been around and watched how the old man executes on his trades, you you listen to something like that and you're thinking, "Yeah, right, buddy. Hindsight here again, right?" Um but I think I've earned the right to be able to say that because I've done many executions and explained the stuff in advance where it's going to go and then showed you how I glad-hand with price at the right time.
And it's just brilliant delivery. And you know, authorship grants me that. But the the drop here, look what happens. We get the first displacement below that low. And this is first incentive everybody got. It's first utilization is what? Bearish. So, if it comes up into that, we were banging around in here, going crazy. And when we get closer to the 11:30 time. Right here. This is where the lunch macro tends to have a strong effect.
And you'll see the pullback into a higher low that formed at 10:00. Okay, we'll go over that in a second. But here, I want you to see what I was looking at. Because we hit that level up here. Now, I'm going to take the uh fibs off because it's already accomplished the method. And I'm going to take that box and range off. So, now you know what this was. That was the daily suspension block. It trades up to its lowest quadrant.
No extra stuff. No No gimmick things. No candlestick uh look inside the candlestick and see what orders were bought and sold or We don't need to know all that. Okay? Um on the hourly chart, when it was trading up here, because I saw everything naked, I had to draw this out on my phone. That's why you're watching the recording. This populates without me moving my mouse cuz my mouse is sitting up here like this, like it always does, showing you that it's not market replay.
So, I'm trying to hurry up and get the the drawing to appear over here cuz I'm managing it from my phone. So, everything I do on my phone will populate on the chart while I'm recording the execution. A- Again, showing you that it's not 17 laptops because whatever annotation I would make on one is going to populate on all of the the charts I'm looking at. Okay? So, unless I don't have it showing on the uh the specific time.
Sometimes you got to go in the settings and show visibility, okay, on this time frame, but not another time frame. But I wanted you to see it appear, and I drew out the 1-minute Bissy, buy-side imbalance sell-side efficiency, which we showed on the hourly chart just a little bit ago. And then I annotated showing you what it was anchored to and where it came from. That's Wednesday or yesterday's 2:00 p.m. Eastern time 60-minute or 1-hour buy side imbalance sell side inefficiency.
So, I'm framing two points of reference. Premium, which was the lower quadrant of the daily suspension block. And then down here. Okay? I was off cuz it went one more time lower than that. Okay? And I I read that wrong. Um I wanted to see it because we had this little bit of a close below the midpoint consequent encroachment level right here. See how we closed just a little bit below the midpoint line. I felt confident at the time that where I had my stop, it would get close to it but not not take it out.
But it ended up going there and went a little bit higher and then one more time wiped out that low. So, you know, it is what it is. Um it's user error and I just read it wrong. But the market then traded back up through and back up into first presented for everybody got it. Spent a little bit of time in here. This is time distortion. And then we wait for this false run here. And it was right at the same time where everybody in the chats that I'm watching, they're all saying it's a bull flag or it's going to continue going higher.
It's, you know, it it it's failing to go lower so it's going to go up here where these highs are. It's going to take out the the 9:30 high. Okay? Everybody in retail chat was at this moment saying it's going to go higher. And I posted in a student or I mean Uh I'll say it, who cares? I posted that uh that 29,538 uh buy side is suspect. So, it's it's not likely even though you see it as relatively equal highs on the chart.
Like that. It doesn't mean it's going to go there. Why? Because the the market's weighted. It's going to be heavy. Okay? And this is all outside the scope of this Everybody got this bearish. So, how do you get back in sync with it? Well, you got to give it a chance to take out buy side here. And then once we close below it again, that resets first utilization. That's the part where you write that down, folks. Okay? First utilization is when a PD array forms.
We went below this low, it displaces below that low. That validates this as a bearish breaker. Okay, so you have several things here. And then we're coloring outside the lines. So, you don't do anything with this inefficiency because we're bearish. I told you yesterday we're going lower. So, this has to be recalibrated to swinging back in sync with looking for lower prices off of it and acting as a premium array. The way you get that information and it validates it is you have to submit to sell yourself to time and wait for a close below it like it does here.
After it takes a short-term pool of liquidity that's opposing it, what would be that? That's this high here. So, that's a turtle soup. It validates this and puts it right back in sync as in play. That it's going to be used as a premium array. This is a mohawk. We already know that that's permissible, but look what's going on. We're going up in here. We got a little bit of body above the midpoint and then we get this little bit of wick.
As soon as it does that, when you see these candlesticks right here, it's the same thing that's occurring down here. See how the bodies were just below consequent crush with the 1-hour busy? You I I took the the two position two contracts off of the three contracts I had on in my fill. And I'll show you in a second what that was. But just let me make sure you understand what I'm showing you first. Um then cuz I got stopped out here on the single contract that was remaining, I I closed right at consequent encouragement.
And then I got stopped right in here. Then we wick down through these candles that were just below consequent encouragement. When you get this and it becomes a wick and it reverses like that, usually it's pretty significant run. Same thing's happening here. Body's just above the wick I'm sorry, the consequent encouragement. Then we wick above it and move outside of it again. Guess what that means? It's going to go lower.
And we see it do that. It goes lower into the first inefficiency I annotated for my short. Like I couldn't get in here cuz I wasn't in front of the charts. I would have went in this one with additional entries if I was able to be in front of charts. I would have shorted here. I would have pyramided here. And I would have pyramided in here. And then I would have wrote it down like you saw me do this morning in the next execution.
Uh by the way, the video was silent. That's what I mean by I'm I'm moving in silence. Like a shinobi, a ninja. Um not talking, just letting my actions speak for itself. And the only little annotations here, even here, I don't care what your language is. If you just make this and type it out into a translator, you'll know what that means, okay? And you don't really need to see what it says cuz you're watching me show you on the chart.
So I kind of like want to move in that direction. Like I want to have a playlist where I'm not talking. Like I just want to execute and let you guys see the poetry in motion. But you know, that the old man, you know, putting it to task. And I'm sure there's going to be people that's going to complain, but I can't make everybody happy. So we moved lower here, validating and setting things back in motion for this to be a valid bearish first presented fair value gap.
We get that wick and rejection away from that. Okay, so now it's done deal, okay? All things need to stay below. Consequent encroachment of first percentage for everybody got. Body stay below. Wicks it's fine, but look what time it's doing it. When lunch macro should begin to start pulling back down into what? A 10:00 low. 10:00 is there, so there's your low. So lunch macro is going to target this low. Okay? We get it right there.
Beautiful. Here, what I saw was it was trading down like this. I'm like, okay, I see this. I know I'm going to get an entry in here. Where I'm going to fill in at that short, I don't know. But we're going to show you here. Okay, so I'm going to hover over top the area. You can see my entries right here. See that? After it goes up there then I'm catching it on the way down. Right there. I was trying to time it where I could be right there at consequent encroachment or just above it.
It's that way I'm kind of like in a technical premium inside this gap that I think is going to be inefficiency or uh inefficiency, but um inversion for everybody I got. Market moves lower in here. Could have took that, but I was just using it as validation that if it goes up here and wicks and doesn't want to overcome this low that's fine. And the low on that candlestick comes in at 29,373 and 1/2. So 373 and 1/2 and the high comes in that 375.
So that's immediate rebalance. It's it breaks lower and then right in here but look at consequent encroachment right here. Okay, this is the consequent encroachment of 1-hour buy side imbalance, sell side inefficiency. If your head's spinning right now, I promise I'm going to make it real easy to understand in a moment. But, I'm closing that out as it's hitting down as current encouragement, and then I'm stopping on the stop loss that I put just at this candlestick's open.
Okay? So, I felt that if it was going to go there, it warrants me being out. I don't want to hold on to any more risk. It goes up a little bit and then slams back down through here, and then there you go. So, this is a hangman. I know these crazy names, right? A hangman is where we have the guys who are on the the platform. It's No, it's not the gallows. Okay, it's not a gallo. But, it's the same kind of premise where it's I'm using that thought process where they're they're getting hung.
So, anyone that was going long here, they get stung right there. So, they're getting dropped and the the noose is around their neck, and then you're gone. And then it reverses. Same premise here. The bodies are just above consequent encouragement, which would indicate what? Continuation is likely, but then we move back down outside of it. Okay, like lower. Why? Because it doesn't give it to it. It just goes up there, wicks past it, and then rejects.
So, it's kind of like the horse being smacked when the guy is hanging his head in the noose, and they say, "It's your time." and smack the back of the horse, and it runs away, leaving the guy to hang himself. Okay? Well, he's not hanging himself, he's being hung. So, that's the that's the hangman. Okay? This little wick above when the criteria is the bodies are suggesting maybe continuation, but then we get this. Then it's done.
It's over. You don't need a Steve Neison type thing. It's not a a doji, it's other logic being there. Okay, there's lots of times you'll see supposed dojis like this. It had no bearing on moving lower. It It just means that there's a wick there and you can use that for discount sensitivity and look for it to go higher while inside this candlestick. So, anyway, that's another discussion for another time, but I figured I'd give you another PD array.
And uh I ended up because I got these two contracts lower where I had initially put my exit at at one of the limit, which was just targeting right below low here. That's sell side and then the the relative equal lows here. This This line can be deleted now. And then this sell side line can be deleted. >> [sighs] >> And then in the afternoon uh we have the lunch macro. So, 11:30. There you go. And then market trades back up in the first successive fair value gap.
The bodies can't touch consequent encroachment, which is wonderful. And then we go into again that gap and it performs the same way. The bodies can't escape it, but the wicks are allowed to do the damage straight up into fair value gap. Breaks lower, uses the midpoint or consequent encroachment that lower gap. And now we pull down into 10:00's lunch macro. We went through it and then went lower as soon as we have this close below here, again, assuming we don't get that wick down through it, um it's likely that it'll keep keep going lower.
We move around in here. We don't get any wicks to take that out. Tries it making an attempt to go higher. This is all time distortion. Market trades lower to the low of that 1-hour buy side imbalance sell side inefficiency and comes right back up in. Now, look what the bodies are doing. Now, retail Rick is going to see this as a bull flag. They'll say, "Oh, it's going to keep going higher." He's going to take these relative equal highs out because they want to be a contrarian.
They're fighting the the higher time frame order flow, the real order flow. And then, the bodies are telling you, "No, it's not it's not going to go higher." Because we we wick through this upper quadrant of the 1-hour buy side imbalance sell side inefficiency and you find that at 60 minutes on Wednesday at 12:00 p.m. Eastern time. It's telling you it's going to go lower. Remember, the wicks do the damage, but the bodies tell you the real story, the narrative, the real volume is shown in the bodies.
Okay? That's what the algorithm is designed to do. That open and close is the most important two prices you're ever going to have. If you didn't write that down, you missed it. Breaks lower and then we have this buy side imbalance sell side inefficiency. If price is weak, this should act as an inversion fair value gap. Well, lo and behold, what we have right here, the bodies are stopping below. Can't even get to the midpoint.
Is that bullish based on what the old man says? Well, Michael says that's bearish. And the market breaks down, comes right back up to the low of this inefficiency and breaks and falls out of bed. From comes right back up, touches the low of that inefficiency one more time and it's happening at 4:00. And then, we went into this bit of business and we have new day opening gap. Sell side is right below here. We went through that.
Relatively equal highs formed, broke through, and now we're down here. Uh the next bit of business is 28,009 09.75. So, it could happen you know, during uh Asia tonight. You could do it in London. It could retrace and come up here, knock out these highs, and then go for it in tomorrow morning. Uh either way, that's the next significant pool of liquidity. Uh if it goes down here, then I'm content. I'm not interested in looking for anything else or calling anything.
Uh I think I've had a really good technical week with you all. Uh I showed a lot of things, and you watched it come to fruition. I did a lot of executions. Not a lot, but I did a I did enough executions based on the things I was telling you that the market should do or shouldn't do. And that should be an encouragement to you. And if it wasn't, you know, it's because you haven't been around long enough to recognize what you should be impressed with.
The algorithm is impressive. The precision is impressive. The details and the logic that I'm teaching, the language that I'm teaching you, so that way you understand what I'm speaking, once you get that, things will start happening quicker. And the only way you learn the language is by the sys- systematically placing yourself in the lectures and listening, watching me cover because the logic is not changing. Okay? I'm not I'm not twisting and contorting the the logic and making it different all the time.
I may be teaching things in greater detail and depth, but the logic still remains. And it's up to you whether you're going to put the time in. If you don't, it is what it is. But hopefully this was helpful to you in type one until I talk to you next time, Lord willing. Be safe.
The words are the caption track's own and nothing is reworded or re-transcribed. Paragraph breaks are placed between sentences so the text reads as prose.
Free tools for your own script: paste a draft and see where it stands before you record it.
Paste your draft and see where viewers are likely to drop off, with a rewrite for each weak line.
Paste the first 30 seconds of your own draft for a hook score and rewrites.
Check your draft against YouTube's advertiser-friendly guidelines before you record it.
Read this channel's public videos and transcripts, and download a writing brief for it.