Getting the transcript
Reading the captions from YouTube. A video nobody has opened here before takes 10 to 30 seconds; this page fills in on its own.
Getting the transcript
Reading the captions from YouTube. A video nobody has opened here before takes 10 to 30 seconds; this page fills in on its own.
The Inner Circle Trader · @InnerCircleTrader
This video has no Most replayed graph yet: YouTube shows one only once a video has enough views. These are the moments viewers replayed most in The Inner Circle Trader's most watched videos.
Most replayed moment at 51:50
3.7x that video's typical replay level
Okay? So, now we have two points of reference. Now, when I have this like that, I have two little sweet spots in the previous day's range and to the left of that, why? Cuz we're going to go back 3 days.
Said at 51:44
Most replayed moment at 12:06
4.1x that video's typical replay level
So we have relative equal highs during lunch macro, 11:30 Eastern time to 1:30 p.m. Eastern time. The setup usually forms in the first hour of that 2-hour lunch period. Okay? So between 12:30 noon
Said at 11:59
Most replayed moment at 10:06
3.2x that video's typical replay level
towards that of this buy side imbalance or side inefficiency, which is a suspension block, which has a volume imbalance on the high end and a volume imbalance on the low end. All right, so let's move into the lower time frames now. So, we're at a 1-minute chart.
Said at 9:58
The graph counts replays. It does not show where viewers stopped watching.
Words
5,279
Runtime
34:05
Speaking pace
155wpm
Reading time
22min
155 words per minute, below the 160 25th percentile of 349 measured videos. That distribution comes from the 349-video hook study.
Opening (first 30 seconds)
folks. Welcome back. All right, so I got just a few minutes try to wrap this little bit of a review up and teach you how I used my Obsidian model [snorts] yesterday. Uh but before I get into it, I just want you to remember that last week I gave you two specific daily chart premium PD arrays. Okay, so as I mentioned, we have to take one PDA array at a time. It's one thing to
78 words, the words spoken in the first 30 seconds at 155 words per minute.
Free, no signup. See how the first 30 seconds hold attention, with rewrites.
Sentence shape
| Measure | This transcript |
|---|---|
| Sentences | 435 |
| Average words per sentence | 12.1 |
| Longest sentence | 91 words |
| Questions asked | 37 |
| Sentences containing a number | 35 |
Most used terms
Filler phrases
38 in total: like 13 · uh 11 · you know 5 · um 3 · kind of 2 · I mean 1 · actually 1 · basically 1 · literally 1.
A literal whole-word count of the same phrase list the Prepublish browser extension uses, so a phrase inside another word is not counted and a phrase used in its ordinary sense still is. It is a count and not a judgement.
Run the check on the words above: where attention is likely to drop, with a rewrite for each weak line. The free check shows the scores and the one issue costing the most.
What this transcript is
Every word below is the caption track YouTube publishes for this video, pulled from the video itself and reproduced unchanged. It is not Prepublish's writing, not a summary, and not a re-transcription: it is the video's own published captions. English captions, generated automatically by YouTube, in the video’s original language. Source: the video on YouTube. A channel that would rather this page did not exist can ask for its removal through the contact page, and it is removed.
folks. Welcome back. All right, so I got just a few minutes try to wrap this little bit of a review up and teach you how I used my Obsidian model [snorts] yesterday. Uh but before I get into it, I just want you to remember that last week I gave you two specific daily chart premium PD arrays. Okay, so as I mentioned, we have to take one PDA array at a time. It's one thing to say we're going to go to ultimately new all-time highs.
It's easy to say we can go to these relative equal highs. We can easily say it can go here. It could. These are all things that could happen. And these relative equal highs I mentioned last week. We got to those. But when I said that we have to take one PD at a time, it's important because it's marrying the vein. Okay, which is an old gold miners expression. Okay, you find a little bit of gold, a couple flakes here, a couple nuggets, and then you think that if you keep digging long enough, you'll eventually get the mother lode.
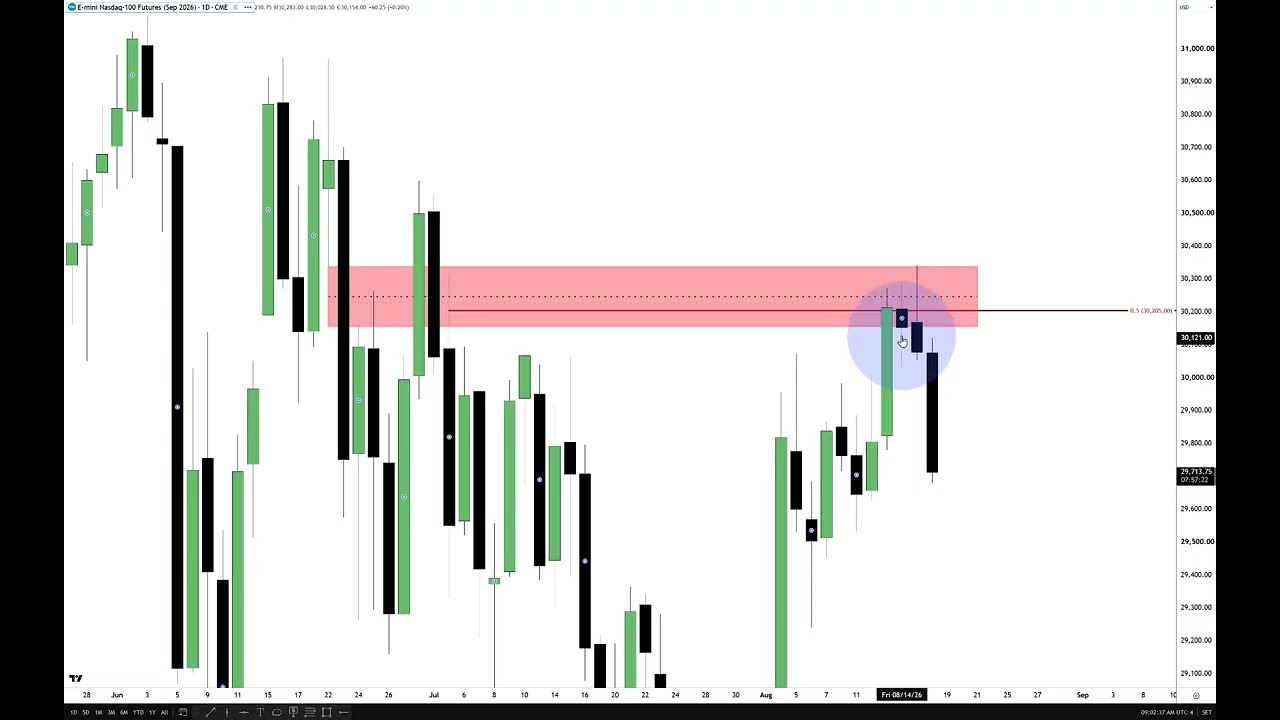
And that's what happens in trading many times. So, I I went through the process of giving you several things last week. These relative equal highs, which we cleared, okay? And then told you that we would utilize this wick which is a premium array. So I'm going to take all of the octant and gradient levels off and just leave the consequent encroachment level. Make sure it's on the darkest one. Okay. and utilizing this wick.
If price is bearish, then it will show its bodies in the lower half. If it's bullish, which would be indicative of running towards this high and these relative equal highs and maybe go to an all-time high. If it can't post the bodies above this midpoint, that's a problem. That's that's hard to get behind that for bullishness. Okay? You see how visually easy that is to be represented in candlesticks. Now, obviously, I know there's a whole lot more things behind these things, but to create a language that makes it easier for you to see, that's visually pleasing that you can see easily.
There isn't requiring a whole lot of thought process. This is the rules. Okay. Bearishness is supported by the lower half of the PD array. The bodies are going to stay in the lower half and out of the upper half when bearish. Bullish order flow, the price will have no problem burying bodies in the upper half. And then if it trades down to PDAs that are below market price, the upper half should show discount sensitivity and it should have no willingness to put bodies in the lower half of the PDA.
Okay, that's a very simplistic thing and nobody else has that. Okay. So, when you're asking me questions like this and yes, I'm responding to another student, you have to look at the logic that I'm teaching. Just because I draw a rectangle like this inefficiency I talked about last week as well. Just because I do this, okay, does not mean it's a supply and demand zone. Nobody else in any school of thought would have went to this gap.
Nobody would have done that. But yet, I did last week. Okay. And I want you to think about how price reacted yesterday when I tell you why I felt that markets were going to trade softer yesterday. This is the reason why I felt it was bearish. Okay. For the folks that were asking, you know, why did you think it was going to go down? We gave you the bearish uh idea. Look closer. Watch. As I indicated last week, you have to take one PDA at a time and you can't just make the whole idea based on your your will, your desire, what you want to see in price action.
And I know it's hard when you're brand new. You don't have a whole lot of things to hold on to in terms of experience. So the experience you're going by is the thrill and exhilaration or maybe even the anxiety that you're feeling while participating in either a demo account, a funded account challenge, a funded account that you maybe are aiming to get a payout or you're dreaming real money and it's a live execution. So before we can get to this high, we still have to prove ourselves here or the proof the price has to prove itself that this inefficiency here which will be used because my PD arrays are not like supply and demand.
Supply and demand becomes stale. They want fresh zones. I don't deal with expiration dates. Okay? Only only the futures market contracts expiry is the only thing that expires around here. But this wick is below the high of this. See the high of that wick right here? See that? It's lower than this candlestick's low, which means it's lower than this inefficiency or cibby sellside and bounce by side efficiency. This gap's high is higher than this wick.
This gap's high is lower than this candlestick's high. Those three PD arrays are what I talked about last week. But we have to take go back and listen to the lectures. We have to take one PD array at a time. So when we're dealing with this wick, if we're expecting price to go up to this level here or clear this inefficiency, what do we want to see in terms of my logic? My logic as it relates to visually represented in candlestick form only the order flow institutional order flow can be visually represented inside of the open high low and close of a candlestick.
Okay, they can't hide it. They cannot hide it. What do I mean by that? Well, if we I'm just going to extend this over just a little bit. Friday, look where we closed. We closed at the low of this cibby. That value is this candlestick's high, which is 30,157.75. So just remember 57.75. This candlestick's close, 54 even. So it's three and a half handles lower than this candlesticks high which is the low of this sell sign and balance buy sign in efficiency.
If it were indeed bullish why was it able to close below the inefficiency? Doesn't that indicate, as I teach, early warning signs that it's probably not likely as bullish as we all would like to see it be if it's going to go for all-time highs? It's an early It's an early warning sign basically. Then on Monday, we open here. We rally all the way up to the high of that inefficiency. Couple handles above it, which is permissible.
Remember, we're dealing with a daily chart. Okay. So, if we look at that candlestick's low comes in at 30,337 half. So, 337 half and the high was I think was in the 40s. Yeah. 343 even. So six and a half handles or five and a half handles rather which is very small thin margin for disparity between this specific candlestick's low which is the high of this civvy again this little gap right here from that candlestick's low that candlestick's high that's the very gap I talked about last week so we opened up not above consequent encroachment of that gap not above the consequent correction of this wick.
It was below and then it rallied all the way up to the high and then started coming down. Okay. So, when I'm looking for price to get into a short, if I'm getting early warning signs that last Friday we closed below a key PDR level, which is the low of the CBI there, which is this candlestick's high. Then we opened not with a gap higher. We didn't get that. We just had a gap small little you separation between the two. if you're looking at the daily chart, but then it rallies up and goes to the high of the CBI, but it can't mount a continuation.
So, because it's done this, I'm going to probe a run back to new week opening gap. New week opening gap. We're going to look at now on the daily chart. know that these things were attributes to the storyline or narrative that I was using for why I would expect price to go lower at yesterday. Okay. And look where we're at today. So, we have a few things. Let's go back through and remove all this if I can get my annotations back on.
So, we're down until one minute time frame and we're going to scrub on over here. I know, I know. Use the calendar. It'll save a whole lot of time. What if I want to put you through this? I know it gets on your nerves. All right. Right. So, here's the business. Uh, we have price trading up. This is that run into that daily cibby and just running just above it by a little bit. Remember it was the three uh 30,000 337 half was the uh very specific price level and then we went above it by six and five and a half handles trading right there.
So there's that little tiny little movement above the daily cibby that I gave you last week, what we just talked about on the daily time frame before dropping down into the one minute time frame. So, we're looking at price trading to this level here, which is I'm delineating two two points of time, and it's the high of 7:00 in the morning, Eastern time, Monday to 9:00 a.m., and you know, about that time. It's the pre-market session time.
So, those two book ends, their parameters on that uh that time range. Okay? And I think it would be very easy for you to agree that this high down to that low is the dealing range. You see that? So when we see a trend, go back and listen to the trader roundup from over the weekend. Okay, people were asking me, you know, what do I do? What am I looking for? What if I only do this and this is the only time I'm trying to trade?
And I use this very example right here. Okay, right out of my mouth. Saturday into the market Monday between 7:00 in the morning and 9:00 in the morning. If the market is trending, then you're probably going to get a little bit of consolidation and rangebound uh price action initially in the morning. Did we not get that? Sure it did. But this is what you're going to grade the high down to the low. So there's your quadrants and your octants.
Okay. Ideally, you want to see price action if we're looking for lower prices, which is the new week opening gap down here. And we'll scrub back over here, show you where it came from. There it is. There's that gap. So, that's new week opening gap. And we have price meandering around in here. So, what I was looking at is when we first created the uh the short-term little low right here and rallied up creating that high when we started to trade softer the 30,137 half level.
I'm going to show you where I got that from, why I posted it yesterday. from here to that low and then dogative five wrong.5. There it is. Okay. And you'll see it down here. See now because I think that's a draw. Why is that a draw? Because it's the first leg from here using what? the low of the dealing range between 7 o'clock and nine o'clock. That's not random. That's not random, folks. These are the things I tell you to look for.
And I'm using the same logic all the time. You know the logic that everybody says doesn't work. We hired to train credited staff and we couldn't automate it. So, it doesn't work. You just failed in automating it. You don't know all the rules. So when you read people say those things or listen to them say those things and you just say, "Okay, well, I'm going to go at their word and I'm not going to look at it any further on my own." You cheat yourself from all of the wonderful opportunity and discovery of being here.
I'm not holding you hostage, but if you don't want to be here, don't be here. But if you want to learn, take the opinions of others and mute them. You'll find the evidence. If you stay with this long enough, you'll find all the evidence. you'll ever need and nobody will ever need to encourage you anymore. But this high that formed at 9:32, not because it's a specific number, it's just that's the high it formed after 9:00 and then started trading softer.
It was already moving lower before I posted this level. It's an evolving projection. Meaning that while we had this high here down to this low, we can then use any higher high than that, which is what we get over there. Now, this high is important because it's doing several things. I'm going to take this off. Just remember the 30,137 half was just two ticks above the 137 level projection based on the low that anchored from between 7:00 and 9:00 in the morning Eastern time to the initial high it formed after 9:30 opening.
So it also traded up into that cibby traded down to the new week opening gap rallied up failed to take out that high on this rally. This low took out that low. So, it's doing the very things I talked about Saturday. And I talked about this before where if the pre-market session time between 7 o'clock in the morning, 9:00 in the morning, Eastern time, if it's trending in pre-market session price action, it's not going to be a clean price run in the morning.
Now, couple that with if I'm saying that we're going to look for 30,137 half, that's down here. So what am I indicating there? I'm indicating that I'm expecting price to go lower. But it has to do what after 9:30 opening. Ideally, we want to see a Judas swing. It's some measure of protraction higher. That's where smart money kind of like draws in the crowd to chase it going long. That's this all this price action right up here.
And what is it doing? It's going above half of this range. right here. That's the consequent encouragement of this range or in this case because it's a range is equilibrium. So it's high to low halfway point here. We're really in a premium now and it goes up to buy side sweeps this out there. So what do you think it's going to likely do? It's already returning back to an old pool of liquidity over there. So last Friday morning session, this area here, it's being swept.
Why is it important? Because it's already done this, Michael. Why? Why are we even concerned about that? Because during this period of time, that's electronic trading hours. So price needs to book real delivery and it may require redelivery to levels we've already seen in overnight globeex. Okay, so overnight London session, that type of stuff, Asia. So we're going to need to see this level be traded to if we're opening up down here as we did yesterday at 9:30 Eastern time.
So now this thing can evolve further where we can now take this high and then anchor it down to not only this low here but we've already breached this low. So now we can use this low here. So we have high to low and we can then do a measurement from high. I'll fix that in a second to that low. So there you are. two different price points. And then now you can do your projections. A reasonable one would be down here. I'm going to change this to um [snorts] we'll do in honor of prints again.
There's a standard deviation between that low that high. Not a bad little target right there. Okay. And that comes to 30,90 even. Okay. But because it's moving lower on the daily time frame and it failed so much yesterday based on what last week's PDAs were indicating, we didn't open up with a gap higher Sunday. It wasn't any kind of real significant influence to suggest continuation right out the gate this this week.
We can then now do projections like this. We can do -1 and we'll make that also purple. And you can project. There you go. So if it takes out this leg's low, we can see if it can reach down into this level, goes a little bit sideways. Ultimately, it picks that level off and it breaks even further and overnight broke even lower and lower and now we're here. Okay. Um, I will say that if you look at regular trading hours, there's a bit of business down here everybody should be aware of.
We have a huge gap that never has been traded to beyond what it's done here. So, just be mindful of this area right there. Okay? This is a rough idea of of what potentially could be evolving if we're going to see follow through going lower. This inefficiency and the sell side resting below there. Now, that's all I'm going to add to this. Now, let me go back and re revisit what I did and why I did what I did. All right.
So, let's take this off and inside the scope of yesterday's trading session. Grading out the 7:00 to 9:00 in the morning Eastern time pre-market session dealing range like we did here. Carry that forward. We have initial rangebound choppiness. Okay, it's not random. It's not beating you up. If you don't know what you're doing, it would be, but trades down into new week opening gap and then starts its protraction higher, clearing out the high of the morning and clearing the high over here where this nice dynamic drop where yesterday on a short little 10-minute video, I told you that I'm looking for new week of gap when it was trading here.
So, that's bearishness. It got down to it several different times in here. It rallies up, clears the buy side, and because it's done that with all things being equal, as I indicated here, it didn't give a strong showing at the new week opening gap. We only went up on this rally here to tap the civi high on the daily chart, which the high was 30, 337 half, and it went five and a half candles above that to create the high at 43.
So 30,43. So that is the little tiny little blurp. Okay. Above the high of that civi and it doesn't stay there long. See how quickly it gives up the ghost. And then we went up into this level here which creates the high of 7:00 to 9:00 in the morning. Mid-range equilibrium of this range from high to low between 7:00 in the morning and 9:00 in the morning. Forget everything else that's in the price ch. chart right now.
You're only worrying about this range. Okay? You don't care about this because this was them doing what? A wick on the daily time frame. The wicks can do the damage. Disregard that. The real story is going to be between the book ends of 7:00 and 9:00 in the morning. This is what we've been teaching. Okay? High to low. Grade that. Carry those levels forward. When we get to this protraction going higher, we get a buyside liquidity pool, it takes the liquidity.
Does that high hit the upper quadrant of that dealing range, high to low, which is this level right here. Does it hit it? No. If it would have, I would have added more there. But now we're going to drop in closer in price action. You're going to see Obsidian now. Obsidian is a PD array where you see a wick like this. While I'm expecting price to eventually turn and go lower, I look for these wicks like this. And then if there's an opposing wick that forms, it has to be above it.
Now, this wick and then we have this wick here that's going the opposite direction. So, what's happening here? We have a wick that's above the candlestick, and then we have a wick that's below the candlestick. We're grading both of those. The halfway point is there. And on this one, the halfway point is there. Extend those to the to the right. You just watched me post a video, the the long format version of it where it's real time.
It's not sped up so that way the short attention spans on X or Twitter. They would never care so much that you look at it. But I I show this forming after certain rules are met. The market trades lower. We close below it. And then when we get up in here, it proves to me that it's not willing to put a body in its first run up in here in the half of that. So between this candlesticks consequent encroachment, this candlestick's consequent encroachment, this little range, this portion of price action is where my focus is.
Now, I shorted higher, but I want to build anytime it it enters in here, I want to build the position up to go lower. And again, I'm aiming for the first target, which is low hanging fruit, 30,137 half, which is two ticks above the projection I just showed you at 30,137 even. So when we pull up the executions there, I am shorting as it's running up right there as it going right into that old pool of liquidity. And if it would have traded to that level there, which is the upper quadrant, I would have added to it.
But I'm looking for it to fail there. I want to see it not reach that level, but clear the buy side at that level here. That was an old buy sell liquidity pool from Monday's morning session. I'm sorry, Friday's morning session last week. So, we'll take this off. The market breaks down and we start approaching this level again. And I'm I'm doing it with market orders. So, you got to take it for for what it is. But my focus is anywhere in this area here or in close proximity to it, I want to anchor and build in.
Anytime it keeps tapping inside there, I know what it's doing. It's building a false consolidation that bull flag traders going to see this. It's going to continue higher and it's going to deny them because everything I indicated thus far. That's why I was bearish. Okay? If you if at this point if you don't know what makes me bearish and why I'm doing this, rewind this video and start all over again and pay close attention to what I'm describing on the daily chart and how we did not at open this week a certain way and the things that we saw on the daily chart.
And then we obviously weren't giving all that much bullishness because of the price action despite this run here which was protraction after 9:30 in the morning. So we get this run here. Now what I'm doing is I'm nailing down from from this wick low and this wick high. I see a gap. So I'm putting something in there because I'm pretty confident that we're not going up here. And then now when it does this run here, I that confirms to me that now I have obsidian.
Obsidian is two wicks opposing. And the second wick has to be higher than the first one. When you're bearish, you have you have to be right on the direction of the marketplace. You have to know what you're looking for, the narrative. You have to be on side. You have to know all those things or this isn't going to work in your hands. Okay? And I know some of you are going to come out here and say, "I tried to do this and I hired a staff and we did all these things. since we tried to program and it doesn't work.
But yet here I am doing it. Okay. So I don't know what to tell you. Here we are right in the middle of it getting filled there and then right there I'm trying to nail as as I was going around and banging in here. I was trying to slide into that and get the low of it but it didn't work so much in my favor but it's still nonetheless delivering. And then look at the bodies here. It's respecting that wick pretel. How's that in Elliot wave, white golf, supply and demand, GAN, everything else out there?
It's not. It's literally not out there. Okay. So, how did I discover this? Look here. That's what I heard. That's what I heard. And it wasn't audible. It was like inside me, but it wasn't my conscience telling me. It was that still quiet voice. Look here. And I started putting them on the chart. And I started seeing these things form. Now, I don't know what to tell you beyond that. You don't have to subscribe to, you know, all that other stuff, but I got to give the credit to where it came from.
So, I believe it came from him, the father. And you can think I'm crazy. You can say whatever you want to say, but the bottom line is is for the folks that ask me, I'm being honest. There's nobody out there teaching this. And if it was, it would be very easy for me to say, "Go learn it from this book." And it would save me a whole lot of time. It would save me a whole lot of time. But there's nothing else I can do. I I just when you ask me the question, I'm going to answer you honestly and that's the answer.
So then I draw on the chart in the recording real time. It wasn't an annotation or something. It's a call out that was added to after the fact of the video. You can see clearly see me take and draw the the the trend line from here and draw down. Okay. To get to first partial. Now in here it's reaching lower lower until we take out this low where I drew the trend line just indicating like internal dialogue cuz I don't talk in the video you just watch it's 2 hours and 10 minutes long plus something like that.
But I draw from here is telling you that my expectation without having to say any words is from this candlestick it's going to start dropping down and take out these lows. That's what I'm looking for. And it drops down below this buy side balance sellside sign efficiency. I wanted to see this act as an inversion fair value gap if it went below and it qualifies it by having that close below it here. See that? Look at the close 253 3/4.
So just remember 53 3/4 53.75. This candlesticks high 54. So it's one tick below. So it validates this as an inversion fair gap. But notice that it can't even touch it here. Can't even touch it here, here, here with any of the bodies. So, what is that indicating? It's bearish. So, we have a sell sidebounce, buy sign efficiency here. It's not noted. Bodies are respecting that and sells off. We create another little fair value gap here.
Price trades lower. I'm grading this inefficiency. You can see it there. And I just wanted to put the half consequent encroachment level and I wanted to see the bodies respect this portion here and then it finally came up poked a little bit above this is PDA 2 hammering around looks like it's a bull flag it's going to fail race breaks lower and also this fair bag was chosen because it's anchored to the consequent corion of the 7:00 the 9:00 in the morning Eastern time pre-market session dealing range that I told you about before we started zooming in here.
So all these levels here are salient to that dealing range. And we carried it and projected it forward into the morning session. [sighs] And then finally we give up the ghost on this low here. And you can see that actually filling there is my first partial. And yesterday was my son's birthday. And I was trying to explain to him as it was happening real time. I said, "Look at it's going the first partial." He was looking at his phone, wasn't paying attention.
He's sitting right next to me. And he's cringing right now cuz I'm giving him the right act in front of all of you. >> Yeah. >> Yep. Relative equal lows was the next partial. Uh we went right there. That was the fill there. And then new week opening gap. I took something as we hit the upper quadrant of that right here. And then there's the low. And I was updating everything on Twitter at that time or X saying that I I lowered the stop loss.
I'm looking to partial out. And then finally, um, I had my limit order just above 13750 because I called that level publicly. So, I want to have a little bit of fluff in it. You saw those orders resting in my post yesterday before it went there. Uh, and then you can see it filling there and it finally it went aggressively lower than that went lower and that's the business. Now this is intraday trading using market maker sell model.
Me entering on smart money reversal. Me entering on lowrisk short holding through first stage distribution. Second stage redistribution there sells off heavy running through original consolidation. There's that fill. So the logic is sell side being targeted of a market maker sell model failure on the daily time frame. So we're working with the hierarchy of working from daily chart down to the smaller time frames. Not just looking at a smaller one minute chart and saying I'm going to figure it all out on a one minute time frame.
You have to have the logic that's been transposed from your higher time frame daily chart to warrant whether or not that price movement you're expecting to see has any validity behind it. Because if there's nothing supporting the idea on the daily chart, it's not going to be helpful to you to place so much risk or hope and and trust in just what you see on a one minute time frame. So that's the business for that. Obsidian is is two opposing wicks within a narrative and you split those wicks in half and between those two wicks consequent encouragement levels, uh you're going to see price action do these types of things.
And I'll give you more details later on about this, but that's that's obsidian. Okay, until talk to you next time. I don't know when it's going to be.
The words are the caption track's own and nothing is reworded or re-transcribed. Paragraph breaks are placed between sentences so the text reads as prose.
Free tools for your own script: paste a draft and see where it stands before you record it.
Paste your draft and see where viewers are likely to drop off, with a rewrite for each weak line.
Paste the first 30 seconds of your own draft for a hook score and rewrites.
Check your draft against YouTube's advertiser-friendly guidelines before you record it.
Read this channel's public videos and transcripts, and download a writing brief for it.