Getting the transcript
Reading the captions from YouTube. A video nobody has opened here before takes 10 to 30 seconds; this page fills in on its own.
Getting the transcript
Reading the captions from YouTube. A video nobody has opened here before takes 10 to 30 seconds; this page fills in on its own.
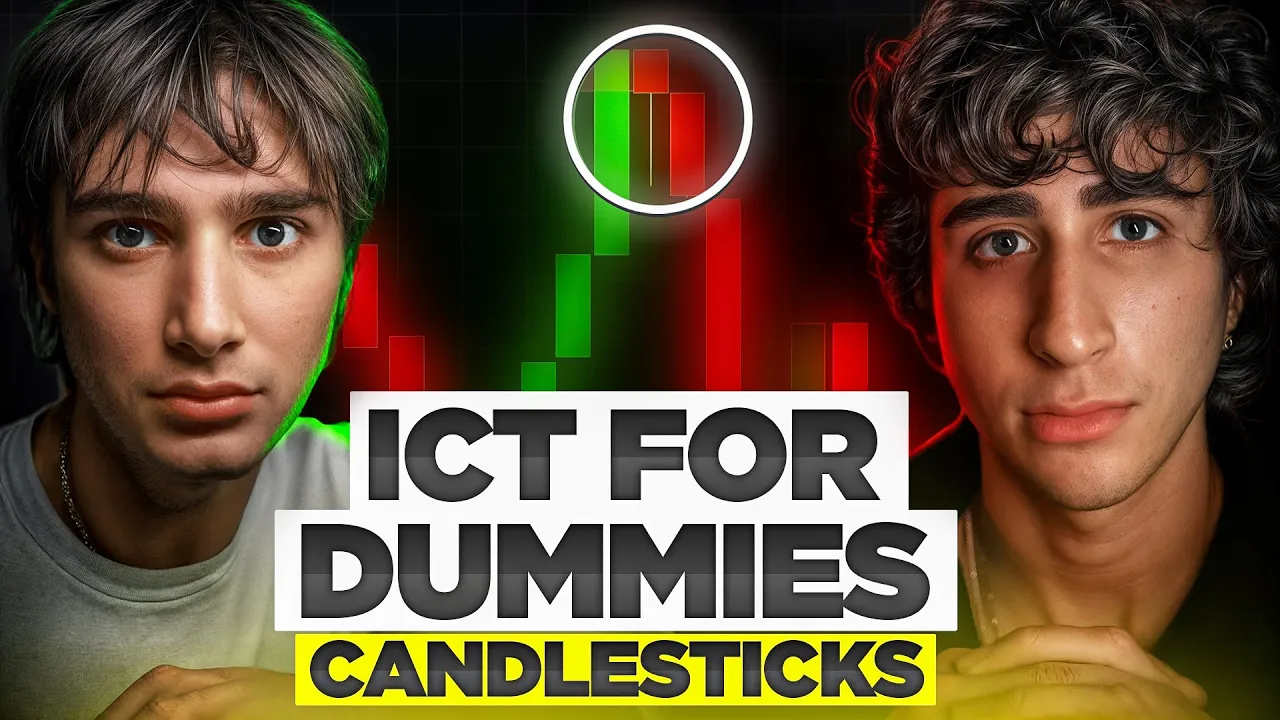
PB Trading · @PBTRADINGYT
Where viewers went back to watch this video again, from YouTube's public Most replayed graph, lined up with what was said at that moment.
Most replayed moment #1
1:123.0x the video's typical replay level
some illustrations for you guys which is just going to show you an even more simplified manner of these different candlesticks this is a very bullish candle this is a very bearish candle how can you tell you can clearly see that there's a lot of buying power in this candle because there's a wick at the bottom and then
Said at 1:04
Most replayed moment #2
5:232.9x the video's typical replay level
to lose so much more to include that this is a weak candle and then this is a strong candle this is a weak candle and this is a strong candle why am I saying this though because this bearish candle here shows that price has rejected and area here now we're not going to get
Said at 5:17
Most replayed moment #3
10:372.0x the video's typical replay level
and because this close happened above the opening price this is a green candle so just remember that if the candle closes below opening price then it's going to be a red candle dance for me while I do this P okay you can sit down okay yeah I'll
Said at 10:30
The graph counts replays. It does not show where viewers stopped watching.
Words
3,095
Runtime
14:56
Speaking pace
207wpm
Reading time
13min
207 words per minute, above the 201 75th percentile of 349 measured videos. That distribution comes from the 349-video hook study.
Opening (first 30 seconds)
what the [ __ ] is up guys episode one of ICT for dummies can someone please make us an intro email it to us it goes welcome for ICT for Dum one more welcome to ICT for dummies teach you how to make money oh if someone can make an edit for that so we can have an intro that'd be fire anyways yeah this isn't necessarily ICT it's pretty foundational we need to start off with foundational stuff like handle we're assuming you've never in your life traded you don't know anything we're starting from Rock Bottom so let's get into it
104 words, the words spoken in the first 30 seconds at 207 words per minute.
Free, no signup. See how the first 30 seconds hold attention, with rewrites.
Sentence shape
| Measure | This transcript |
|---|---|
| Sentences | 15 |
| Average words per sentence | 206.3 |
| Longest sentence | 1,175 words |
| Questions asked | 0 |
| Sentences containing a number | 15 |
Most used terms
Filler phrases
32 in total: like 14 · actually 5 · um 5 · I mean 2 · sort of 2 · you know 2 · basically 1 · uh 1.
A literal whole-word count of the same phrase list the Prepublish browser extension uses, so a phrase inside another word is not counted and a phrase used in its ordinary sense still is. It is a count and not a judgement.
Free, no account. See where attention is likely to drop, with a rewrite for each weak line. The free check shows the scores and the one issue costing the most. Or run it on the words above first.
Free · No login · See a sample audit first if you prefer.
What this transcript is
Every word below is the caption track YouTube publishes for this video, pulled from the video itself and reproduced unchanged. It is not Prepublish's writing, not a summary, and not a re-transcription: it is the video's own published captions. English captions, generated automatically by YouTube, in the video’s original language. Source: the video on YouTube. A channel that would rather this page did not exist can ask for its removal through the contact page, and it is removed.
what the [ __ ] is up guys episode one of ICT for dummies can someone please make us an intro email it to us it goes welcome for ICT for Dum one more welcome to ICT for dummies teach you how to make money oh if someone can make an edit for that so we can have an intro that'd be fire anyways yeah this isn't necessarily ICT it's pretty foundational we need to start off with foundational stuff like handle we're assuming you've never in your life traded you don't know anything we're starting from Rock Bottom so let's get into it this is probably what you're seeing if you're getting on the charts for the first time bunch of red a bunch of green bright colors you're like a [ __ ] this is what the average unprofitable Trader sees as you make money the colors get more dull yeah why are they called candlesticks so they're called candlesticks because they're made of bodies and Wicks Wicks tell you where the CLE was and the body show you where it closed okay guys we decided to make some illustrations for you guys which is just going to show you an even more simplified manner of these different candlesticks this is a very bullish candle this is a very bearish candle how can you tell you can clearly see that there's a lot of buying power in this candle because there's a wick at the bottom and then a body closure a strong body closure to the upside there's not a wick at the top this represents a high buying power candle same for the bearish candle there's a lot of selling power here right we have that Wick at the top but there's a strong body closure to the downside these are just basic things that are going to be subconscious you're not going to think about this eventually you'll understand what a strong bullish candle it's displacing through price is going to look like and a strong bearish candle is displacing through price is going to look like but to give you a general sense of everything if we look at these five candles we have on the screen your average bearish candle is all the way to the left then right next to it is your average bullish candle next you have a dogee candle eventually I mean we can get a bit into it but dogee candles can be a potential indication of a reversal in price however I wouldn't be too worried about that we're going to teach you what's really important and for now we just want to establish a strong Foundation since you're not going to be pattern trading or any [ __ ] you're going to be learning ICT like a [ __ ] real man um we'll teach you exactly what you need to know this is the daily time frame on the NASDAQ every single Candlestick here represents one day worth of price action okay so this was today's price action Friday November 15 when we are recording this video this was yesterday's price action Thursday November 14th and so on and so on and so on as you can see today we were incredibly bearish right big red candle bearish day on Wednesday very bullish was this election day very bullish price is clearly and visibly delivering higher which can be represented through a large green candle so every single time frame I have above we have the 1 minute we have the 2 minute 3 minute 4 minute 5 minute and it goes up to the Daily right so this is the daily again now Patrick can we go on the one hour yes Blake so now we have the hourly chart each candle here is going to represent one hour of price action as you can see we have 400 p.m. here we have 300 p.m. 2: p.m. 1 p.m. 12: p.m. 11:00 a.m. 10: a.m. you get the point this is 1 hour of price action 15 minute for example break it down for us Blake so on the 15-minute time frame what does this represent 445 what about 15 minutes before that 430 this represents another 15 minutes of price action so you can keep going lower and lower and lower in time frames you can keep going higher and higher and higher in time frames up until the monthly they even have the yearly on here and there's also seconds charts so we're now going to go into what these candles actually represent on the chart here is a quick example of how you will be switching between time frames once you become as profitable as us yeah he's he he's super fast he basically full boxes just did the whole analysis on the entire day within 3 seconds so this is a singular 15minute candle what this candle is going to represent is 15 minutes worth of price action so when we go down to the lower time frames we can actually see every candle that is formed inside of this range right and you can see we marked the top of it with a line the bottom of it with a line right there's two lines to show you there that as you switch through these time frames the lines are going to remain there but you're going to see how the lower time frames look inside of this 50-minute so this is a 15-minute we can go down to the 5 minute which should be what three candles quick maths those are the 5minute candles that created that 15minute candle you can go to the one minute now and so there's going to be what how many 15 candles so there's 15 candles 15 candles that make up this 15minute candle this same idea is going to apply for the hourly right how many 15-minute candles are going to be inside the hourly there's going to be four right that's what makes up an hour so you can play around with that as well I recommend you do do that it's going to give you just a you it's going to give you a good sense of time and um yeah okay I'm ready now okay why don't we talk about DN candles what is that these nuts don't include that please I'm going to lose so much more to include that this is a weak candle and then this is a strong candle this is a weak candle and this is a strong candle why am I saying this though because this bearish candle here shows that price has rejected and area here now we're not going to get into pdas and all that stuff at this time but we can assume that from this reaction here because price at some point traded all the way down here right so at some point we were you thought this sh was dumping into the floor right but then we rejected an area here and the candle actually closes all the way up here so from this you can assume that price has rejected somewhere and we are going to trade higher we're not pattern trading these candles guys we're going to use them with narrative and other confluences which we're going to teach you later in the series and you're going to be able to put together everything like a goddamn Lego so this is a strong bearish candle this is showing a lot and a lot of selling pressure right the candle has traded all the way here and we didn't reject anything in this area and we closed here and with zero Wicks this shows that price is most likely going to continue lower same applies to the bullish scenario here get on the [ __ ] Mouse and and mark it out then guys we have the same but for the bullish scenario so as you can see this is a weak bullish candle at one point this candle was absolutely skyrocketing up all right we were [ __ ] going to Mars big Drake candle comes back down doesn't close that strong after all that's an indication of a weak bullish candle we saw that it traded higher here but then it started rejecting something among this level so it ended up closing down here and not being that bullish after all this is a strong strong bullish candle big Power big Power you can see displac high lots of volume right the Wicks are not taking up the majority of the candle like this one there is a lot of volume here and that's going to be a pretty good indication that price wants to run higher so if we go right here right what are we looking at very bullish candle very bullish candle look at how much of this candle is made up of the body you can clearly see it's very bullish look at how much of this candle is made up of the body you can clearly see it is very bearish but that's not going to be the only indicator you can use to determine if price wants to go up or down we're going to teach you more in depth other things you're going to combine to really put together those narratives but I mean just look at this right bullish structure strong bullish candles what starts happening up here oh more Wick it starts dying out and then we get that big bearish candle and then we get more bearish candle and then look at the candles also before price reverses look at this right price is dumping lots of power lots of power what happens here do okay not to say that every time you see a dogee price will reverse but it's still something for you to look out to because you can see that the pressure is dying you can see that there is less volume in the market right now as sells are stopping and so you get these dois and then what happens buying power increases bullish candles start and yeah guys really spend some time just analyzing price like screen time is the most important time in trading when you're first starting out um you got you got to be schizophrenic about it you got to be crazy you really just got to spend time in the charts become one with them and yeah let's talk about something a little bit cooler now so this is your open high low close and your open low high close this looks very intimidating but I promise you guys it is not is what a bearish candle looks like a red candle this red candle here represents price has opened here it has traded higher and then it trades lower and it closes here so now just to implement some time increments so let's say from 150 to 2 p.m. price is just sort of trading sideways and at 2 p.m. you know we trade up this this is this this move right here is going to be from 2: p.m. to 250 p.m. and so we just started dumping from 2: to 250 and at 250 to 3 p.m. 3 p.m. we close down here right so nothing to over complicate here but this is just going to end up being a bearish candle so you understand right let's say you were looking at the charts at 150 and then by 250 you see that we're trading down here you're probably going to see a big red bearish candle for the 2 pm candle um you're not probably you're going to see if it opens there and it closes there you're going to see yeah you're going to see whatever [ __ ] you Blake so in simple terms guys the Open high low close what does this all represent this is your opening price for a bearish candle we're going to have an open at the high and it goes higher meaning this is the extreme of price this is the highest point in which price traded to but it's not going to close there right we then trade lower and then this is the lowest point that price traded to but it didn't close there we then trade higher to close this candle and this is a bearish candle because we closed below the opening price versus a bullish candle this is a bullish candle because we closed above the opening Price Right In A bullish candle and a green scenario and a green candle we have an open at the bottom we then have a low that has formed and this is the lowest point in which price has traded to and then we have a high and then we have a close and because this close happened above the opening price this is a green candle so just remember that if the candle closes below opening price then it's going to be a red candle dance for me while I do this P okay you can sit down okay yeah I'll stop perfect so this dogee candle is going to show a lot of consolidation because price didn't really move a lot here as you can see here this is the open right just like we talked about this is the low so this is the extreme the lowest that price has gone in this 15minute candle range and then this is the high this is the highest point that price has gone in this 15-minute candle range from 12:15 right and if we go down to the lower time frame like the 1 minute time frame so from 12:15 all the way to 12:30 this shows the 15 minutes worth of price action so this dogee candle is not going to show a lot of price movement right it's going to show a lot of accumulation for example here the opening price and the closing price is very close together as you can see here with the opening price here we traded higher and this is the extreme point this is going to be the wick and since price traded below the opening price and closed below the opening Price Right This was 1215 and then it closed at 1230 and since it closed below the opening price it is going to be a bearish candle as you can see though at the beginning of this 15minute chart uh we did trade lower and then we traded higher and so we made these extreme highs and this extreme low and then Price died out and started closing near the Middle with low volume but it still ended up closing below that opening price which means it's going to be a bearish dogee it's hard to notice really because it is a micro sort of close there but nonetheless it is still a dogee now something that's going to be easier to spot is going to be like the candle right after so here we have the dogee what happens right after boom we got that reversal this is a strong bearish Candle on the 50-minute chart and we're now going to mark this the same way so you can see what this looks like on the one minute so this is the 15-minute time frame right it shows price from 1230 all the way to 12:45 so we can see here on the 1 minute time frame price has opened and this is the highest point that price has went in the 15 minutes of this price action and this is the lowest point that price has went in this 15 minutes of price action and since price closed below the opening price at 1245 then it's going to be a bearish candle now let's get into a bullish example so this is a bullish Candle on the 15-minute time frame as you can see here prices opened we then created the extreme low we then created the extreme Wick and we closed above the opening price meaning it's going to be a bullish candle we can see here here on the lower time frame this is what happened we opened we traded lower and we created the extreme this is the lowest point that prices went at from 1:45 to 2 a.m. and then we created the extreme high this is the highest point that pric has went we didn't close there right but price reach that level and since we closed above the opening price this is going to be a green candle all right guys so that concludes our ICT for dummy episode one we teach you how to make money money I forgot I went does matter anyways like show them the illustrations and we're going to yeah we're going do is every [ __ ] bearish candle you why I this is how they learn they're not they have Tik Tok brain I hope you guys remember everything that you're looking at right now um just quick recap I can't give a recap with giant versions of you everywhere anyways guys here is our little outro with the illustrations make sure you know this make sure it's engraved in your brain make sure you understand it more importantly and not just memorize it and the way to do that is by practicing and actually looking at the charts and looking out for all of these different types of candles there's not that many there's not a lot you need to know right we're keeping it simple and straightforward with you guys but yeah once again thank you for watching our first episode this was on candlesticks we're going to be posting a psychology video right after this psychology is equally as important if not more important than actually understanding the technicals so please make sure you watch that video right after as well and this is ICT for dummies part one and this is on [Applause] [Music] candlesticks [ __ ] losers it's a Friday night it's a Friday night at 8:30 p.m we teaching the homies about candlesticks but I'm not even going to go to that place cuz I'mma be [ __ ] bricks yeah okay lock all right lock Fu thank you guys for watching and we'll see you in the next video peace out
The words are the caption track's own and nothing is reworded or re-transcribed. Paragraph breaks are placed between sentences so the text reads as prose.
Free tools for your own script: paste a draft and see where it stands before you record it.
Paste your draft and see where viewers are likely to drop off, with a rewrite for each weak line.
Paste the first 30 seconds of your own draft for a hook score and rewrites.
Check your draft against YouTube's advertiser-friendly guidelines before you record it.
Read this channel's public videos and transcripts, and download a writing brief for it.