Getting the transcript
Reading the captions from YouTube. A video nobody has opened here before takes 10 to 30 seconds; this page fills in on its own.
Getting the transcript
Reading the captions from YouTube. A video nobody has opened here before takes 10 to 30 seconds; this page fills in on its own.
Matt Wolfe · @mreflow
Words
4,717
Runtime
21:48
Speaking pace
216wpm
Reading time
20min
216 words per minute, above the 201 75th percentile of 349 measured videos. That distribution comes from the 349-video hook study.
Opening (first 30 seconds)
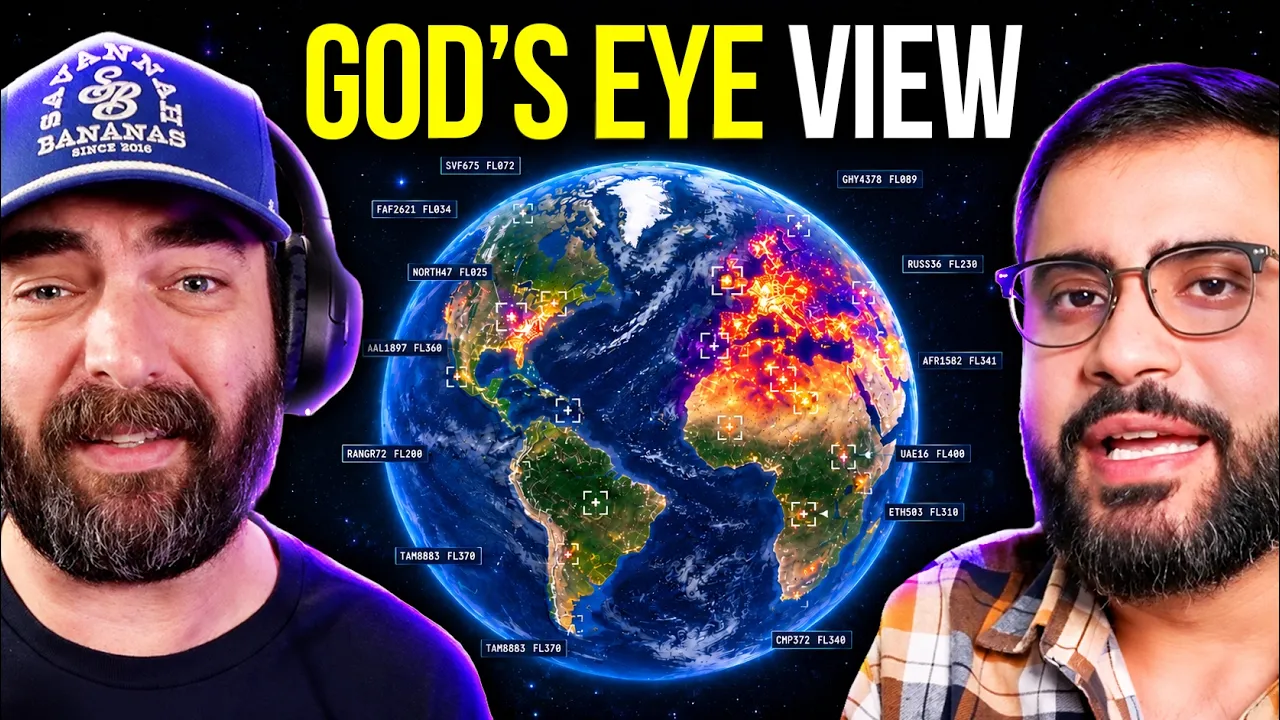
What if anybody could have the power of Palunteer on their home computer? That's exactly what my friend Belaval Sadu created with his God's Eye View project, which at least for a few days was the number one most trending project on GitHub. He put out a couple really killer videos about it, but I had to go straight to the source and find out all about it for myself. Let's just start with what is God's Eye View? Like, what did you build it for and what does it do? So, God's Eye View is basically a spy satellite simulator in your browser, except the underlying data
108 words, the words spoken in the first 30 seconds at 216 words per minute.
Free, no signup. See how the first 30 seconds hold attention, with rewrites.
Sentence shape
| Measure | This transcript |
|---|---|
| Sentences | 301 |
| Average words per sentence | 15.7 |
| Longest sentence | 92 words |
| Questions asked | 46 |
| Sentences containing a number | 11 |
Most used terms
Filler phrases
294 in total: like 199 · you know 19 · kind of 17 · uh 16 · right? 15 · basically 13 · um 7 · actually 3 · I mean 2 · sort of 2 · literally 1.
A literal whole-word count of the same phrase list the Prepublish browser extension uses, so a phrase inside another word is not counted and a phrase used in its ordinary sense still is. It is a count and not a judgement.
Free, no account. See where attention is likely to drop, with a rewrite for each weak line. The free check shows the scores and the one issue costing the most. Or run it on the words above first.
Free · No login · See a sample audit first if you prefer.
What this transcript is
Every word below is the caption track YouTube publishes for this video, pulled from the video itself and reproduced unchanged. It is not Prepublish's writing, not a summary, and not a re-transcription: it is the video's own published captions. English captions, generated automatically by YouTube, in the video’s original language. Source: the video on YouTube. A channel that would rather this page did not exist can ask for its removal through the contact page, and it is removed.
No Script X-ray for this video: YouTube shows a Most replayed graph only once a video has enough views.
What if anybody could have the power of Palunteer on their home computer? That's exactly what my friend Belaval Sadu created with his God's Eye View project, which at least for a few days was the number one most trending project on GitHub. He put out a couple really killer videos about it, but I had to go straight to the source and find out all about it for myself. Let's just start with what is God's Eye View? Like, what did you build it for and what does it do?
So, God's Eye View is basically a spy satellite simulator in your browser, except the underlying data is real. If you've ever like, you know, seen any Hollywood spy thriller movie, they've always got the command center dashboard pulled in. It's like, oh my god, this is where all the satellites are. This is where all the planes are. This is where all the vessels are. It started off as like a project just to have fun with that.
And so I had my clanker just go like pull a bunch of these data sources together and put it on the globe because the idea is like the static globe is cool but the world is like brimming with life. So how do you bring it to life? Well, let me tell you Matt, there is a lot of open-source intelligence out there that can absolutely do that. >> So after seeing how cool this platform was and how much stuff you can do with it, I had to ask Baval and who is this even for? a lot of things.
Like some people are using it for content creation. So they're using it in their like when they want those kind of crazy spy scenes. Some people are just using it to monitor their own city, the world, their neighborhood. I like to say there's this joke, right? Like Google Maps is for finding places and then Google Earth is for getting lost. I mean, it is just so fun when you see this God's eye view perspective of the world and what's going on.
It has this almost like astronauts describe it as this observer effect. Why go play a game that's fully synthetic when you can explore the real world? And then there's like a bunch of other interesting use cases that are everything from journalism and activism to quite frankly defense as well. The tool that's being built right now is obviously not a defense tool, but people who are from that world are like, "Wait a second, why does this thing look cooler than my thing?" Like, [laughter] >> which has been fun to see, but it's really a civilian intelligence tool and people have fun with it.
Another question I wanted to know was how did you actually build this thing? Obviously with all of these AI tools available, almost anybody could build anything, but it takes a special person to know what's available out there and to pull all the pieces together. Like he had to know these various APIs existed and stuff like that. So I had to know like how did this all come together? So the initial build in circa March and April, it was just like uh OpenClaw at the time driving Gemini 3.1 and I believe it was like Opus 35 if I'm not mistaken.
It it was uh basically me trying to figure out how to parallelize stuff at the time, right? Obviously open very token inefficient harness to use, but Gemini is really good at spatial reasoning and obviously Opus is just like absolutely cracked at full stack dev. And so together is basically like get the foundational layer in place. Let's start layering satellites now. Let's do planes next. And my god, I think it was probably I was like in a fever dream for like a couple days where this is all I was doing.
Back then we were hoping to see this explosion of letting a thousand flowers bloom. And we're totally seeing that given all the flight sims people are making. But now I get to have my own flower in this like in this like growing garden. It's been uh it's been a blast. And with the APIs, are they all like free public available APIs or is there like like a bit of cost to run this thing? >> Great question. So, I've tried my best to keep the open source version as accessible as possible.
So, if you're not using the voice interaction capability, which uses like chat GPT real time, which can get expensive pretty much, if you're using this for personal non-commercial use, most people can use it at no cost, right? Like if you're using it all day every day, it might be on the order of a few dollars a month, but it's really not that much. >> My first question to Balavo was, "How is this legal? Like, couldn't people use this to spy on me?
What if I have stalkers that want to know where I am? Could they use this tool for that?" Luckily, here's what he had to say about that. >> Yeah. So, like, uh, with the open source project, I've drawn a hard line on you cannot track people. So, that's a hard line. What it does let you do is have situational awareness about large-scale infrastructure that's in the physical world. So notably that's satellites that are in orbit, that is planes that are flying around, including commercial and sometimes military traffic and of course vessels where they are.
Select cities have CCTV cameras and then using other data providers aggregate traffic information as well. So think of it like basically a very supercharged mapping application that kind of goes like a couple layers deeper than what consumers are used to. And a lot of people can view a tool like this and be like, "Oh, like like are you trying to build like a surveillance tool?" I'm like, "No, like this is like the opposite of that." Like surveillance tools already exist.
Like all the governments have them. They're using them all the freaking time. Like it's being used in wars that we're seeing play out right now. this is like a civilian intelligence tool to make it easy for people to kind of like I I like to think of it like building a window through which we can see our world. So if all of this data is there like there should be a place where you can like like access it. And so like I'm I'm just super excited about like more of a publicly legible palunteer >> where it's not like oh like let me go and like find Matt and like where does he stay?
I think it's like important that we be able to get as close to the ground truth as possible rather than looking at like a dot on a map and then four people like yapping about it. Like why can't we all go make sense of the actual data? >> So yeah, it does feel fairly safe to use. All of the information that's being put on here in front of us is publicly available information that anyone can access anyway. Bavvel just made an easy platform for anybody to go and access it who may not know how to use API keys or may not want to develop something like this themselves.
He gave us the easiest way to go and pull all of this information together. The CCTVs are on a delay, so you can't look at them in real time and see where somebody is standing this moment. The cars that are driving around on the street, it's all anonymized data. It's not going to give you the license plate number and let you track somebody through town. I mean, if you know what flight somebody's on, you might be able to follow their flight, but that's fairly harmless.
You could do that with Google already. So, let's let's like jump into it and and play around with it a little bit. I want to see some of the cool you can do with it. All right, so this is God's Eye View. Let's go to a globe view and like start turning some stuff on. We got a bunch of data layers in here, right? So, obviously you can turn on flights. You can turn on military flights as well. You can turn on satellites as well.
And let's turn on vessels. And already you can see just how dense the data is and just how much is going on. And I've tried my best to keep this very performant so it's easy for folks to use. Hey, can you please take me to the busiest airport in the United States? >> Done. I've flown the view to Hartsfield Jackson Atlanta International Airport. >> So I've got a couple modes in here where you can just see these like planes are like as 3D.
I love to go do like a landing uh move. So let's let's take a plane that's like about to land right now. >> Mhm. And I've got this thing called context mode where you go into it and essentially like you can kind of see what's in and around that area. Hey, these are the planes around. These are the military planes around so forth. And you can even jump into a cockpit view. >> So now we're looking at a uh a plane that's about to land in SFO right now in real time.
Like >> that's crazy. But yeah, one of the the funnest things I love to do is like even when I'm just coding, I just like to pull up my like favorite like airport and I'll just have it like looking at what's going on in a certain location. And it's perhaps one of the most overkill ways if you want to track somebody like you know it's like hey like you know your partner's like flight's coming in or something like this.
You can use this tool to do that. But I do want to point out um like military activity too. So >> yeah I was curious. So I'm in I'm in San Diego, right? And San Diego is like a huge military hub, right? We've got giant marine bases, giant navy bases. I I'd be curious to see what it what it's seeing over here. >> Let's go. Looks like there's plenty of military activity. So all the yellow is uh like our military and everything white is commercial.
And so like as you'll notice when you click on one of these like flights, right? I can see Oh, this is going from like Dallas for where it's I think HNL is Hawaii. I'm not fully sure. >> Yeah, it's probably Honolulu. Yeah, >> Honolulu. There we go. Right. So like you can kind of see you've got a charter, you know where the plane's going, you know where it's coming from. When you go look at some of these military planes, that is not always the case.
So this guy's like operator unknown. And this dude is clearly doing what is he even doing? Like I don't [laughter] >> And how how like up to the minute is this? Is this like right now or is this delayed by a few minutes or >> This is delayed literally by one step so I can give people a smooth free flowing path essentially. >> Okay. >> What's cool about this is like Yeah. like while while you're in here um you know God's eye view will tell you what else is in your vicinity so you can see all the vessels and stuff nearby.
You can just like click on this and go take a look at this vessel too which all have unique identifiers and so forth. It it is so much fun. You can have it explain stuff to you as well. Like let's say we go into cockpit mode for what is clearly uh DAL flight. It's like uh I can just say something like hey what flight am I tracking right now? DAL 346 registration N115DN operator is Delta Airlines. >> Got any fun facts about Delta Airlines? >> Here's a fun one.
Delta started out in 1925 as a crop dusting company called Huffen Dusters focused on fighting bowls. >> How cool is that, right? Like so when you go around, especially when you don't know what's going on, you go to like, you know, if I go back out here, I can see like, let me look for a cluster of military activity. you can see, oh my god, there's so much military activity over here, right? Like you could very easily start asking your agent like, why is there so much military activity over here?
And it'll be like, hey, this is like a military base. This is where they do helicopter training or pilot training and so forth. And it's like such a fun way to like collaboratively explore the world. And like uh I I really really like you could spend like hours just [laughter] doing that. >> You mentioned like you can drill in on like a restaurant and see how busy it is. I'm curious. Let's like could we drill into like a specific city and kind of see what sort of view you get when you get really close in on a place? >> All right, let's go check it out.
Hey, can you please take me to the capital building in Austin, Texas, and start a camera orbit around it? >> Cool. Can you please turn on the traffic layer and the CCTV layer? So, this just to zoom out and give you the coverage, that's all the publicly accessible CCTV cameras in Austin, Texas. Yeah. So, basically the way this works is like uh you've got these like in various cities you've got these publicly accessible cameras, right?
And these will give you at least in Austin like one frame every like about 10 minutes for privacy reasons, of course. Like I don't want to be able to like look at Matt's car and track everywhere he freaking went, >> right? Right. >> And so for traffic, the way it works is like TomTom gives you a measure of like how busy traffic is, the the direction of traffic flows, and how dense the traffic is um on any given road segment.
And so basically I color code it. So if you see like just like Google Maps, if you see like red somewhere, that means it's like super dense. And so yeah, Google has very similar capabilities. Um, TomTom does too. Like TomTom's got integrations in a bunch of cars. Obviously Google has Android phones and Google Maps. And so these companies just aggregate and anonymize it to tell you how busy uh any given road segment is.
So the other things it can track is mapped installations. You can also look at dams, submarine cables, and a really cool one is firms. Yeah. Like look at this. like this is like the physical infrastructure like that we're using right now to do this like recording, right? Like using a combination of voice and these layers, you can kind of get this like analyst experience on top of it which is a lot of fun cuz these like models just out of the box have such cool like world knowledge of what's going on.
So there you go. You can see like the magnitude 4.6 in the last 24 hours. These are like the earthquakes that have taken place on on the globe. you you might be noticing all these hot spots over here. One other very interesting data source is NASA firms. So firms basically NASA has these like like thermal imaging satellites in orbit and so they can detect beyond a certain threshold fires that are happening on the surface of the earth.
And so essentially if you kind of zoom into any of these areas, it'll start showing you all the active fires that have taken place that have been imaged in the last window of time over here. And you can go in and kind of like make sense of what's going on in that region. As you can see on Ukraine right at the border right where a lot of military activity is happening obvious obviously between the Russia and Ukraine war you can see like there's a lot of firms detections on here.
So space missions basically lets you go and and see like the recent rocket launches that have been taking place in the US and across the globe. So you could go click on one of these things. It's like all right that's the one. You go to take a look at it and you're like replay. Yeah. So it'll take you to the launch site. You can do a little 321 and kind of see the trajectory. This is approximate by the way. Like I do not have the compute or the physics degree to like figure out exactly the trajectory a freaking rocket took.
But this is like an an approximate way to figure this out. But again, there's like a if you want to go deep down that rabbit hole, you can kind of see. And then now this is like the rough orbit that it's in. All right. So, you know, like obviously beyond just having fun and exploring the world, you can also use this thing to reconstruct real world events, right? So it was really cool for me to see people are using God's eye to you know basically take all this data that gets published by satellite providers and so forth to create like a reconstructions of the Iran flooding that happened.
So you can see over here like you know this is the exact region this went down. This was like you know basically the course trajectory and like the steps through which you know basically the flood went and then uh what you can do is like using your own AI agents and you know like using god's eye as like a basis you can start plotting out the userenerated content that's also being uploaded online because whenever these events happen right like people upload all these videos and then you can basically like play back all the userenerated clips as this trajectory as the flood was moving down.
I I this to me is like a better way to get sense of what went down rather than doom scrolling on X. Yeah. And seeing a bunch of Yeah. a bunch of these clips back toback. But yeah, some of the devastation is absolutely insane. So like >> a lot of this like these things are utilitarian tools too. And in these situations, the commercial satellite imagery providers will actually open up the data so you can kind of get really high resolution like Vantor imagery.
Shout out Vantor and see the before and after of what went down as well. Um, so this is this is um, you know, a very powerful use case of this. And so just to give you another example. So so like obviously drone footage from the NTSB got released. I had to turn it into a reconstruction. You can get everything from like the U. So this is like the ATC audio >> 758. >> So you can see you can obviously play back that and kind of have the NTSB uh, data pulled in here, but then this is like the actual crash itself.
And so, you know, it's like it's it's very powerful when you can take a 3D scan and then take ground level imagery like this and basically line it up precisely with what you're seeing, right? So, you can jump from spot to spot and and see exactly what was happening on the ground and have that spatial like that aerial context. If I click on play here, right? So, this is now doing the rough trajectory of like the plane as it was going past uh the tarmac and the runway.
So, you can see the skid marks over here. It's it's it's kind of insane that we have access to these capabilities, but at the same time, it's like this is this is like what I'm getting excited about is like when things happen in the real world, can we give people an alternative that's sort of like not doom scrolling on social media and also not like one dot on a map with four pe people yapping? Is there something in the middle like civilian intelligence that can really give you a sense as close to the ground truth as possible?
And um you know I think I think this is a great way to do it and I'm super excited about yeah taking this to the next level. >> So here's probably the easiest way to install this and get it running on your own computer. If you go to Bolav's GitHub here, we'll make sure the link is down in the description. You could copy the URL directly to this GitHub repository and then use something like the ChatgPT app or the Cloud Code app and essentially tell it to install it for you.
So I'm going to create a new project here inside of the ChatgPT app. It'll be a local project. I'll click next. And let's just call it God's Eye View. I'll add a folder that it can read. And then I'm going to create a new folder called God's Eye View. Make sure this folder is wherever you want it to be on your computer. And then we'll click create. And then we'll open this empty folder. I'll create the project. And then I'm simply going to give it a prompt like clone this GitHub repo.
Read the instructions. Install all necessary dependencies. and then tell me what I need to do to finalize the setup and get everything working. And then I'll go ahead and paste the link to the GitHub repo. Submit that and we'll let our agent do the work for us. And it took a little less than 2 minutes here. And we've got it installed. So to finish the setup, it just says open up PowerUp and provider settings and install whatever API keys we want to install.
And it even opened it for me right here inside of my chat JPT browser. But if I want, I can actually copy this URL and pop it open directly in Chrome as well. And right out of the gate, I could start using it immediately, zooming in and zooming out and seeing the whole Earth. But a lot of the data layers aren't going to work until we start setting up the various API keys. So again, let's click into power up here. And each one of these keys has a little link that says get key.
You click on that, it'll take you right to the spot where you can grab the key for each of these APIs. All right, so I've got all my API keys set up in my powerup section. And now it's crazy what I can do. I could turn on live flights and see every single flight that's going on right now, pretty much all over the world. This is just commercial flights here. I could turn on military flights, and you'll notice it'll make those show up in yellow.
I could see where every earthquake that happened today happened. I could turn on satellite view and find all of the satellites that are in orbit right now. I could turn on space missions and see where all of the space missions are launching from in the near future. I could speak to it and say, "Zoom into San Diego for me." And we could see we're in San Diego. Now, let's turn on street traffic. And we can see where all of the cars are driving right now on the streets of San Diego.
I can turn off street traffic and turn on CCTV and find where all the CCTV cameras are around town. I can see where that camera is pointed and I can see what that camera is currently seeing. Want to know where all the data centers are in your area? I could flip on data centers and see exactly where all of the data centers are located. Let's zoom into San Diego and you can see we've got a handful over here. Submarine cables.
Want to know where all the cables are running under the ocean? I could see that as well. What about vessels on the ocean? Yep, I could go and look at all of those. We could find all the hot spots where there's currently fires going on. So, yeah, I think this tool is just amazing. I think it's so cool that pretty much anybody can build stuff like this now. And we're in a world where privacy is becoming more and more scarce.
With cameras getting put up everywhere and listening devices all over the place, we've kind of lost control over our own privacy and what people can see and know about us. And with tools like this, it kind of feels like it's putting a little bit of power back in our own hands. Like we now have information and data and can track stuff and can have better understanding of the world around us. and we're in this place where it feels like we're getting privacy removed.
It's cool to be given access again and stuff like this feels like it gives us access and you know again it's just really fun to play with and kind of feel like you're a spy and can like look into anything and in a very very harmless way too. I don't feel like I'm you know stepping on anybody's rights or privacy by using a tool like this. I just feel like I have more access to information at my fingertips and I think that's pretty cool.
So, I hope you enjoyed this video with me and Balavo. I do plan on making more videos like this where I collaborate with people building really cool stuff and really try to highlight what they're building, get them to explain why they're building it, and then deep dive into the actual thing itself. We have several more like this on the way. So, if that's something that might interest you and you want to find out about really cool tools and workflows that other people have built, make sure you like this video and subscribe to this channel.
That'll make sure videos like this pop up in your feed when they come out. Also, I do make a video every single Friday where I break down all of the news in the AI world. So, if you want to keep your finger on the pulse of everything that's happening in AI and you want to do it with just one video per week, well, I put those out every Friday. So, that's another good reason to maybe like this video, subscribe to this channel cuz it'll make sure those show up for you as well.
Anyway, that's what I got for you today. Thank you so much once again to Balavo for jumping on with me and breaking down what he built and how he built it. I'm going to link to his channel and where you can get this on GitHub all down in the description. So, make sure you check it out. It is 100% free to use and I just want to highlight cool stuff. So, thank you so much for hanging out with me and nerding out with both of us on this video today.
I really really appreciate you and uh hopefully I'll see you in the next one.
The words are the caption track's own and nothing is reworded or re-transcribed. Paragraph breaks are placed between sentences so the text reads as prose.
Free tools for your own script: paste a draft and see where it stands before you record it.
Paste your draft and see where viewers are likely to drop off, with a rewrite for each weak line.
Paste the first 30 seconds of your own draft for a hook score and rewrites.
Check your draft against YouTube's advertiser-friendly guidelines before you record it.
Read this channel's public videos and transcripts, and download a writing brief for it.