Getting the transcript
Reading the captions from YouTube. A video nobody has opened here before takes 10 to 30 seconds; this page fills in on its own.
Getting the transcript
Reading the captions from YouTube. A video nobody has opened here before takes 10 to 30 seconds; this page fills in on its own.
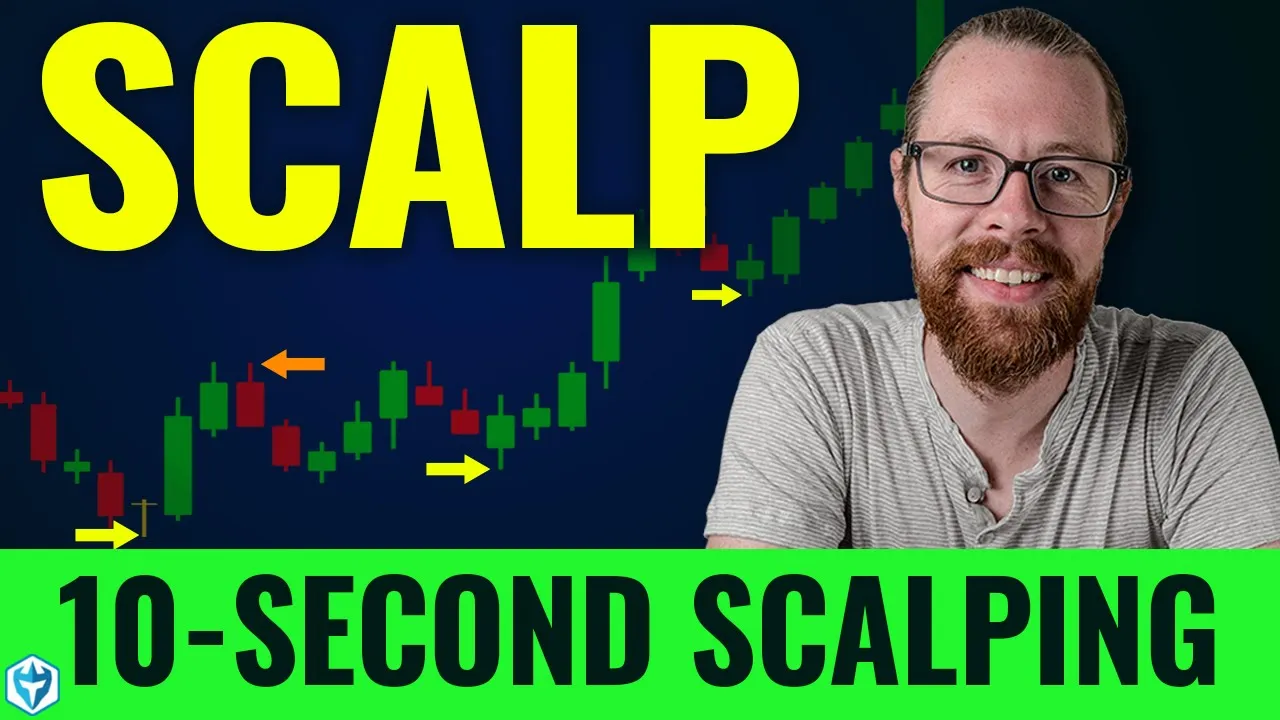
Ross Cameron - Warrior Trading · @DaytradeWarrior
Where viewers went back to watch this video again, from YouTube's public Most replayed graph, lined up with what was said at that moment.
Most replayed moment #1
31:082.5x the video's typical replay level
so when this first hits my scanner I'm looking at gnln and I'm thinking does this meet my criteria so I'm looking at the percentage change I'm looking at the symbol do I recognize it I don't recognize it I'm looking at the price
Said at 31:02
Most replayed moment #2
10:472.4x the video's typical replay level
can 8 cents a share give a total gain here of $267,000 this is before taking away the losses how is that possible well think about it well so what is the average um the average winning trade the average winning trade is
Said at 10:39
Most replayed moment #3
37:072.4x the video's typical replay level
see it popped up to 484 it dips down it goes back it dips down quite a bit to four so that's the 70 Cent drop then it comes back up to 474 and then it dips down again and right here as it broke through that level I said all right I got to jump in so I bought 1,500 shares
Said at 37:00
The graph counts replays. It does not show where viewers stopped watching.
Words
11,236
Runtime
59:52
Speaking pace
188wpm
Reading time
47min
188 words per minute, between the 181 median and the 201 75th percentile of 349 measured videos. That distribution comes from the 349-video hook study.
Opening (first 30 seconds)
in today's episode I'm going to teach you a variation of my scalp trading strategy where I focus on using the 10c chart in order to capitalize on the fast price action that occurs when a stock has breaking news now today I am more than double my daily goal which means I'm going to teach a fulllength class where we will use today's trades as a case study for how to use the 10-second chart and how to scalp breaking news now let's go ahead and jump onto the screen share you're going
94 words, the words spoken in the first 30 seconds at 188 words per minute.
Free, no signup. See how the first 30 seconds hold attention, with rewrites.
Sentence shape
| Measure | This transcript |
|---|---|
| Sentences | 1 |
| Average words per sentence | 11236.0 |
| Longest sentence | 11,236 words |
| Questions asked | 0 |
| Sentences containing a number | 1 |
Most used terms
Filler phrases
293 in total: um 72 · like 61 · uh 55 · you know 40 · kind of 23 · sort of 19 · actually 13 · I mean 6 · basically 4.
A literal whole-word count of the same phrase list the Prepublish browser extension uses, so a phrase inside another word is not counted and a phrase used in its ordinary sense still is. It is a count and not a judgement.
Free, no account. See where attention is likely to drop, with a rewrite for each weak line. The free check shows the scores and the one issue costing the most. Or run it on the words above first.
Free · No login · See a sample audit first if you prefer.
What this transcript is
Every word below is the caption track YouTube publishes for this video, pulled from the video itself and reproduced unchanged. It is not Prepublish's writing, not a summary, and not a re-transcription: it is the video's own published captions. English captions, generated automatically by YouTube, in the video’s original language. Source: the video on YouTube. A channel that would rather this page did not exist can ask for its removal through the contact page, and it is removed.
in today's episode I'm going to teach you a variation of my scalp trading strategy where I focus on using the 10c chart in order to capitalize on the fast price action that occurs when a stock has breaking news now today I am more than double my daily goal which means I'm going to teach a fulllength class where we will use today's trades as a case study for how to use the 10-second chart and how to scalp breaking news now let's go ahead and jump onto the screen share you're going to see that I'm currently up $ 24,829 2 the topic of today's class is scalp trading breaking news and we're going to do it using the 10c chart now for those of you who have never traded with a 10-second chart you can still scalp trade by all means with a 1 minute 5 minute chart combination and of course using level two however I want to show you how you can use the 10-second chart to get a little bit of a jump on other traders who are focusing only on one minute or 5 minute time frames now there are a lot of advantages to scalping using a 10-second time frame but you have to have the right tools and the tools are not just charts there's a number of other tools that you need in order to scalp in this way correctly I'm going to share those with you as we go into this episode so let's go ahead and put this up on full screen here so let's let's go ahead there we go all right so we got full screen now this is today's trade this was absolutely incredible this stock had 13 consecutive green candles on the one minute time frame this is a one minute chart 13 green candles in in a row it goes from $2.50 up to a high today of 1080 nearly 300% return I'm up $24,000 on the day 21,000 is thanks to this stock and for those of you guys who tuned in to my weekly game plan episode which I upload every Sunday and this is for those of you guys tuning in on YouTube but also for warrior Pro members I said this is why I'm going to show up every single day because you never know when we're going to have breaking news but last week was relatively slow we had some stocks that gave us some moves but none of them were big in fact we're early in the month right now it's the it's the 12th and I've only had one day this month where I broke my daily goal and we're like you know well it's the 12th but we're we must be seven tra seven trading days into the month today is the eth trading day so only one out of those seven days I broke my daily goal now the other six days were all small green days these were base hit days and for those of you guys who were tuning in I was trading on my traveling trading station from a small little boat house on an island off the coast of New England and some people are like why are you even showing up to trade you know you're traveling you're on vacation you're only making $400 or $1,500 and I said well I you're right but you just never know when there's going to be a stock that has big news and puts in this you know Monster Squeeze and that's exactly what happened today so this 15minute window right here from the beginning of the move well 13-minute window this these 13 green candles in a row this right here added more than doubled my profit on the month right this was a huge Green Day for me so the topic of today's class is I'm going to talk about the definition of scalp trading how to scalp I'm going to talk about how to use the 10-second chart as a scalp Trader I'm going to share with you my scalping strategy I'm going to share with you the tools required to scalp because you got to make sure you've got the right tools and I'm going to give you my recommended reading list for those of you that want to continue learning through this episode I'm also going to share links to a number of other videos that you guys can check out that are related or sort of a tangent to uh the the specific topic Okay so number one what is scalping so I I think most of you probably understand this but for those that perhaps don't scalping is a fast trading strategy that involves quickly buying and selling shares in order to profit from relatively small variations in price in order to generate substantial profits from small variations in price Traders generally use larger positions so let's say for instance we got the Whiteboard here let's say you're looking at a stock that's trading at you know $485 and this was the first PR this is where I got in um uh gnln today that was my first entry is right around 485 so if I'm in this hit 485 and let's say I take profit you know that's that's my buy and my sell let's just say is $5 that's 15 cents a share so 15 cents a share so you know H how much money is that well if you're trading with shares it's $15 if you're trading with a th000 shares it's $150 if you're trading with 10,000 shares it's $1,500 right ,500 something like that there's the comma so it's this is the sort of idea with scalp trading is that these small gains yes with small size they're relatively small but most traders who are scalping will increase share size up towards maybe not 10,000 right away for most Traders but up in the 2,000 to 5,000 share range that's where a lot of people kind of get comfortable and then when they see something that looks good maybe they'll scale up to 15 25,000 shares so one of the things um that is interesting is that the exposure risk of scalping is reduced in part due to the limited period of time a Trader is holding a position right you're yes you're holding 10,000 shares but how long is this trade less than a minute maybe maybe two minutes it's such a short period of time that your risk one factor when you're thinking about risk in trading is how long you're holding a stock right if you're going to hold a stock for a week you're taking a lot more risk than someone who who's holding it only for an hour even with the same amount of money and that might be hard to kind of understand because it's like $10,000 of risk is $10,000 of risk but taking that risk over the course of seven days the whole day all night that something could happen news could come out in total that is a lot more risk that you're taking than someone who's buying and selling getting in quickly and jumping back out and so one of the reasons that scalp trading was really a well I'll I I'm going to tell you why it was appealing to me in just a second so I'll just stay on track here okay so most scalp Traders will aim for high accuracy most scalp Traders will take dozens if not 100 plus trades in a day but you need the right tools to scalp trade and scalp Traders must enforce strict stops on their trades a stop is your max loss you have to have a Max loss on your trade because if you let your losers get too big it's going to be a problem so when we talk about what makes scalp trading risky it comes right back to the same point that you have to use larger positions and so if you're in a 10,000 share position and you have The Misfortune that in that moment the stock drops 50 cents a share you're down five grand like that so scalp Traders have to enforce really strict stops on their trades otherwise the losers will be larger on average than the winners and this is very common negative profit loss ratios are not uncommon for Traders that are scalp trading a negative profit loss ratio is when your average losers let's say are you know 500 and your average winners are you know 450 something like that here your losers are bigger than your winners so you've got a negative profit to loss ratio this is very common now a slightly negative is okay something like this where your winners are 250 and your losers are 500 that's most likely not going to be sustainable or a profitable strategy for most beginner Traders it's just too inverted in fact with this you would actually need to be right 66% of the time before commissions just to be break even now to give you some context of you know where I'm at in terms of my um metrics I'll show you right now let's see um so I'm going to this is the software that I use right here and as I mentioned you can see the last few days which the trades um the profits were relatively small so we can just look at um we'll just look at the last 30 days right here just to sort of pull some metrics so last 30 days profit loss ratio so average losing trades $323 average winning trades 574 so that's a positive profit to loss ratio right and the accuracy is 67% average hold Time 5 minutes for winners 4 minutes for losers losers this these are really nice metrics now the reason this all accumulates to $196,000 of profit over the last 30 days is because of the number of Trades I'm taking 692 right now if I was only taking let's say 10 trades then no doubt 10 you know I would only be up a very small fraction I mean 10 you know if I traded 70 trades I'd be up $199,000 just based on 10% so one of the things that makes scalp trading really appealing is the fact that it's a lot easier to earn 10 cents per share on a trade than to earn a dollar per share on a trade and there are a lot more opportunities each day to make 10 cents per share than a dollar per share and that's how in 30 days I was able to come up with 692 trades 692 in individual trades over the last 30 days that's a lot of Trades but the fact is when you're setting your goal at only 10 or 15 cents per share it's a lot easier to hit that now if we actually look here um we can compare over the same period of time just for the sake of looking at these metrics in a little bit more depth we're going to look at winners versus losers but um the date range will be just last 30 days so we'll just do the last 30 days here winners and losers generate report and what you're going to see here is my average winners are about 8 cents per share my average losers are about 7 cents per share which gives you know approximately one:1 ratio on the average winner to average loser but 8 cents a share how can 8 cents a share give a total gain here of $267,000 this is before taking away the losses how is that possible well think about it well so what is the average um the average winning trade the average winning trade is $574 so so where's my phone so just this is just really quick math it's I could probably more more or less do it in my head but just to give you the exact number so we're trading um let's see so $574 average winners divided by 8 cents so that means my average position size is 7,175 shares for the last 30 days okay so right kind of in this zone right so we'll we'll make a new we'll make a new one here just custom for me so 7,000 175 shares equals $574 okay so now you do that 650 times within the last 30 days and boom that's $267,000 of profit minus the losses still up 196,000 over the last 30 days okay so I think the the big uh takeaway here is that there are a lot more opportunities each day when you set when you set your standards lower and I'm saying standards it's a little demeaning uh to the trades I don't mean off fence but a scalp Trader is going to be willing to trade setups that someone who's trading on the 5 minute or 15minute chart would never consider and to be honest let's look at the five minute or 15minute chart on uh gnln all right so this is the FIV minute chart where would you have taken a trade if you only used the FIV minute time frame maybe right here that's the first five minute pullback but you're really extended off of your moving averages let's switch to the 15-minute chart it's just going to be the same the 15-minute chart is going to show you zero potential entry basically a giant Spike up and a pullback now maybe we curl later but a 15minute or a 5 minute Trader would have missed this entire 300% move now is that okay listen if that's your strategy by all means trade what works for for you for me I don't want to miss a 300% move if a stock goes up 300% in one day I if I'm not capitalizing on that I feel like I'm messing up I'm doing something wrong that's just me so then the question now is if you're interested in scalping and you want to trade these types of big percentage movers how do you do it how do we approach it so um so I'm going to add a couple more things for the pros of scalping um number three I would say it's the only way to trade a stock that has already extended Beyond a safe entry for someone trading on a longer time frame like the 5 minute or the or the 15 minute time frame and it's one of the only ways to trade breaking news if you're not scalping trading breaking news is going to be almost impossible and it provides for me almost instant resolution when it works and this is what I like so now let me tell you why I found scalp trading so appealing when I was getting started so when I got started spam call whatever so when I got started I had a relatively small account and I was trading with money that I had gotten from my father when he passed away now some people occasionally are a little bit confused about sort of my my history of trading so I took my first trades in the late 1990s during the do com bubble during a school uh semester that we had that was dedicated to the stock market now those were paper trades I was practicing but I started as a teenager I opened my first account when I was 17 years old 16 years old this was in um while I was in high school that was my first real money account and then I didn't trade for a few years I took a break and my father got sick he had cancer and he passed away and then I when my youngest sister turned 21 which was a few years later we each received $100,000 which was at that time an incredible amount of money I didn't know what I was going to do with it initially so I ended up not doing anything with it at first I just put it in a money market account and that was uh that was at a time when the the overall Market was terrible so over the course of about two years in a money market account it lost value it lost money at that point I kind of thought to myself maybe and this is very naive but I thought maybe if I manage that myself I could earn enough money on growth each year that it would cover my cost of living and since I had this friend in high school who had made $16,000 on a penny stock I thought if I could just do this three times a year I would be golden so initially I set up an account with E Trade and I put in like 5,000 bucks and right away I got flagged PDT pattern day trader rule I took too many trades and so I was like all right well shoot so I added more money to 25,000 so I had enough money to day trade now I later learned about the offshore Brokers that a lot of people use but at that time I didn't know about them so I put in 25,000 had you know just above that level and I just kept trading and you know what ended up happening for me was every couple of weeks my account would drop below 25,000 and have to add more money and I'd make a little money make a little money and then I'd lose it I'd make a little money make a little money I'd maybe spend some of it to pay bills and then I would lose it so at the end of my first year I had made some profit but I had spent everything I made and then I had some taxes the next year I went net negative and my cost of living I was putting on credit cards so I wouldn't have to take money out of that trading account to pay my bills so I ended up depleting everything that I had gotten from my father down to the $25,000 account but I had $30,000 in credit card debt I then took a $5,000 loss on the first week of a new month it brought my account down to about 19,500 and I couldn't day trade and at that point I was like oh my God what am I going to do so that for me I had to kind of Hit That Rock Bottom in order to have my Catalyst my turning point which I'm grateful for the sad thing for some Traders is that they'll start with 200 $300,000 and they'll lose all of it before they hit rock bottom and it's not until sometimes you hit rock bottom where you feel forced to make a change it's kind of like the pressure of those circumstances forces you to really analyze what you're doing and so at that time I analyzed what I was doing I was looking at my strategy I was trying to figure out what was working and I discovered that the stocks I was making the most money on were in this sort of very specific uh price range very specific range of float which I'll talk about in a second when I talk about stock selection because I continue to trade those types of stocks today but because my account was basically now on its last legs I I thought to myself if I could just focus on sort of snipe entry like get in get out get in get out like don't hold don't hold anything overnight because I cannot afford to lose more of my account I actually sold things that I had in my barn to raise money I sold things on Craigslist to get my account back to 25,000 so I got it back to 25k by selling stuff in my garage in my barn and I was like okay this is my last shot so I have to be a sniper get in get out and so that kind of brought me to the approach of just taking quick entry quick exit quick entry quick exit and if I could just take one or two trades a day and I was small green that would be building a track record so in those days I wasn't using the 10-second chart that wasn't even an option so again if you don't have access to the 10-second chart I don't want you to feel that um this is not applicable to you because you can still scalp trade breaking news without it but um but let's talk about how to use that 10-second time frame so when it was about gosh I don't know how many years ago it was now that I started using the 10-second chart um I never used it never used it and then I don't know maybe it was three four years ago uh I I noticed it was even an option and I was like that's that's crazy and I heard about a couple other traders who were using um short time frames and sort of unusual time frames I heard of some people using like a two-minute chart or a three minute chart and I had never used those either and then I heard some people using like a 30 second chart and a 24 second chart and then I just noticed that um if I clicked on time frame I could go down to it a 10-second chart so 10-second chart here we've got 10 15 24 seconds here so when we built day trade Dash which is the software that you see on my screen I said for our charts we've got to have 10-second charts because I I at that point been using them with e signal now e signal is um is a platform that I used for many years almost probably 10 years um it it's a it's a popular piece of software but it's also a bit um I guess I'd say it's a bit old at this point uh a bit dated and they charge $172 a month for it which is a lot of money just for charts because their scans aren't that great um they do have a news feed in there but anyways it's mostly just charts so so when we bu out day trade Dash we included a 10-second time frame and you can get uh 10-second charts on trading view I think it's $75 a month because you have to have the highest um subscription to get those charts if you subscribe to day trade Dash uh you could get them as well but anyways wherever you get them it doesn't matter but the 10-second time frame I find uh to be helpful so the way I have my charts laid out is I've got my 1 minute my 5 minute my daily and then I've got my 10c chart right down here in the corner and for some trades I don't even look at the 10-second chart I'm not even thinking about it I'm not even not using it at all but there are other trades where I'm using it um quite a lot so let's sort of zoom in on what this looks like if we look at let's start so let's start with um GL gnln looking at the one minute chart so this is the one minute chart if you're trading just on the one minute chart where would you have taken your first trade maybe right here right maybe that sort of micro pullback there at about 750 I took my first trade at 485 right down here okay so no doubt that was $2 a share earlier than someone who just uses a one minute chart right so how did I know to buy right here it's kind of a funny spot to buy it is a funny spot if you look at the one minute chart but let's look at that on the 10-second chart so on the 10-second chart we get zoomed in here and what you're going to see is right at four about 485 we had this little pattern what does that look like this to me is sort of a primitive imperfect ABCD pattern pop up pull back back up back down right through that level okay so that right there that entry right there is actually an ABCD pattern and now it's incredible because you wouldn't see that on a one minute chart but now you can see it here on the 10c second time frame it pops up to $6 it pulls back and then this is a flat top breakout it's even a first pullback right here off of 550 and then we go up to seven and then we have this pullback at seven which was fine goes up to 750 another pullback right here and you're continuing to trade all these pullbacks as it squeezes higher so each of these pullbacks represent opportunities to trade this and we'll go we'll actually dive into the trades in a little bit more detail in just a moment but that's the reason to use the 10-second chart now having said that if you're scalp trading breaking news what you're really looking at most of the time is your level two window right here this is what you're watching your level two window and your time in sales because this is going to show you all of the buyers on the bid all the sellers on the ask and the flow of orders that are going through so even if you weren't looking at candlesticks at all you were just looking at the level two and the time in sales you could start to create a a a mental image of what the chart looks like so right now as I look at this I know we've got a high of about 790 798 a low of about 787 so I can already start picturing kind of a single candle here and the longer we watch it the more I'll kind of remember oh we just popped up to 8 or to 810 or to 815 that's the recent high or oh the recent low was 770 and you start getting a mental picture now if you think back at some of the the Traders uh in the older days who were tape readers they were they didn't have charts when you're talking I mean you're talking about a hundred years ago traders who were trying to actively trade on the market didn't have access to computers in these stock charts that we have today but what they could do is they could read the tape there was a Consolidated ticker tape and that would produce a flow of all the orders going through so they would they could subscribe to it and it would come through almost through like the telephone lines and they would get this print out on a piece of it almost looks like Scotch tape a roll of paper that comes out and it's just printing the symbol and the price symbol and the price so it's it's making this kind of print it like a almost like a typewriter sound but it's a little bit more um anyway so uh so I I have one I don't have it in my office but it's an old one from I think uh I don't remember the year early 1900s nonetheless so those those people were trading and creating a chart based on just what they were seeing so they were visualizing this was the recent high this is the recent low okay we're mapping out if we break new highs we're breaking resistance we should get a move higher right so in a way as a breaking news Trader that's exactly what I'm doing and and even to further emphasize this when I trade an initial public offering when we're trading an IPO you know what the chart looks like let's pull it up so when we're trading an initial public offering let's say it's you know doesn't matter which one it is it's initial public offering the chart looks like that so it looks like there's absolutely nothing and I got to close this because this isn't here either so just hide that you've got nothing and then it starts with just one candle and so you're working with basically nothing and at times when I've traded initial public offerings and this was a few years ago many years ago now uh the software I was using before E signal which was tc2000 um sometimes didn't load the IPOs correctly so I would actually trade the IPO without any charts at all I was trading it just using level two time in sales and I was just visualizing what was the high what was the low so it is possible to trade without charts I wouldn't recommend it but it is possible the problem of course is that you'll have no idea what daily support or resistance looks like right and now with an IPO it doesn't matter because there's none but with a stock that has breaking news that that would be a problem okay so now let's get back into um gnln and we're going to start to do this case study so my scalp trading strategy could be broken down into five steps like all of the other strategies that I have these are the five fundamental steps and we're going to analyze exactly how I proceeded through each of these steps before I took my first trades on gnln so Step One is finding the stock so how did I even find gnln that's step one you've got to find the stock that's moving so the way I found this was right in this software right here but you could I mean you could use other scanners or whatever some people might have found it on social media but you would have been a little slow to find it there because someone first has to see it on a scanner and then post it uh but what ended up happening was right at 8:30 this started hitting my high day scanner now it would take a while to scroll all the way back but you see when these stocks hit the scanner it looks like this you get this alert and depending on which scanner it's it's hitting the color will be different so we get these different scanner alerts these are these scanners are searching for different things in the market that I've told them to look for and they're very obedient they look for just what I asked for um you could turn on your audio alerts on these you set your alert to whatever you want you save it I set audio alerts only for some of the scanners not for all of them so low float High relative volume low float former Momo stock squeeze alert up 10% in 10 minutes right so you go back and if we went all the way back you would see right at 830 exactly at 8:30 gnln started hitting the scanner at about $256 or 58 cents okay now at that point gnln was at the very beginning of this move so let's go back to kind of what we're going to do here is we're going to dissect these 13 candles the beginning of this move and go kind of candle by candle I'm going to show you my trades and what was happening in each of those moments okay so this is going to get us zoomed in here on the first candle all right so we'll go Auto like that auto like that auto like that and this at the time was our daily chart so I pulled up the daily chart looks like I accidentally put text there so the first thing that I noticed on this gnln hits my scanners all right so step one we've now found a stock okay now it's not a 220% Gainer yet at the time that it first fires off it's up about let's see when it was hitting at 285 so right here it starts popping up at this point it closed yesterday at or Friday at 240 so by the time it's up to 260 it's up 10% you know 280 290 it's up about 25% and this morning we had um a bigger mover PSIG up 20 uh sorry $215 up 100% I actually lost on that that was my first trade of the day so I went red on PSIG and I can talk about that trade uh in a moment at the end of this um case study if if there's time and then uh I made back that loss on trnr so ended up by the time GL gnln came up I was up about $3,000 on the day between these um four trades four stocks I had traded so I was in the green but we didn't have anything that was really at that moment looking phenomenal and then all of a sudden gnln hits the scanner so step one I see it hitting the scanner and I know that it's the right type of stock to trade now how do I know it's the right type of stock to trade I know because I have a very specific set of criteria that I search for every single day so the skills required to complete Step One is an ability to know how to use stock scanners and and an ability to understand what type of stocks have the potential to make big moves now for warrior Pro members you're going to find more about this in chapter three of the warrior pro day trading strategies and scaling course uh for those of you guys checking out free content on YouTube You'll see this class has more info about it as well uh number three you need to know the type of stocks to avoid so when this first hits my scanner I'm looking at gnln and I'm thinking does this meet my criteria so I'm looking at the percentage change I'm looking at the symbol do I recognize it I don't recognize it I'm looking at the price the price is fine and by fine I mean it fits within my uh my criteria so my criteria here is going to be generally speaking I want to be Trading price between 2 and 20 I want to trade percentage up at least 10% on the day relative volume at least five I like to see that there's news so that should just be positive and I like to see the float is under 20 million shares and I know that lower is of course better for the imbalance between supply and demand so in this case these are my sort of preferences and our actual was float something like 500,000 shares news yes relative volume met the criteria the percent was already about 25% when I was first looking at it and the price at that point was about $3 so check check check check check check check we met all of the criteria that I felt for uh basic stock selection okay so so that's good so that checks out so then the next step is trying to understand why the stock is actually moving up and so step number two is to check to see what the news catalyst is now gnln has a news announc this non-binding letter of intent to be the exclusive distributor in the US of safety strips Incorporated Fentanyl and whatever this is and drink Spike detection test strips so you know that's that's interesting I mean it's a it's obviously a headline I didn't really when I first saw it I was like well at least there's news here at 8:30 right at least there's fresh news that's better than we can say for some stocks and you have to have an ability to understand the different types of news headlines that come out because some don't move the market at all and others have very significant um impact on on price so you also have to have an ability to separate logic of the news from the price action your logic might tell you I don't know about this news headline it's it I don't really like that but the price action is the Stock's going up 200% focus on the price action stay away from trying to overthink it and you have to have an ability to understand fundamental analysis and SEC filings so you can go in you can try to understand you know is this a stock that has a high likelihood of doing a secondary offering are they going to raise money on the market are they going to sell shares uh you know what's their balance sheet are they losing money right now what's their cash position so you know this is all an important uh Factor especially when you're thinking about uh taking a trade for day two of continuation so then um so so we did our sort of initial due diligence here and we identified there is a catalyst there is a headline and that's why it's spiking up right here at 8:30 which makes sense and it goes immediately uh in 2 minutes from 250 to 350 to 4 and 450 I was like holy smokes that is crazy so it hits 259 and then you have this red candle that drops back down to four now as I pulled it up right here I started watching it and what I noticed was that the spreads were a little bit bigger so now I'm starting to do a little bit of um step three uh technical analysis all right so we'll I guess we don't have to be full screen so technical analysis is the process of analyzing dissecting the charts looking at the volatility looking at the position of the moving averages the skills required to perform technical analysis is an ability to understand Candlestick shapes patterns your technical indicator support resistance and buy and sell signals that's an episode with 1 Point 7 million views that's been pretty popular on how to read Candlestick charts with zero experience for warrior Pro members where you're going to want to go here is into your members dashboard right here and then into um Education portal and by the way I have nine new uh sections that are getting uploaded right now which you guys will be excited to see and then you can go into uh day training the basics but for those of you that have access to strategy and scaling you'll want to go into strategies and scaling launch the course and the intraday chart patterns is where we're really going to get focused these are all the intraday chart patterns we're going to look at then we course get into uh chapter 6 level two tape reading chapter 7 Gap and go chapter eight momentum trading and we've got some new setups that are coming here and then that continues into day trading strategies and scaling part two so that's where you guys want to go all right so so back here so so we start doing the technical analysis and I and I also at this point pull up the level two so I'm beginning to look at the depth of the market I'm trying to visualize the price action and the first thing I look at when I pull up level two is I look at the bid in the ask I look at the spread we've got a 5cent spread right here 780 to 785 so now when I look at something like that and I pull up my uh my whiteboard here I'm thinking all right can I take 7,000 shares of this right well if we have a 70 Cent spread right 7 time 7 I'm going to be risking 5,000 bucks on the spread with 7,000 shares so I can't take 7,000 shares if we have a huge spread but you know if the spread tightens up then I might be able to so I'm starting to kind of make the decision of how much am I risking how much is my profit potential and what kind of share size can I take okay so on this I'm starting to get in here and I see it popped up to 484 it dips down it goes back it dips down quite a bit to four so that's the 70 Cent drop then it comes back up to 474 and then it dips down again and right here as it broke through that level I said all right I got to jump in so I bought 1,500 shares as it broke this level right here I took a starter at 473 and I added at 483 and 490 which gave me about a 483 average on this first trade it ends up going up to 515 so we Zoom this in here so at this point I'm I'm really just looking at the 10-second chart and I'm watching the level too we hit 516 and I add at 516 and this thing spikes to $6 on the offer $6 now remember my average is about well now cuz I added at 516 it's come up a little bit but it's I still have a great average at under $5 a share okay so now let's see so now that was my first entry I end up taking profit the best exit I filled was 460 shares at 586 which was pretty good I sold a little bit more at 547 and then it starts to dip down here you can see it dips down and I take some more profit at 534 and at this point I'm up a couple thousand on it I'm you know I'm kind of like I'm a little bit unsure what to think because it's a big topping tail and we sort of dropped back down to 520 but at the same time the trend is still clearly positive so at that point I glanced at my one minute chart I glance at the one minute chart and I see that we've got this Spike up to six right but the one minute is now just showing four green candles in a row we haven't even had a pullback yet so I'm thinking all right this thing is just just very very strong this is really impressive so we go sideways um a little bit more right here and I end up adding back we have this dip down here so I added back 1500 shares uh right about here at 557 and I add at 565 and 571 and 580 so now I'm scaling in and I'm looking for that break through $6 it comes up I take some profit up around six it dips down it pops over six and right here we squeeze up I'm going to go Auto we squeeze up to 620 655 all the way to $7 a share unbelievable as it starts to pull away right there I had taken some profit around six and then I added back as it pulled as it pulled away so adding back as it pulled away uh basically what I do is I watch to see if it can hold this whole dollar and it did and so I added with a stop right under six so if we talk for a moment about stops the entry right here the stop was the low of this candle here so 1500 share starter stop is 440 so I'm risking about $500 not quite on that entry then when I'm adding up here I'm moving my stop up a little bit and then I add more and now my stop is break even so I start moving my stop order up now a beginner trade trer is not going to be as likely to want to get into adding to positions most beginners are going to want to take one entry one exit get in get green get out once you've done that for six weeks eight weeks just a one trade a day just you know one entry one exit you've built a track record of success now you can start doing two trades a day three trades a day four trades a day and increasing and truly you can make a re you can make a living on just 15 cents a day out of the market you don't need to be getting a dollar a share 15 cents a day with a th shares is making a great living now I'll say as always my results are not typical and of course trading is risky I think you already know that it goes should go without saying uh but I'll just reiterate it here I have been doing this for a long time and we're going to talk about some of the skills uh required here at this sort of next phase because now what we're getting into is step four which is actually executing your orders taking your trades buying and selling all right so in order to buy and sell you need to clearly know how to use trading software with hot Keys hot Keys allow you to to rapidly enter and exit positions just by pressing the keys on your keyboard let's see I can pull this forward here so just by pressing shift one I could be buying crl x contrl z is selling so one button to buy one button to sell well it's two but it's one hotkey shift one to buy control Z to sell two hot keys to start is all you need then you can start adding more as you gain more experience uh you need to be really good at reading level two and tape reading this is um a a large section of the warrior Pro curriculum um is dedicated to tape reading because it's so important that's chapter six so chapter six here is where we get into tape reading level two um and you need to be able to read of course um the tape and you need to have fast reaction speed you see something you press the buy button you see something you press the sell button so that that's really required and I think efficient order execution is important as well you wouldn't want to trade try to trade this strategy at least on a mobile app on your phone there's there's just no way you're going to be able to keep up with Traders using better tools than you and to that extent you know you are sort of competing with traders who have better tools now it's not it's important to say that it's it's not like there's a Rolls-Royce of trading tools where oh that guy's got the best tool and he's got such an edge over everyone else it's fairly Level Playing Field when it comes to tools because there's only a few tools you can choose from when it comes to trading a lot of the members here at Warrior trading are using thinker swim and are really happy with that I think the majority of our million-dollar badge holders achieved it with thinker swim which is great I use light speed which is a broker I've been using for many years I'm happy with them I think they're a great broker but I do pay commissions on my orders so that's not ideal but the the execution speed is is very fast anyways efficient execution speed is important but if you're scalp trading commissions are also something to consider because if you're taking a 100 or 200 trades in a day yeah you've got to be thinking about commissions okay so we'll move this back up here so um so when I'm so so at this point um we get our first couple trades on gnln and we get this pop up to seven right here so I end up adding um for the squeeze to seven I take some profit at 675 it dips down um so we're going to start getting dialed in here so the so initially that was the stop added back here when it was at 547 stop was about 520 lower that pullback added up around six and I was using level two to visualize that there was support at six then it goes up to 640 650 all the way up to 7 it pulls back micro pullback here we get this false break over seven and we dip back down so that was the first kind of like oo are we going to have a red candle form and at that point we still didn't have a red Candle on the one minute chart the one minute was just green candles it was ridiculous I I was like I don't know the last time I saw this many green candles in a row so when it got back above seven and held retest there that's the spot to be adding back for the squeeze higher now a lot of this um for those of you guys who are listening on YouTube uh a lot of these pullbacks are are part of my micro pullback strategy which you can trade both on one minute but also 10-second time frames so I would encourage you to download my micro pullback strategy as a PDF so so micro pullback strategy PDF that will be linked so there'll be a link here um that sort of Link symbol whatever that'll be linked in the description and it'll be linked in the top of um the comments so top pin to the top comment and Link in the description all right so check out the micro pullback strategy PDF if you haven't already so then we get another little dip right here that's micro pullback off of seven and it goes up um to 750 now it does dip back down to seven here and then it pops up 750 pulls back a little bit more and then all of a sudden it rips through this level 756 up to 8 now at about about this point where was it so about this point here I started thinking this thing is really due for a pullback yeah it was around 760 so I was like this thing is really due for a pullback um this candle actually dipped down and it went red and then ripped back up which sort of had the effect I think of trapping some early short sellers because it looked like it was it was rolling over it looked like we were done um where was that it was must have been right must have been right here so it looked like we were kind of done and then we pop back up let me just check so that was the time here was 8:39 okay 8:39 so 838 839 okay so it must have been right here we dip down and then we rip back up here we break through this 770 level and once again I'm like okay it's game time so I'm adding at 728 732 748 essentially adding every 10 cents as it's pushing higher and each time I add I move my stop a little closer a little closer and I'm trying to accumulate a larger position to try to get that 1520 C move and we ended up getting it we got this beautiful move right here all the way up to eight up to a high right here of 870 pulls back micro pullback gets bought up pops up to 9 and this is where we s a top out right about $10 a share right here now at that point and I continued trading that whole leg up I I was trading at 850 I was trading up at 9 I was this is the way I trade these fast moving stocks and again to kind of reiterate why scalp trading in my opinion can be a great strategy is it's the only way you would have been able to trade up in this area when something is this extended your macd is open of course macd is confirming the trade volume great volume profile great those indicators aren't going to really tell you no they're just going to say it's extended and so the only way to manage your risk is to take quick entries and quick exits quick entries quick exits so we finally get this squeeze up to 10 and we hit a high right here of 1028 and this was my uh so right here I was up uh 24,000 and I took this trade right here I bought this dip was looking for the break through this level and I stopped out and I lost 2200 I gave back 10% of my profit and I was sitting up 22,000 on the day and I was like okay I just gave back 10% of my profit right here let's slow down for a minute that was my first big loss on it and at that point we had our first um this was actually where was this um this was at 10 or 850 so it was right yeah it was right here um that I had that trade 850 so we had the one minute pullback but the macd was starting to go a little negative I was taking a little bit more risk there and then that was all right now macd crossed over so that right there marked kind of the end of that first leg up we end up pulling back here and we get this kind of dramatic price price action we ended up curling back up we had a support level here we did curl back up I got this trade right here and a moment later it dumps all the way down here and I was like that's it I'm going to be hands off I did not trade it in this area and I did not trade it at the open I just was waiting for it to break through these levels and what I said was that you know yesterday when I did my game plan for the week ahead I was thinking the Market's been slow for these last few sessions what we need is a stock that has breaking news and ends up going crazy because what that's going to do is it's going to get a lot of Traders off the sidelines small cap momentum traders who trade to the long side they're going to feel some fomo they're going to want to participate in the next move short sellers who have been feeling confident in the last few days might have started shorting this you know in here in here in here and certainly in this area when when this candle went red boom squeezed out more volume comes in here as there short covering and Longs buying that's why I think there was more volume here because you have both Longs and shorts buying get that extra squeeze up to 10 pull back pop up little rejection goes a little higher drops down again a little higher big rejection and now another big one here now you're starting to get a a pattern of rejecting and so after that macd crossed over if you watch my episode I recorded just a couple weeks ago on using the macd you'll know that the safest time to be trading these is when the macd is open right above the signal line and that was that ended right here and it actually never came back positive maybe for a fraction of a second here but not really let's not count that because it was it was clearly coming down so you know the big question now for me is how well does this hold up over the course of the day because if it if it holds it's below vwap right now if it holds up relatively well if we get back above vwap or make new highs then continuation to tomorrow that's a victory and that's strong sentiment if it continues to fade and just makes its way all the way back down that's more bearish and shorts will sort of ultimately feel like well maybe I would have been red but if I just held long enough the trade ended up coming back down so where this closes today I think will to a certain extent determine uh how much momentum we can expect in the days ahead now of course it's true that PSIG uh is up 126% this one end end up putting in a nice move trnr however that one's come back down quite a bit right SXP this one squeezed up came back down whlr this one squeezed up came back down Real Estate Investment Trust a reat usually but the float's so low recent reverse split so you know I'm not sure what's really realistic on some of these but gnln is still our leading Gainer but if you sat down right now well there's nothing to trade right you would see boy that put in a huge move earlier and darn it I I guess I missed it so I think something that's an important reminder is the fact there will always be another one around the corner I didn't know today was going to be a $24,000 Green Day there's no way that I had any inkling that that was going to happen today but it ended up happening I show up every single day and you know I trade what's in front of me so now let's talk about um a step five step five is reviewing your analytics it's very important to review your analytics and you need an ability to understand how to read your metrics how to highlight your weaknesses how to highlight your strengths and to analyze where the majority of your profit is coming from because that's when you can double down that's when you lean in to what's working and that's so important as a Trader now I also want to share with you the tools required to be scalping because if you want to scalp certainly at the level that successful Traders are scalping at you do need access to your own scanners so you can find those stocks in real time when they start popping up you ideally will want 10-second charts so you can visualize those micro pullbacks as they're happening you're going to want customizable level two so you can change the colors here so you can very clearly visualize the top tier of the level two which is the the best um best bid in the best offer best buyer best seller you need to be able to see the halt levels I think that's really important now pre-market there's no halt levels but during regular trading hours there are you'll need hot keys at least to buy and sell but better hotkeys are always great and no doubt you'll want to have um some some analytics for analyzing your metrics now I want to share my reading list and I also want to give you guys a link to a two-e trial at Warrior trading those of you guys who are streaming on YouTube here that will also be pinned at the top of the comments and Linked In the description side by side with a micro pullback strategy PDF so you guys can check out both of those because you know what over the next two weeks who knows it's possible that the next two weeks will be slow and I'll have you know a two week stretch where there's not a lot going on in which case you'll learn uh hopefully uh through my lead that discipline and patience our critical skill for long-term success in trading or you know we may end up seeing another little hot streak here so when we look at my p&l over the last 90 days you'll see sort of slow steady big gain and then kind of slow down again well today is going to be a nice $244,000 jump so that curve that curve is going to squeeze right back up and I would love to see another you know couple days like this what we often see is that the Big Green days are clustered together right so the reason the big green days are clustered together is because when the market is hot it amplifies momentum there's a lot of fomo Traders don't want to miss the move and me included so everyone starts trading with bigger size more aggressively there's more liquidity there's more volatility and next thing you know you're seeing back-to-back Big Winners that's almost always the case for me now it doesn't mean that tomorrow is guaranteed to be a big winning trade it's not it depends on how gnln closes today that's certainly a factor and if there's other stocks that pop up but but statistically the odds are higher that there's going to be some good volatility tomorrow so I encourage you guys to do a twoe trial so you can uh trade over my shoulder and watch during the next two weeks to see what kind of action we have now when it comes to a reading list I want to share some books with you that I always recommend for beginner Traders um the first one that I'll share with you is trade mindfully this is by Gary Dayton and it's achieve your Optimum trading performance with mindfulness and Cutting Edge psychology this book was written uh many years ago it's not a new book but it is a great book and um this is published by John Wy and Sons which is a the publisher that um offered me my book deal right here they offered me a two- book deal uh I didn't end up taking it because I didn't like the terms of their contract so I said you know what I already wrote the book anyway so I'm just going to publish it myself so anyways you guys could check out a copy of my book trade mindfully how did day trade the plain truth quit the power of Knowing When to Walk Away by Annie Duke this is a book I've read uh several times I really find it to be fantastic I I really enjoy it thinking in bets another book by Annie Duke um The Happiness Advantage this is important to be a Trader you have to be eternally optimistic and you have to have incredible resilience you got to be able to brush the losses right off your shoulders and bounce back and I think that this is a book that'll help give you that perspective so these are the I would say these are four no one that's actually five um five of my favorite books now there's a couple of other interesting books just for entertainment's sake uh that you could check out the little book of Market Wizards right here this is a popular book that a lot of people like um and dark pools right here is another very interesting book about the rise of machine Traders and the rigging of the US Stock Market uh very interesting stuff here and these are all pretty sure all of these are available on audiobook I know I'm I'm sure all of them at least except for this this one I I don't remember if this is available on audiobook it I didn't listen to it on audiobook it might be um anyway so some recommended reading for those of you guys that want to continue your education because the fact is learning to trade is a marathon it's not a Sprint it's not going to happen overnight for anyone it didn't happen overnight for me My Success for with trading it was a rocky road it took a long time to get to where I'm at which is why I always remind people that my results aren't typical but I know that many of you are learning from me because my experience has been so unusual and I feel incredibly grateful for that and I'm always happy to share with you the things I'm learning I was just having um over the weekend I was visiting with my uncle who in the spring will celebrate his 50th year as a college professor 50 years 5 he started teaching in 1974 I think it was 1974 yeah 1975 spring of 1975 January of 1975 um and I gave him a copy of U my my latest book here which I hadn't given him yet um and I said that you know I wanted to thank him because he was has always been an inspiration to me uh because of his commitment to learning you know he was he was an uncle who always bought me books you know around Christmas time and it was was like oh my God another pile of books but um he's so academic I mean he likes learning so much he's been a teacher for 50 years um he's in his 80s and he's still still still teaching uh and you know once you have tenure um at a college you can continue teaching you I don't think they can force you to quit I don't know maybe at some point but uh but anyways um I really enjoy teaching and what I've what I've learned through my own experience teaching is that some people don't understand this um but it's it's really a pleasure to share something you're passionate about with other people who have a similar interest so thank you guys as always for tuning in those you guys watching on YouTube I hope you hit that thumbs up I hope you're subscribed to the channel for more episodes about trading strategy just like this I'll see you guys for the next upload real soon and I'll remind you once again that trading is risky so manage your risk take it slow and I'll see you back here I'll be live streaming bright and early tomorrow morning so I'll see you in the morning
The words are the caption track's own and nothing is reworded or re-transcribed. Paragraph breaks are placed between sentences so the text reads as prose.
Free tools for your own script: paste a draft and see where it stands before you record it.
Paste your draft and see where viewers are likely to drop off, with a rewrite for each weak line.
Paste the first 30 seconds of your own draft for a hook score and rewrites.
Check your draft against YouTube's advertiser-friendly guidelines before you record it.
Read this channel's public videos and transcripts, and download a writing brief for it.