Getting the transcript
Reading the captions from YouTube. A video nobody has opened here before takes 10 to 30 seconds; this page fills in on its own.
Getting the transcript
Reading the captions from YouTube. A video nobody has opened here before takes 10 to 30 seconds; this page fills in on its own.
The Inner Circle Trader · @InnerCircleTrader
This video has no Most replayed graph yet: YouTube shows one only once a video has enough views. These are the moments viewers replayed most in The Inner Circle Trader's most watched videos.
Most replayed moment at 51:50
3.7x that video's typical replay level
Okay? So, now we have two points of reference. Now, when I have this like that, I have two little sweet spots in the previous day's range and to the left of that, why? Cuz we're going to go back 3 days.
Said at 51:44
Most replayed moment at 12:06
4.1x that video's typical replay level
So we have relative equal highs during lunch macro, 11:30 Eastern time to 1:30 p.m. Eastern time. The setup usually forms in the first hour of that 2-hour lunch period. Okay? So between 12:30 noon
Said at 11:59
Most replayed moment at 10:06
3.2x that video's typical replay level
towards that of this buy side imbalance or side inefficiency, which is a suspension block, which has a volume imbalance on the high end and a volume imbalance on the low end. All right, so let's move into the lower time frames now. So, we're at a 1-minute chart.
Said at 9:58
The graph counts replays. It does not show where viewers stopped watching.
Words
2,152
Runtime
14:24
Speaking pace
149wpm
Reading time
9min
149 words per minute, below the 160 25th percentile of 349 measured videos. That distribution comes from the 349-video hook study.
Opening (first 30 seconds)
Morning folks, how are you? So, I apologize last night I was very very tired. You probably could tell that in the video. Uh so, I got a couple questions in the comment section and in the replies on my X feed in response to the topic I've been focusing on which is the chain of custody for price. Okay, so how does price move from one key PD array and what makes a PD
75 words, the words spoken in the first 30 seconds at 149 words per minute.
Free, no signup. See how the first 30 seconds hold attention, with rewrites.
Sentence shape
| Measure | This transcript |
|---|---|
| Sentences | 159 |
| Average words per sentence | 13.5 |
| Longest sentence | 63 words |
| Questions asked | 20 |
| Sentences containing a number | 23 |
Most used terms
Filler phrases
21 in total: kind of 4 · like 4 · uh 4 · um 3 · you know 3 · I mean 1 · actually 1 · basically 1.
A literal whole-word count of the same phrase list the Prepublish browser extension uses, so a phrase inside another word is not counted and a phrase used in its ordinary sense still is. It is a count and not a judgement.
Run the check on the words above: where attention is likely to drop, with a rewrite for each weak line. The free check shows the scores and the one issue costing the most.
What this transcript is
Every word below is the caption track YouTube publishes for this video, pulled from the video itself and reproduced unchanged. It is not Prepublish's writing, not a summary, and not a re-transcription: it is the video's own published captions. English captions, generated automatically by YouTube, in the video’s original language. Source: the video on YouTube. A channel that would rather this page did not exist can ask for its removal through the contact page, and it is removed.
Morning folks, how are you? So, I apologize last night I was very very tired. You probably could tell that in the video. Uh so, I got a couple questions in the comment section and in the replies on my X feed in response to the topic I've been focusing on which is the chain of custody for price. Okay, so how does price move from one key PD array and what makes a PD array key or high probability? How does it navigate and move from one particular price to the next without relying on archaic mythology like retail support and resistance, supply and demand, all the other gimmicks out there, okay?
We're going to strip it down to something that's so visual and mathematic. Which is why these markets are algorithmic. It takes all the the tinkering with constantly worrying about babysitting the delivery of price. It's all autonomous. And when it suits their purpose, they'll disrupt it for a short period of time and then everything will go back to autonomous delivery. Okay, so you're welcome to have your your religion about buying and selling pressure and whatever you think makes the market go up and down.
But uh for the folks that are asking what I mean by chain of custody for price, uh we're going to look at that now. Um on the daily chart, we were talking about this buy side of balance sell side inefficiency. Now, originally I had a small little darker purple line or box shading this volume imbalance sitting right here. Okay, and it's not there now cuz I want you to see the entirety of this suspension block which is a bullish buy side of balance sell side inefficiency.
What makes it a suspension block is because it has a volume imbalance at the top end and the low end which is very, very small, but it's there. Also, in the video, I was fatigued. Uh I was trying to figure out why this level wasn't a green. Um I mentioned it, but I didn't correct it. I said that the fib was probably off, so I had the Fibonacci off the wrong price action. So, you want it to be on the higher price in this candlestick's open. 20,000 .25, and the close is 20,000 7.75.
Okay, so the higher one is what it's going to reach down for. And that either either one of them is technically less than the open on this candle, which is 20,000 20 even. Okay, so what I'm going to do is I want you to focus on the this blue shaded area. Okay, so the blue shaded area is graded out now. So, it's got the octants, it's got the quadrants, it's got the high and the low, the buy side and the sell side inefficiency, which is in the form of a suspension block.
We're going to take the gradient levels out of this, okay? You already watched the video and where those key PD arrays were overlapping with these levels here. Now, if you're ever trading inside of a daily inefficiency or a weekly inefficiency, it's very, very important for you to consider these. That's why I teach you to grade them. All inefficiencies need to be graded. And then when time and price agree at these levels, any fair value gap, any order block, any breaker, any kind of volume imbalance, wick, consequent encroachment, all all the ICT PD arrays that form around these levels, when they agree with time and your bias, here's the thing, your bias and draw on liquidity, where do think the market's likely to go?
I told you back here where we're going. We're going lower and we're down here now. Okay, so I'm going to take these levels off and I'm going to answer the question for folks that are saying what we know, what takes precedence, what's more important because they seem like they're getting confused because I'm showing now this and I've illustrated points where you can use the opening range or regular trading hours opening range gap.
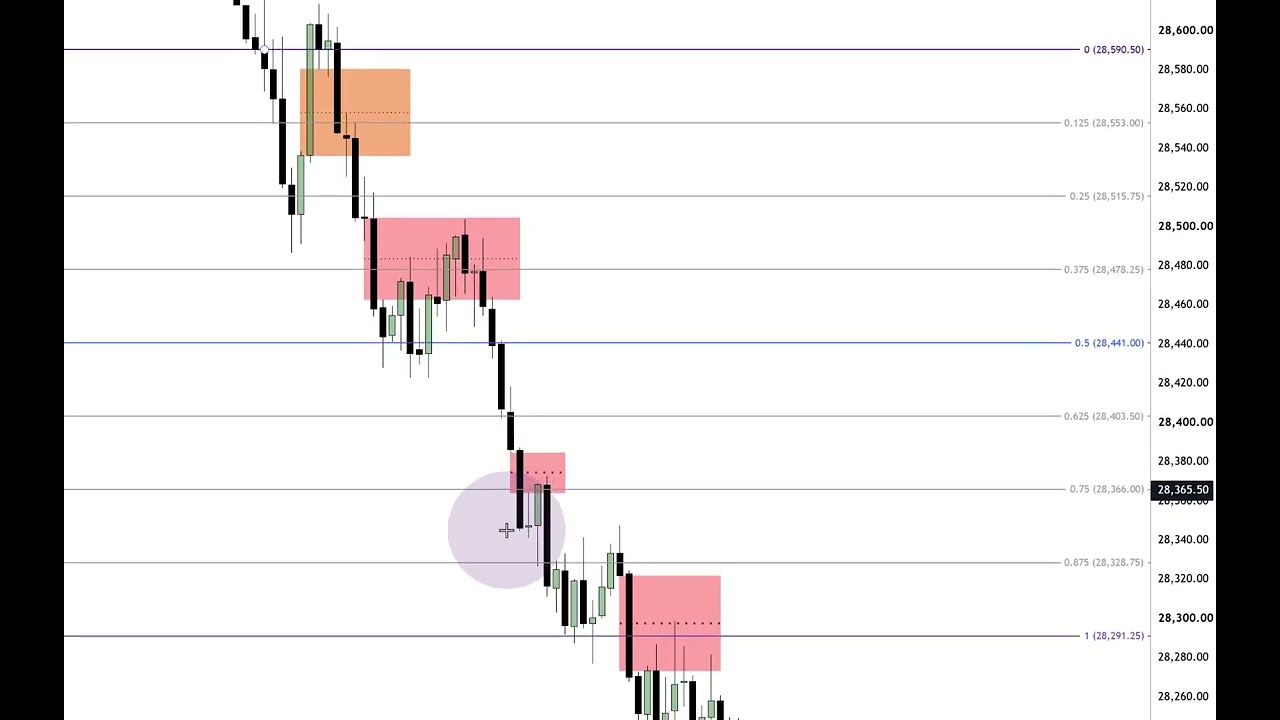
So, that's what we're going to do now. We're going to go down to a 1-minute chart and here is the business for Monday's regular trading hours opening range gap. All right. So, what we're going to do is we're going to take the fib. This candlestick the open is 28,290.75 and the close is higher with 28,291.25. Okay, so we're going to drop the fib on the higher one, which is the close. Draw it up and drop it right there.
Now, I understand. Okay, I have students that are bickering right now about um 414 shouldn't be used this kind of thing. Listen to the old man, okay? I'm not trying to steer you wrong. I had some sleep. >> [laughter] >> I'm not I'm not tired today, but the open on this candlestick at 9:30 to the last print the final print that's showing in your chart on regular trading hours, okay? When you have that it is the only two reference points you really need to have if you're going to be looking at regular trading hours.
Okay, you can go to CME website and you can use all the different things that make of it they make available, but it's okay. It's not a big deal. The the notion of this gap and by grading it we're going to drop and we're going to go to Monday. 25, yes. There we go. All right, so now while we are up here and here at 9:30 the opening range for regular trading hours, the gap is this opening price there. Now, I'm going to zoom in here.
So, this particular candle at 9:30 a.m. we have the market drop down come back up and the highest point of the regular trading hours opening range gap for Monday is this level here, the 9:30 opening price. And the lowest point is this price down here. Which is the low of the regular trading hours opening range gap or the last print for Friday at 4:14 p.m. Eastern time. I don't care what anybody else is suspicious about, you know, they're they're they're chasing phantoms, okay?
I understand the pursuit of truth and all that business, but again, just listen to me. This blue box here its low is all the way down there. Now, it could go there. But, what if you didn't notice it? What if you didn't utilize it basically for your analysis and you're only using the concept I teach with the regular trading hour opening range gap and grading it and then looking for key PD arrays that form on the octant and the quadrant levels.
What do you What are you left with? Well, we're going to take the blue box off just for the sake of removing any kind of confusion. Here we have buy side imbalance sell side inefficiency that forms at 9:35. We have a 9:32 CB that forms. So, that's what? That's first presented fair value gap. So, we have where does that close? 565 half open. Okay, so there's no volume imbalance there. So, from this wick down to there.
So, the open on this candlestick 50650. I'm sorry. I read that wrong. 28,521 half. So, 21 half and the close on this is 22. So, there is a volume imbalance there. So, there's your first presented fair value gap. It's first utilization is what? Sell side delivery. So, it's going to be used if we're bearish. We've been bearish. We got to wait for it to go back down through. It does. It closes below. Then we use it right there.
So, there's your short if you're using the octant. Right here. The gap candlestick on candlestick number two. Here's the candlestick number one. Candlestick number one, number two is the inefficiency and candlestick number three. Candlestick number two that creates the inefficiency needs to be connected to an octant or a gradient level within a range that is your analysis leading to a draw on liquidity. So, if this is full gap closure down here that's your draw if you're just simply using regular trading hours opening range gap.
You don't need to even you know confer with the daily buy side imbalance sell side inefficiency or suspension block that I've been referring to for last week or so. Now, with this for inversion fair value gap traders, you have a close on this candlestick comes in at 5:36 half, open .75, so there is a volume imbalance. That's what's being annotated there. So, this is an inversion fair value gap. So, this would look like this typically when I'm annotating the chart, I try to show you that that is to be reversed or inverse the logic that was used for its first utilization, meaning it was buy side delivery, so it was an up close candle.
When bearish, if it trades down below it right here, then it can become an inversion fair value gap. And wouldn't you know it, it trades right up to the upper octant and then falls out of bed. We have another sell side imbalance buy side inefficiency. Suspension block. Does it look like it? Open is 5 459 even. Close is Yeah, there's no volume imbalance. So, it's not a suspension block. This candlestick's close comes in at 5:04 half.
Open 5:04 quarter. So, there definitely is a little volume imbalance in there. So, this is what you're seeing for a high probability fair value gap. Which gaps do you use, Michael? Which one works? These never work when I try them. Because you don't know what you're doing. So, here is the candlestick number two of one, two, three that makes up a fair value gap. And that number two candle actually touches two levels inside the regular trading hours of the range gap gradient levels.
So, we have upper quadrant, see right here. And then we have the lower octant right there. So, it's touching two of them. So, what do you think's going to happen in price? It's going to have a little bit of movement or it's going to be significant contraction lower if we're bearish. It's going to have significant contraction lower. That's the reason why I was looking for price to really fall out of bed, but it came up more than times thought me out.
And And it required further participation at at lower lower levels. But then we get down into here, we have this gap, which so just so happens to form, look at this, it's touching right there at the midpoint or consequent encroachment of regular trading hours opening range gap. Now, what do you think kind of happens when you see a gap that forms as an inefficiency exactly around the midpoint of your analysis leading to an unrealized dealing range?
Meaning that it's likely to draw down here. This could become what? A breakaway gap. Would you want to see it traded back into and completely overlap and close in? No. So, that makes this a breakaway gap. It never trades back up into it. And then here we have number two candle, one, two, three. Number two candle lays on this lower quadrant. Price trades up into it there. Remember, we're not using the levels I showed you in the previous video and what I shared on X yesterday.
These are just simply the gradient and octant levels for regular trading hours opening range gap for Monday's trading. Beautiful delivery here, it breaks lower. We have another inefficiency that's laying right on top the low of the gap closure or settlement price for previous Friday at 4:14 p.m. Eastern Time. Pippie. Drop [snorts] down in here is validated looking for Sibbie. And it goes right up to consequent encroachment stops dead in its tracks.
The bodies are are staying below it. So now, when it's doing these types of things, you then you have to ring in what is it doing beyond the scope of the the regulation of the opening range gap. Then you ring in the levels that were given for the daily bias and the balance outside of efficiency that we mapped out in blue at the beginning of this video and what I was talking about for 2 weeks now in analysis previous videos and and commentary on X.
So hopefully this is helpful to you. It it's when the levels are good and the PDA arrays are good, the concepts I give you they're going to agree. And the more things that agree on one side of the market, the less likely it is to go the other direction. And that's how you define high probability, at least by the book of Michael.
The words are the caption track's own and nothing is reworded or re-transcribed. Paragraph breaks are placed between sentences so the text reads as prose.
Free tools for your own script: paste a draft and see where it stands before you record it.
Paste your draft and see where viewers are likely to drop off, with a rewrite for each weak line.
Paste the first 30 seconds of your own draft for a hook score and rewrites.
Check your draft against YouTube's advertiser-friendly guidelines before you record it.
Read this channel's public videos and transcripts, and download a writing brief for it.