Getting the transcript
Reading the captions from YouTube. A video nobody has opened here before takes 10 to 30 seconds; this page fills in on its own.
Getting the transcript
Reading the captions from YouTube. A video nobody has opened here before takes 10 to 30 seconds; this page fills in on its own.
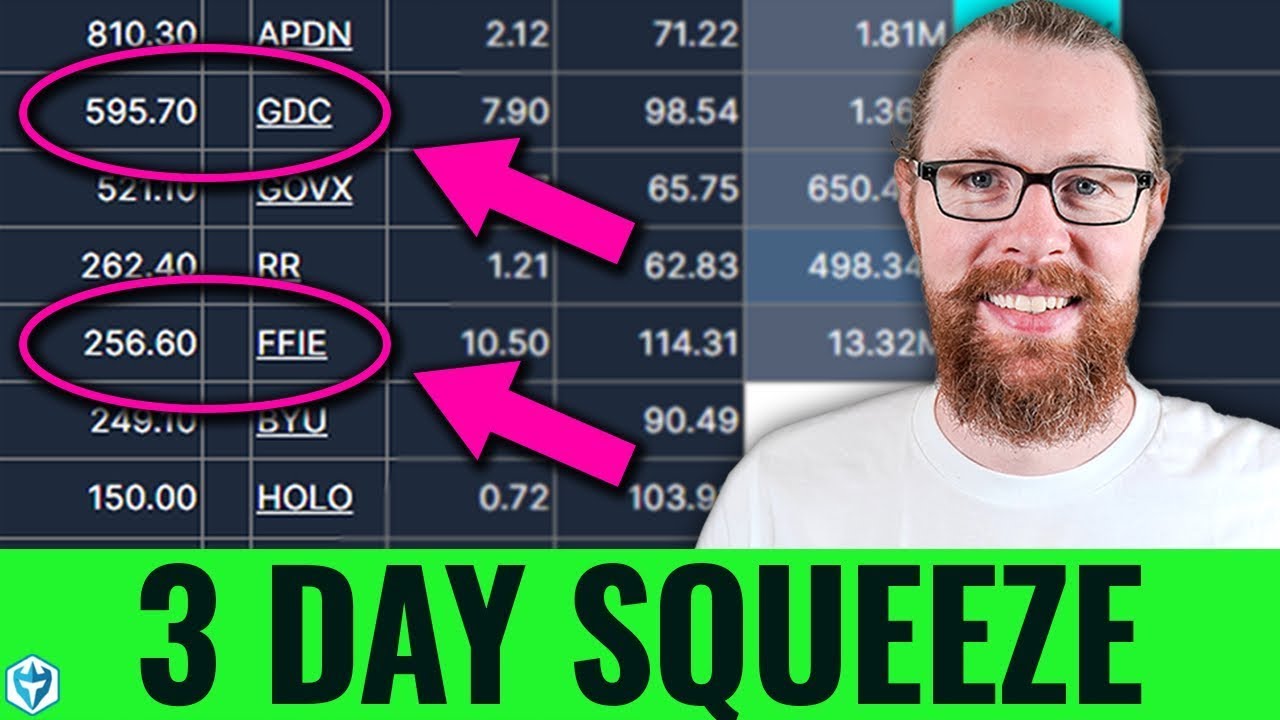
Ross Cameron - Warrior Trading · @DaytradeWarrior
This video has no Most replayed graph yet: YouTube shows one only once a video has enough views. These are the moments viewers replayed most in Ross Cameron - Warrior Trading's most watched videos.
Most replayed moment at 7:43
3.2x that video's typical replay level
occurred there it is so this is actually in solid but you could have it either either in a solid line or a dotted line whichever one you prefer so this is factoring in the amount of volume that occurs at price and the volume weight moving average um volume weight average
Said at 7:37
Most replayed moment at 14:45
3.5x that video's typical replay level
entries is to find the first pullback so in this case this is a five minute pullback right here we have a five minute pullback and this is a pullback that is right at the volume weighted average price which is our dotted line and it's right at the nine moving average which is this grade
Said at 14:37
Most replayed moment at 11:52
2.7x that video's typical replay level
that have the highest probability of success so let's watch what happens right here macd is against the trade right here so no nothing in here you should be trading no trade no trade no trade and then right here we can get back in now I'm going to do some something kind of cool and I'm going to
Said at 11:45
The graph counts replays. It does not show where viewers stopped watching.
Words
11,029
Runtime
58:43
Speaking pace
188wpm
Reading time
46min
188 words per minute, between the 181 median and the 201 75th percentile of 349 measured videos. That distribution comes from the 349-video hook study.
Opening (first 30 seconds)
in today's episode I'm going to teach you how to trade the continuation setup continuation is part of a day trading strategy where we're looking to capitalize on multiple days of upward momentum typically a continuation setup begins on day one with breaking news news comes out and the stock squeezes up 30 40 50% maybe 75 100% or even higher and then on day two and day three the stock just keeps creeping a little higher a little higher and a little higher and this ends up culminating with a final short squeeze
94 words, the words spoken in the first 30 seconds at 188 words per minute.
Free, no signup. See how the first 30 seconds hold attention, with rewrites.
Sentence shape
| Measure | This transcript |
|---|---|
| Sentences | 6 |
| Average words per sentence | 1838.2 |
| Longest sentence | 9,196 words |
| Questions asked | 0 |
| Sentences containing a number | 6 |
Most used terms
Filler phrases
304 in total: um 83 · like 65 · you know 53 · uh 32 · kind of 23 · actually 21 · sort of 12 · basically 9 · I mean 5 · literally 1.
A literal whole-word count of the same phrase list the Prepublish browser extension uses, so a phrase inside another word is not counted and a phrase used in its ordinary sense still is. It is a count and not a judgement.
Free, no account. See where attention is likely to drop, with a rewrite for each weak line. The free check shows the scores and the one issue costing the most. Or run it on the words above first.
Free · No login · See a sample audit first if you prefer.
What this transcript is
Every word below is the caption track YouTube publishes for this video, pulled from the video itself and reproduced unchanged. It is not Prepublish's writing, not a summary, and not a re-transcription: it is the video's own published captions. English captions, generated automatically by YouTube, in the video’s original language. Source: the video on YouTube. A channel that would rather this page did not exist can ask for its removal through the contact page, and it is removed.
in today's episode I'm going to teach you how to trade the continuation setup continuation is part of a day trading strategy where we're looking to capitalize on multiple days of upward momentum typically a continuation setup begins on day one with breaking news news comes out and the stock squeezes up 30 40 50% maybe 75 100% or even higher and then on day two and day three the stock just keeps creeping a little higher a little higher and a little higher and this ends up culminating with a final short squeeze where early short sellers who shorted maybe on day one or day two get forced to cover as the price just keeps moving higher this is sort of capitalizing on the stock being irrationally strong it doesn't really make sense necessarily and so people who have a a strong short bias will analyze the fundamentals and will say the price is detached from the fundamental value it doesn't make sense that it's say high I'm going to short it for the move back down but as we know certainly with GameStop and many other stocks over the years a stock can be very disconnected from the price and the actual True Market maybe valuation it's hard to even call it the true market valuation because if people are trading the stock at this price that is in fact how the market values that company so as an active Trader we love volatility and our goal really is to capitalize on this volatility while at the same time managing our risk right now now today I am up $1,695 44 and the bulk of this profit has come from Trading stocks that were on continuation it's the second day of continuation or the third day or in some cases the fourth day of a stock pushing higher one of the things I said at the beginning of this month was that each day I'm double my $5,000 daily goal or higher I will teach a full- length class on the strategy or the setup that gave me the bulk of the profit on that particular day now it's interesting about this day and trading continuation is that this is a bit of a departure from the strategies that have given me the bulk of my profit this month so far most of my big green days have been trading day one of breaking news where the news comes out and instantly the stock goes up 50% 75% or even higher and we've seen a couple of stocks this month that went up 500 600 even 700% in one day on news so with that level of volatility I've done well on day one of news and I think in fact because we've had stocks that have made such a big move on day one we haven't had as much continuation because they really got super extended right out of the gates and then they kind of come back down to Earth but over the last couple days we've seen a couple of stocks that have really given this nice continuation setup where they just keep pushing higher and higher and higher so we're going to go ahead and jump in those of you who are new my name is Ross Cameron I'm a full-time Trader and I want to be the first to remind you that hey my results are not typical I've been doing this for a long time if you ever want to check out uh my website you can see at warriortrading.com if you come over to our members dashboard uh or if you're if you're already a member or if not you can go to the about section and you can check out my broker statements here 2017 18 19 20 21 22 23 24 now I've been trading for a lot longer than just 2017 but what I did in 2017 was I funded a small account with $583 and I did this because because at the time in 2016 a lot of people were challenging me they said Ross I don't think you'd be able to make this kind of money if you were trading in a small account I don't even think your strategy would work in a small account and eventually I'd heard enough of that and I said you know what I'm going to put my money where my mouth is I'm going to fund this small account and I'm going to show you what you can do with it so what I can do with it at least so I went ahead funded this small account with $583 and this is the audit the independent accountants report of all of the broker statements from January 1st 2017 through 2018 19 20 21 22 23 at the end of each year I now have these statements audited so that right there verifies that I turned that $583 account into 10,719 th000 and some change average monthly profit 127,000 average monthly return 64% and as as I sit here right here for the month of August and again I I say this not to brag but just so you know beyond a shadow of a doubt that the person you're about to learn a strategy from is actually trading it with real money and actually knows what the heck they're talking about so month to date here for August let's see I'm sitting at we'll go to detailed $1 136,000 that does not include uh my profits from today so my profits from today will bring me up to about 146,000 so I'm a little bit over my monthly average which has been $127,000 okay so yes it's true that my results are not typical but I think if you're learning how to trade it makes a heck of a lot sense to learn from someone who is proven profitable and actually showing you that the strategy that they're trading that they're sharing with you they're trading with real money every single day this is sort of what separates people who trade theory of the market and maybe someone like a college professor who's teaching about general theory of Economics or the stock market that's all well and fine if you want to be an economist but if you actually want to be in the market trading every single day you got to learn from someone who's actually doing it so all right let's go ahead and jump into to this class on the continuation setup we've got four topics that we're going to cover I'm going to Define continuation for you we're going to talk about the risks associated with it and there are a number of risks I'm going to share the rewards because obviously there are rewards as well and I'm going to share with you my continuation trading strategy at the end of this class I'm going to give you some recommended reading for those of you that want to keep learning more about trading in general uh and I I hope you of course find that helpful so let's start with the definition of continuation a continuation setup is when a stock that was strong in a previous trading session or perhaps over several previous trading sessions is showing continued strength in other words the stock has had an opportunity to die it's popped up gave us that initial I don't want to do this in red I'll do it here in blue so it initially popped up it had chance to pull back and it's just not pulling back it just keeps moving higher again has another chance to pull back but it those dips keep getting bought up and it keeps moving higher and typically what ends up happening with these stocks is as they sort of hold up and they push higher what ends up happening is the volume gets higher and higher and higher as traders to the long side are buying into these moves for to capitalize on the profit and short sellers who shorted on these early spikes are getting forced to buy back the shares they sold short and cover so that creates an imbalance to the buy side ultimately we're always talking about an imbalance between supply and demand so we've got demand and then we've got Supply over here and you've got a stock that has a very limited level of supply and then you have this huge surge of buying that's when next thing you know you're seeing a stock that's going parabolic and is squeezing up so continuation it's a setup that I've traded for a long time however you know to be frank it's not one of my favorite setups because of some of the inherent risks so let's talk about those risks number one when you're trading a continuation setup you don't have a fresh Catalyst you don't have fresh news you have news that began you know a couple days ago and it's kind of continuing to push the stock higher now that's in most cases there will be some instances where you're trading a continuation setup that had news let's say on Monday and then all a sudden here on Wednesday or Thursday or whatever the case is Boom they put out a second news headline now when a company does that I feel like they're flame you know Fanning the Flames they're trying to ignite that momentum and I think it's sometimes very strategic as part of their kind of PR strategy to create awareness about the company's stock they want people to buy into the stock every company wants their stock to go higher in price and of course there's things they can do that are ethical there's things they can do that are unethical there's things they can do that are legal and there's things they could do that are illegal and in the markets we see a blur of all of these different things especially with some of the small cap stocks that we're going to look at one of them today was especially interesting it was very very choppy but nonetheless the lack of a fresh Catalyst on the typical continuation setup can be a problem second you can risk declining volume usually the highest volume in most cases is going to be day one so day one the stock comes out boom squeezes up on this big green candle right and you've got breaking news you've got high volume and then what happens in a really hot Market is ultimately you get a 700% move on day one and on day two the stock pulls back but on very light volume and then maybe it pulls back another little bit for day three on light volume and then day four boom all of a sudden you're getting this daily continuation it's daily bull flag and the volume is coming right back up but if that breakout is on lighter volume like this that becomes difficult to trade because what ends up happening is as the price is moving higher you're having decreasing volume and we would call that a d a Divergence a Divergence like that can be a possible early indicator of a a trend that will not sustain so what we would always prefer to see is that the volume is actually increasing as the price is moving higher certainly that's what we saw with GameStop but but you know there'll be other stocks that just don't have that degree of strength and usually what creates this degree of strength will either be that the the company has put out additional headlines on these days so it's helped create awareness or that the stock really seemed like 100% it was a short and it was going to go down and a lot of early short sellers got trapped so if you don't have either of those two things you have a higher risk of declining total volume but you also almost always have declining relative volume remember that relative volume it's a term that we use a lot as active Traders relative volume is the measurement of the average volume of the stock average volume and the calculations can be different sometimes we be the average volume over 50 days which is the case with my metrix it compares the average volume today versus the 50-day average volume for the stock other um other Traders will use average volume over 20 days and some might even use 14 days and ultimately my biggest winners regardless of how you calculate it will always be when the stock has five times higher volume than even it's 14-day average but it's it's it's still true if you do 20day or 50-day so five times or higher is where I do the best so if this is a stock that was trading on light volume and then all of a sudden boom has news you easily have five times relative volume but typically down here on day two day three day four day five your relative volume is now decreasing because your your 50-day average is factoring in the high volume that occurred on that day so now all of a sudden the average has come up and these days if they're trading on lower volume than this day it it's going to throw off your relative volume calculation and the reason that that's important you might think well that's just a ratio what does that really matter the reason it's important is because High relative volume typically corresponds to float rotation what is float rotation so float rotation is when you have the float of a stock and let's just say the company has a float of 2 million shares and the stock trades 20 million shares today you have 10 times float rotation and and if this is a stock that's been trading on an average volume of you know let's just say a million shares it also has 20 times relative volume so 20 times relative volume with 10x um float rotation creates a the potential for a parabolic move the reason is if you have a stock that's up let's let's just say this is up 200% if a stock is up 200% and they're 2 million shares in the float you would figure there's going to be a lot of people who want to take profit right they're up 200% today so they're 2 million shares of people that of 2 million shares worth of holding that were that were up overnight 200% they're going to want to take some money off the table so when you've got 20 million shares of volume there's enough volume to absorb all of those people taking profit and that's important because let's sort of flip this a different way let's imagine that the float is um 200 million shares if the stock was up 200% with a 200 million share float you now have 200 million shares that are probably going to want to take profit maybe not all of them but a lot of them and if you only have 20 million shares of volume only 10% of those people would be able to sell at the current price which means if they decide to start selling and they probably will because the stock is up this much the price is going to be declining over the next few days so and of course you would only you wouldn't have um a float rotation on this because it's only traded 20 million of the 200 it's only a tenth of float rotation tenth of one rotation so higher lower float and higher relative volume and higher total volume create float rotation and that's where we often see some of the biggest moves so a continuation setup with lower relative volume and declining total volume it's just not usually where I see the big exciting moves in most cases and so as a result of these risk factors we basically end up with a stock that we would say is choppier it's just not as clean it's not as easy to trade they pop up they drop down they pop up they drop down you get stopped out you get frustrated they're just not as clean and also they're not as obvious why aren't they obvious a continuation setup might only be up 2% today or maybe even it's it's down 2% and as you know the all the commission free Brokers they want you to trade in fact every broker out there wants you to trade the business model of the broker broker is they get clients those clients trade the broker makes money on their trading activity through payment for order flow in the case of commission free Brokers through actual Commissions in the case of Brokers that charge commissions plus platform fees plus of course having that that customer's money you know custodian with the bank where they can earn interest and lend it out and everything else so they want to encourage you to stay a client and to trade actively all of that means they're going to be actively sending emails and posting in very obvious places the top gainers today they want to get you focused on these top gainers now Regulators don't always like this because they think that maybe these Brokers are making trading too much like a casino and hey big Gainer big Gainer big Gainer because they want you to they want you to trade that's how they make the money just I suppose like a casino they want you there nonetheless the result is that the stocks that are high percentage gainers they're up 150 175 200% those are the stocks that typically have the greatest imbalance between supply and demand they have the most eyes on them they have the highest volume the highest relative volume the highest float rotation and that's usually where I get my biggest profits it's day one of momentum and a continuation setup if there's another stock out there that is on day one day one of news is almost always going to be cleaner than continuation but today was a day where the the day one news setups weren't that strong now it's a Friday in August and it's not uncommon that companies will put out good headlines early in the week in hopes that Traders will see the stock and we'll invest in the stock and we'll bring the prices higher and that they'll put out either bad news at the end of the week or they won't put out any news at all because they don't want the news to get forgotten over the weekend so Thursdays and Fridays are not the best days of the week to get breaking news especially during the summer now it doesn't mean that we won't have news at times on a Friday but it's not uncommon that we won't and we didn't today we well we had a couple headlines but we didn't have anything that was really obvious so because our sort of top tier setups weren't present today I think Traders were more inclined to gravitate towards these continuation setups that were just kind of continuing to grind higher um now another challenge with a lot of these continuation setups is that they likely have what's called ascending resistance so if I pull up um an example here from today we'll pull up um GDC this is a Chinese stock which is these ones can always be really challenging but what you'll notice is that if we back up this this chart here the last couple days I drew this um trend line connecting the highs here about here and here and that brought me into this trend line right here around 11 and so I said you know up here I'm a little worried that we're coming in a resistance I don't know if it's going to hold that level and then there was was also a level I drew from here through here premarket that I was worried about a little resistance right there so you're not going to have ascending resistance typically on day one of fresh news day one of fresh news it's you just don't have it yet but after you've had a stock that's put in these highs has pulled back comes up again has pulled back you can get this type of resistance level and Traders will notice that it's a technical level and that can be a problem so all right we we've clearly talked about the fact that there are some very noteworthy risks with trading continuation so you could argue why even trade it at all given all of these risks I'm definitely not selling it well there are some rewards to continuation but you always have to think about trading as risk versus reward and can you manage the downside risk and is the upside reward worth it in the case of a continuation setup it's often short covering that creates that upward momentum so on day one the stock makes this big move and a lot of Traders short it thinking this is going to be one of those big moves in one day but it's going to come back down this news isn't even really that good it's this stock is not going to hold up next thing you know they're in the green maybe for a little while and then after hours or maybe pre-market the next day all of a sudden the stock is back at a new high and they have to make a decision do I cover or do I add to my position to increase my cost basis and hopefully then I'll be right later today so day two maybe they're adding to the position they're still accumulating they only had a starter they're adding and then it keeps going higher keeps going higher and next thing you know a surge of buying and the stock get halted up and they're getting forced to really make a difficult decision of do I just cover this thing into this squeeze because look it's up 100% today it was up 100% Yesterday now just moving Higher and Higher and I'm in the red and these can Get Dangerous the most you can make when you short a stock is if it goes to zero but if you short a stock at $3 and next thing you know it's at $6 $9 or $122 you can lose significantly more than you could have ever stood to make so ultimately you have to bail out that's probably the right decision so that short covering creates that upward momentum and that can create irrationally strong stocks which is sort of like a surprise move it doesn't really make sense but it keep keeps going higher and so as a Trader a big challenge is are you going to trade the technicals or are you going to trade the fundamentals it's really hard to do both and trying to trade the fundamentals as a day trader in my opinion is nearly impossible while the fundamentals matter in the the grand scheme of things in the short term and the short term can be days but it can also be weeks months or even years a stock can be very disconnected from what someone might say is its Book value for instance the value of just the balance sheet of all the assets and then taking away the liabilities so you know if you have a company like a GameStop or something like that you're like what's what are the real just assets on this company on their balance sheet that if you bought the whole company you could sell off the assets for a profit and are those worth more than what it's currently trading for in which case this is a stock you could feel very comfortable buying but with small cap stocks and even large cap stocks the market will sometimes value them at a multiple that is substantially higher than their Book value certainly uh or what U perhaps um security analysts would view as their real true um valuation doing different valuation methodologies so with the case of Tesla or even Amazon over the years I mean some of these have traded with outrageous PE ratios because Market participants believed in their future earning potential and so of course the price keeps going higher and people who are shorting them early in the move get forced to cover so you can trade continuation as a short-term swing trading strategy on midcaps or large caps like Nvidia or Tesla in fact through much of the pandemic Tesla was a great continuation stock this year Nvidia has been a great continuation stock where the dips have gotten bought up and it keeps moving higher short covering creat that upward momentum and there's just this strong sentiment around the stock so now I'll show you a couple examples of continuation um this is apdn uh from today where we had this initial move earlier in the week where it goes from 40 cents to 80 cents and then it goes from 80 cents up to 240 and then it goes from you know there up to 260 and then it kind of pulls back over these like like this one day and that surges back from 120 to 240 and then pulls back and then today from10 all the way up to $3 and it's like the stock is just not giving up it just continues to make new highs and anyone who is shorting it is getting forced to cover and you see look at the volume today really high volume today certainly compared to yesterday and even compared to the day before and it's compelling compared to the day one day one had higher total but this is not insignificant so that's apdn a very lowf float stock it's a biotech stock and this is one that actually interest L put out a news headline at the beginning of the week and I'll pull this up for you just so you can see it so apdn um put out news this was on Monday um apply DNA to submit application New York State health to expand intend use of um this drug Etc so that was on that was on Monday and then all of a sudden here on Friday headline submits validation package to New York did it's the same headline except it says validation package instead of application and I thought that that was kind of interesting that they put out more or less what appeared to be the same headline um but even in spite of that the stock ended up going all the way up to a high of $354 and so when we look at this on a daily chart so when you look at my platform here you'll see that I'm using a 10c a 1 minute a 5 minute and then the daily so if we look at the daily chart on this uh here we go look at the total volume the pattern increasing increasing Peak and way down way down but now it's coming back up but this is a this is a Divergence it's moving higher on lighter volume so is it going to hold these levels I don't know but it's up 68% today and I suppose it doesn't really matter whether or not it does hold these levels because if you found opportunity to capitalize on the volatility volatility today then that's enough you know for you to feel like you've done a good job a Trader when I analyze the daily chart I do think it has um some room 200 moving averag is up at 750 but I would be surprised if it gets all the way there um I'd be very surprised if it gets all the way there today especially with that type of catalyst but you just never know because there could be a short that took a big position and got buried this is another one CG from last week so pushed up on day one day two it just keeps going higher right so it's not giving up and then it just surges higher so this literally goes from $2 a share to $26 so day two this is all continuation this is day two continuation from a fresh move that began on day one so day one and day two and day three it pushed higher but then it kind of came back down now this also and actually I don't think did I mention oh I didn't mention the risk of offering um I well I wrote it here but I forgot to mention it so C this one I stated um on this day here that I was concerned about the risk of an offering and so a secondary offering is very common in the market with small cap stocks and it essentially gives the um it gives this the company the ability to sell shares on the open market to raise more money so when I looked at their their quarterly filings we had this news headline which started the move I looked at the filings and I see all right they've got 950,000 share float so that that's the level of um Supply it's very limited and then I'm looking down here at their balance sheet their assets and I'm like wait a second their cash is $380,000 I've got more money than that right now in my day trading account so and so for what it's worth my day trading account right now has only a little bit more than that um but let's see so someone asked me the other day what my um so I've got $398,000 in my account right now I reset my account to $90,000 in July and then in July I made over 200 Grand and in August here I'm up 130,000 so the account has gone basically from 80,000 to up around whatever 400 Grand and um you know that's up like 200 plus almost 300% just in eight weeks but today you might argue well gosh you're up 10,000 that's only 3% on a $400,000 account you know it's what or 2% it's a very small percentage gain and while you're right on that um the total biggest position I would have taken today probably was $100,000 so that would have been the most buying power I used and that would have been on um ffi which was a little higher priced at the time so biggest position today was probably $100,000 so anyways $10,000 off of that is is not bad and also just to clarify when you take a $100,000 position you're not risking $100,000 because if it goes down you stop out for a l L and if you lose 2,000 or 3,000 that's your loss you're not risking going to zero okay so anyways I saw the stock had $380,000 uh in cash and then I scroll down to see what their operating expenses look and they're doing an operating loss in this last 3month period of $3.2 million so I said guys I'm worried that this is a company that's going to need to raise money so we go back into their filings and I check and I see that um they have a prospectus here to sell uh what was it this was from January was it this one uh this is the one so they ended they they did end up doing an offering but now I can't remember where um maybe oh no that was that one so it was this one here um 6.6 million shares so I was worried about this offering risk and then what ended up happening was the company did a secondary offering so they raised money on the market and the price end up dropping and now it's come all the way back down to 10 so that's another risk with continuation setups and so you you get forced to do a little bit more fundamental analysis all right so that was CG ffi this was the one from today continued over the course of three days just pushing higher that one gave me my biggest winner today and I'll talk about that one in more detail in a second and then GDC I showed you this one already pushing higher pushing higher pushing higher and then today going from Seven all the way up to 12 before dropping back to out so a little risky there so now I'm going to share with you my day trading strategy specifically for the continuation setup and I'm trying to simplify this really into just three steps I I can expand upon it and of course Members Warrior Pro members at um Warrior trading would be able to see how I do expand upon it in our classes but just for the sake of I think this um class here on YouTube this free class I want to keep it relatively concise so I'm going to simplify my strategy into Three Steps step Step One is finding the stock to trade in the first place so step one for me is to use my scanners which are part of um this day trade dashboard right here this is the software that I've been developing since 2017 it has scanners it has charts it has a news feed it also has the chat rooms and my broadcast and everything else so the scans that I was using to find these stocks were uh two the running up Scanner right here which shows me a stock that's squeezing up and then I also have a continuation scanner which has apdn vrax GDC govx ncna ffi and there's a couple others here so they don't they're not all necessarily stocks I'm going to trade today but they're stocks that I'm going to watch and keep an eye on in case they give me a good opportunity but ffi ended up uh popping up pretty early so when FF pops up what do I do next step one okay now I found a stock that's interesting it's hitting my scanners it's up 30% relative volume is 47 you know it's it's clearly moving so step two is I begin my analysis which you could also say is my due diligence so my analysis begins with the fundamental I'm just checking and asking myself is there a news Catalyst on this is there fresh news and I see that there's not fresh news so I'm like um all right not fresh news okay next is technical analysis right so I've done my fundamental analysis there was basically none to do at least initially now I'm doing the technical analysis now the next I I will say that this is the order that I do it in first I check to see if there's news then I check to see what the chart looks like then I'll go in and look at the filings to decide whether or not I think this has risk of an offering um based on its balance sheet its earnings its profit loss statement and if they have a shelf registration already filed so but but the next sort of Step here is to check the technicals because if the technicals don't look good then I don't need to waste my time going into the filing so I pull up the chart and what I noticed on this one was you know we we really did make a really strong move yesterday we came up we pulled back we came back up we pulled back and I I just could visually see there's resistance right here so I'm going to draw a line it's at 8.94 all right so that line right there 889 actually that was the first level I was kind of looking at I was like this is resistance and so in the case of ffi I'll pull this one up here and I'll actually show you my first trade on it so on ffi I take my first trade on this um as it breaks over $9 so pre-market we squeeze up right here we break through this daily level which was 889 we hit N9 we pull back and right here I took my starter which was a little aggressive but I took a starter at 919 with a stop actually at 9 so we broke over 19 9 I said I'm going to get in here and we got a pop up to 940 a little micro pullback and then we got this pop right here now the time stamp in my trade actually is let's see 2440 so um yeah so I had my first entry right here at this beginning and then I took my second trade actually right in here so I got in I got out it then dips down I got back in on the dip I get back out on that pop so then we go sideways here we come back down to nine and we hold this previous level when we hold the previous resistance level and it shows a support I can now use that as my stop for the next trade right here for the move higher and we end up getting a nice squeeze here up to 970 and up to 10 we pull back right here and then watch this we dip down we dip down and then we break 1020 and we rip up to 1080 now on this stock today through this move right here I made $1,800 and then you want to know what I did I bought right here and got stopped out right here I had my stop at 10 and I get in on that little micro pullback for the move higher and it dips down here and I went back to break even so I went up $1,800 and I went back to break even on this stock and you know I was thinking it's Friday ah this is discouraging you know I'm trying to build my cushion each day and I really don't like it when I'm trying to build my cushion and then suddenly I I give back all of the progress I've been making and you know take a good a good siiz loss not that $1,800 is a huge loss but it's it's obviously you know it's a bit of a loss so so with that I was kind of a little bit bummed out and it comes back up again and then it pulls back and at this point we double bottomed right here and I said you know what we just double bottom there this thing is holding up I'm going to take another stab and I got back in right here and and I couldn't believe it all of a it goes straight to 1040 and right up to 1080 right here was the high and just like that boom I made I can't remember what it was um it was it was a good profit it was a good profit on that trade I'm up right now 4,400 so then it pulls back right here and I bought this pull back here we get to squeeze up to 11 we di down and then right here it was choppy and I actually gave back a about $1,000 on that trade right there I got in for the breakr 11 and it stopped me out it rejected it pulls back and then a little bit later it comes back up again right here and I got back in for the break of 11 but it goes only to 1120 and then comes back down and so that one I lost on as well it just didn't give me what I was looking for and it tried again during regular trading hours and it dropped again and so at that point I was like all right this one is just too choppy so I peaked at about I want to say $6,000 on ffi and I'm at $4,400 right now give you know give or take so not bad but it started to get a little choppy um the float on FF is 9.8 million shares you know it's it's fine in in those regards it's not um you know it's a lowf float stock but it just it's a little more thickly traded um it had I think a a when was the reverse split on this it was back here in um in August so you know on this one but again have this kind of risk um of of offering so this is Cash in thousands they don't have $ 793 they have $793,000 okay so thank goodness at least there's that so not not that that's a lot of money though still it's not a ton of money and then you look at their their operating expenses and it's kind of alarming right this is this is not a insignificant amount of money so it's in thousands again which you know makes the numbers maybe not seem as big but they're pretty big so I'm a little worried about this one and I don't want to get caught holding the bag so I decided I wasn't going to overstay my welcome on ffi okay so that was FF then um and now step after step two of my technical analysis is step three where I'm actually executing my trades and I'm doing that in my trading software where I'm pressing the buy button pressing the sell button um the software that you guys see that I'm using um let's see oh we got to back it up here um um this software right here day trade Dash This is for charting scanning news chat and broadcast and my stream and then um for actual order execution I use light speed as my broker but you could just as easily use you know think or swim or Weeble or whatever the case is okay so so anyway so execute the trade lock up that profit and then uh switch gears to GDC now GDC I really kind of it's been moving these last couple days but from the beginning I was like this is a Chinese stock and we know that these Chinese stocks are really not trustworthy they continually pop up they drop down they pop up they drop down and a lot of times what ends up happening is eventually they have these liquidation events where in one day the stock will drop 80% nonetheless GDC has pushed higher it pushed higher yesterday and then it pushed higher again this morning so when it first hit my scanner the scanner that it hit was my running up Scanner so it hits my running up scan which tells me the stock is squeezing up right now in real time I see it squeezing up and I'm like okay let's look at the daily well at fundamental analysis there's no news yet we did have that news posted but that news had not come out when this first started squeezing which is also a little interesting so I checked the daily chart and I'm like well yesterday's high was eight so we're it looks like we're going to break yesterday's high right so it comes up right here and it squeezes up to 850 it then pulls back and it pushes through 850 it goes up to 9 to 950 to 10 it pulls back goes up to 12 unbelievable what a huge move it didn't make sense and you know what was really interesting about this was that we had these huge buyers on the bid so we had um initially when I got took my first trade on it there was a buyer at uh 750 for 20,000 shares on the bid and at the time the stock had almost no volume so I was like this is this is a bizarre it's it's a big order now this is going to show us that order um let's see uh I've got to roll back a little bit further so that order initially was right down here you see that big orange block that's the heat map showing you where there was a big order so there's a big order right there it ended up being like 40,000 shares it got bigger so I was like clearly I don't know there's a big order there so I got in with a stop basically at that order it then pushes higher it pulls back it pushes higher it pulls back and then all of a sudden 9:30 at the open we're seeing 100 thou 120,000 share orders on the bid these massive buy orders and so you know I looked at that and I just thought it it and right now you see some sell orders on it but I just looked at that and I was like someone is bidding this up and I thought this might Force shorts to cover and so what ended up happening was that bid that big buyer kept just propping the stock up they were sitting there at 750 then they moved their order up to like whatever it was 8 and then 9 and they just kept moving that order higher and higher so I basically traded with that order as a back stop and then once that order disappeared I was like I'm done and I don't know if that was I I don't really know what the story was CU then what was weird was the stock actually did have news that came out at 850 but it wasn't really I mean it was news it was a fresh headline not sure how significant it was but I mean the price moved higher but it seemed kind of like a fluffy just little headline just I don't know it didn't seem super significant but you know nonetheless the price moves higher so I did the best I could on GDC um I also gave back a little bit off the top though I hit a high of almost 5,000 and then I gave back a little bit off the top um just on dip trades uh and it was just we were continuing higher right here we still had those big bids but it just started getting the spreads were a little too big so I just didn't trade it super well anyways so that was GDC um it ended up coming back down back to 715 and now you're looking at a chart on The Daily that's like it's really doesn't look good high volume declining and now it's a red volume candle with this big reversal we would call this a shooting star and shooting stars come back down to earth so this one's coming back down now the next one I traded was crkn crkn is also a continuation setup from the move that began yesterday and this one was was trading in tandem with FF so as ffi went up yesterday this one went up then it pulled back and as ffi started popping up today this one followed so I got a trade on this but I jumped in it a little high and I thought we were going to break as we broke through this double top that we were going to break three but it ended up stalling out so my trade on that um I took a couple trades um and let me pull this up on the 10-second chart I like the 10-second chart especially as a teaching tool because I can kind of show you um in a more granular way what exactly happened so crkn um this one let's see I jumped in it um kind of aggressively at this point I already had a cushion on the day I was up like $5,000 or so and it hits my scanner and I took a starter of this at um 74 274 and I added it 282 290 and it comes up to three but it can't break three and I ended up selling at 299 and then 290 so I was able to make 1,200 bucks on that which was not too bad from 74 initial entry adding as it was going higher and then taking that profit out pretty close to the top it dipped down and then it didn't rally back up and at the same time ffi kind of stalled out and rolled over as well so I was like all right so that's that then the last one I traded was prtg now prtg is going back more to standard momentum trading this one's up 144% right now it's the leading gapper in the entire market and this was the one that initially this morning when I first sat down I was like oh bummer you know this thing went from $3 up to eight bucks nearly at like 5:30 in the morning then drops down all the way back here to 450 it double bottoms and then just rips back up so as it squeezed back up once it got back above volume weighted average price right there at that time I was like all right it's game time I can trade this let's start to get focused so we'll back this up here and I'll show you where I started trading it so let's see so first trade on it um PP or no sorry it was P RTG so the first trade I took on it I bought at 572 and so that was at about let's see 942 right in here 943 so I bought right in this area here it pops up it dips down and I got in right there so I'm long here it ends up going up to six up to 610 and I get out I take my profit it then squeezes up here and then it flushes down and I was like o that was not great but you know I'm green on it um how much was I green on it now I can't remember I think I was green $700 on it something like that then it comes down and as it rips back up I got back in here at 620 because I was like oh we're reclaiming this level and I'm like here we go we're in a good shape we're looking for the break of 650 and then it dumps down to 580 and I'm red on it now I'm red uh $300 on it so I I was green and then I gave back the profit I made and then it comes back up again and on this one I added back up here basically very similar setup as this one but this ended up pulling away to 75 to 880 and then up to 720 and I was pretty quick to take my profit off the table into that move and that put me up $1,500 on prtg so with that I was like all right you know what that's good enough I don't want to overstay my welcome because what ended up happening today with my p&l um was I started the day let's see so first trade of the day was on um ffi and I started in the day green but my first trade was a partial fill so I was up like whatever it was like a couple hundred bucks and then I got myself up 1,800 and then I came all the way back down basically to break even right and then I kind of worked my way back up pretty quickly to 4500 and then I dipped myself down a little bit and then I got myself up to 7,000 and then I dipped down again and I got myself up to 10,000 and I dipped down to about 8500 approximately and then I got myself back up to up 10 and this is where I say you know what let's just walk away here um obviously I already had this kind of close call I've already had a couple close calls today you know if you look at my sort of p&l so it's getting a little later in the morning and I just don't want to overstay my welcome because now you know it's Friday it's the end of the week and I'd be running out of time to recoup my losses if I end up taking you know a big loss at this time we're just we're just getting to that point of the day where if I push it too hard it's going to be a problem so as I step back right now and I look at the scanners our top gainers right now we've got prtg which was not good early but then you know rallied at the open surprisingly and then we had sqns which made a move early but 34 million share float I was like I don't think so but here's the thing I wanted to say so this morning when I first sat down um I didn't end up taking my first trade until 8:30 even though I sat down at 700 so I sat here for 90 minutes without taking any trades that's disciplined sqns it didn't look good so that one I said nope I'm not going to trade that prtg that one didn't look good either now mnts this one was on the scans but I looked at that and I said nope pre-market it's already it made its move after hours and now it's pulling back it doesn't look good and then we had um jti so jti hits the scans and this one ends up going from from 20 cents to 34 cents and all the way back down it's now red on the day so when I saw that I was like uhoh this is that that was kind of like one of my first warning signs that we we were going to maybe have an issue today so that was on um JT Ai and then we had um what was it there was another one I'm trying to remember um that was a round trip oh that's right we had um syta syta this one did a round trip as well and this was at like 7 70 700 a.m. 7 uh 7 7:30 so this one goes from 178 all the way up to three and then back to 178 so I was I was watching it I was looking for a safe entry but I didn't see a place where I could get comfortable taking big size it's like it just popped up too quickly and then next thing you know we were seeing these big Sellers and it was like you know I just I I I can't get comfortable on it so we had s yta we had JT and then there was another one um another penny stock but I can't remember it off the top of my head right now um if I scroll back here I'll see it but it basically early this morning okay yo that one popped up I was like nope that's not clean look at that pop and rejection sqns didn't like that so it just felt today like I don't know like we just didn't have the degree of momentum that I was looking for and so for that reason I was being pretty cautious oh ARB this was another one ARB this pops up and look at that rejection so after seeing like three or four of these pops and drops today I was like I don't know guys I I this might be a no trade day for me but then I ended up making my way up to $10,000 thanks to trading continuation and it really began with that first trade on ffie and that really powerful squeeze from 889 up to 11 you know then from there it's GDC and crkn and then that final trade on prtg if we look at another scan here we could check um top gain CH top change since the open so this is going to show us our biggest percentage changes since the open which is also kind of a helpful scan because some of these stocks are the top gainers since the previous close in other they were really strong maybe after hours or pre-market but today they're uh you know they're they're not they're not strong whereas this is showing the change from the open so apdn is actually leading our change from the open scan today with that really nice move but I think it's worth noting that our biggest change from the open is only 47% so in fact today the bigger percentage gains um were pre-market and of the stocks that were strong pre-market a lot of them have pulled back with a couple of exceptions apdn prtg ciso this was from yesterday it's up 20% but it's a really cheap stock so it's just it's it's just not super significant so you know as we come to the end of the week um and I pull up my metrics here one thing that I've been really happy with for the month of August is look at this profit to loss ratio average winners $550 average losers 312 so I've got a nice profit loss ratio check out the accuracy 69.4% 4 minute long average hold time for winners 5 minute for losers had a 15 consecutive winner streak but also had nine consecutive loser streak and my average daily gain for the month is $854 that is a great type of average daily gain I am really happy to see that and sitting right now with 468 trades now if we die in a little bit more um we'll go to days and times we noted uh I think yesterday that I've been doing really well on Mondays uh this month which is kind of unusual but that's just the case um but if we look at the time of day you'll notice sort of an interesting pattern I've been trading really well between like 6:00 a.m. and 10: a.m. and then nothing and then trading really well from 2: p.m. to 4 p.m. why because I've been teaching classes this month during this window so I when I teach classes I'm not trading so for all of our Warrior Pro uh Warrior Pro members and for even those of you guys doing a two-e trial you guys have been able to watch Me While I've been teaching these classes over the past two weeks I have retaught all of day trading the basics it is now a brand new 15 chapter course retaught all of the chapters so refreshed brand new so those of you guys uh who maybe have gone through the classes in the past you can always um you know re renew your membership if you're not currently an active member try to log in and you know email us if you have question questions but I encourage you to check out these new classes because they're really solid uh anyway so then price and volume you can see here mostly this month um doing well in the under 20 not really getting a lot of trades on stocks over 20 so just focusing on these lower price stocks and and branching in a little bit to even a few penny stocks here and there which is not my typical go-to but you know it works continuation setups have been not my uh bread and butter but this is a good measurement of continuation because this shows performance by prior day relative volume and so if the prior day relative volume I if we're if we're trading five times higher than the prior day or any of these this is fresh breaking news and these ones actually are stocks where we're trading day to continuation so actually I didn't even realize the extent of how much I've made this month on continuation setups more than I realized in fact quite a bit more than I realized now the way we view this table is that this shows my performance by relative volume so basically all of my profit is on stocks that have five times higher volume than their 50-day average but this is my Performance Based on the relative volume just compared to yesterday so let me give you the example of how this works so yesterday let's say um so here's a stock the average over the last 50 days um 50 days 5 Z whatever 50 days is let's just say 100,000 shares okay and then this one trades uh 10 million shares in one day so on this day right here on day two on day two it's still five times higher than the 50-day average even if this average goes up a little bit because of the 10 million here maybe it goes up to like 300,000 shares or something but it's still a low average because it's 50 days it's only one day that was high so this day trades 5 million shares it's still five times higher than the 50-day average but if it trades only 5 million shares it's actually only 50% relative volume versus the previous day so all of these trades right here are actually showing you stocks where I was trading second day continuation now I really am I really am surprised about this although perhaps uh one explanation is that we've had a number of stocks this month where the move started after hours and so the relative volume began with the after hour session but I didn't trade it after hours I waited for that pre-market move so then pre-market that was where I was catching that first uh the first leg up on the next day so that could be part of it but that is very interesting so that I didn't expect that if we look at this um I mean if we just look at this in in total numbers big picture we look at total numbers uh we go back to uh sort of the when I first started using the software which was in 2016 we'll see here performance by relative volume 50-day average yeah boom it's all there but again here a lot of profit is in this area but you know these are all continuation setups and then these are the ones that are just sort of in between So based on prior day right so generally it's got to be Way High versus the 50-day average but the prior day these are all continuation setups and when you think back you know GameStop that was a continuation setup a lot of those meme stocks were continuation setups they just kind of kept trending higher so I think at the end of the day when you step back continuation is riskier for some obvious reasons I mean we've got let's see we'll pull this back up we've got the fact that um with a continuation setup we're dealing with offering risk we're dealing with the fact that we have ascending resistance potentially we're dealing with declining relative volume they're not as obvious but when they work man they can work really well and we got a couple nice ones today and uh and I think that as an aspiring Trader as a beginner Trader it's good to be able to sort of understand this is a fresh breaking news setup and this is a continuation and start tracking your trades based on the two you'll probably find that fresh day one breaking news is going to be easier to trade I usually find that myself but if we have a continuation setup maybe start testing the water with small size and see if you can start capitalizing on some of that volatility that comes from shorts getting forced to cover as the stock moves higher and hey if you want to check out a two-e trial at Warrior trading I will put a link it'll be pinned to the top of the comments it'll be linked in the description and you can join me right here let's see I'm going to pull that down right there twoe trial There's the link so twoe trial at Warrior trading you'll get access to chapters one through six of day train the basics my brand new course you'll that I just taught these last two weeks that retaught it you'll get access to chapter one of strategies and scaling access to three badge holder interviews and you'll get access to Mentor recordings and some live trading archives so come join us for a couple weeks get a sense of what it's like to be part of the warrior Pro community and uh as always I'll remind you that trading is risky my results aren't typical so manage your risk take it slow and don't try to blindly follow me or anyone else with that I hope you guys have a great rest of the weekend and I'll see you back here first thing Monday morning I'll be live streaming for warrior Pro members
The words are the caption track's own and nothing is reworded or re-transcribed. Paragraph breaks are placed between sentences so the text reads as prose.
Free tools for your own script: paste a draft and see where it stands before you record it.
Paste your draft and see where viewers are likely to drop off, with a rewrite for each weak line.
Paste the first 30 seconds of your own draft for a hook score and rewrites.
Check your draft against YouTube's advertiser-friendly guidelines before you record it.
Read this channel's public videos and transcripts, and download a writing brief for it.