Getting the transcript
Reading the captions from YouTube. A video nobody has opened here before takes 10 to 30 seconds; this page fills in on its own.
Getting the transcript
Reading the captions from YouTube. A video nobody has opened here before takes 10 to 30 seconds; this page fills in on its own.
Ross Cameron - Warrior Trading · @DaytradeWarrior
Where viewers went back to watch this video again, from YouTube's public Most replayed graph, lined up with what was said at that moment.
Most replayed moment #1
8:508.1x the video's typical replay level
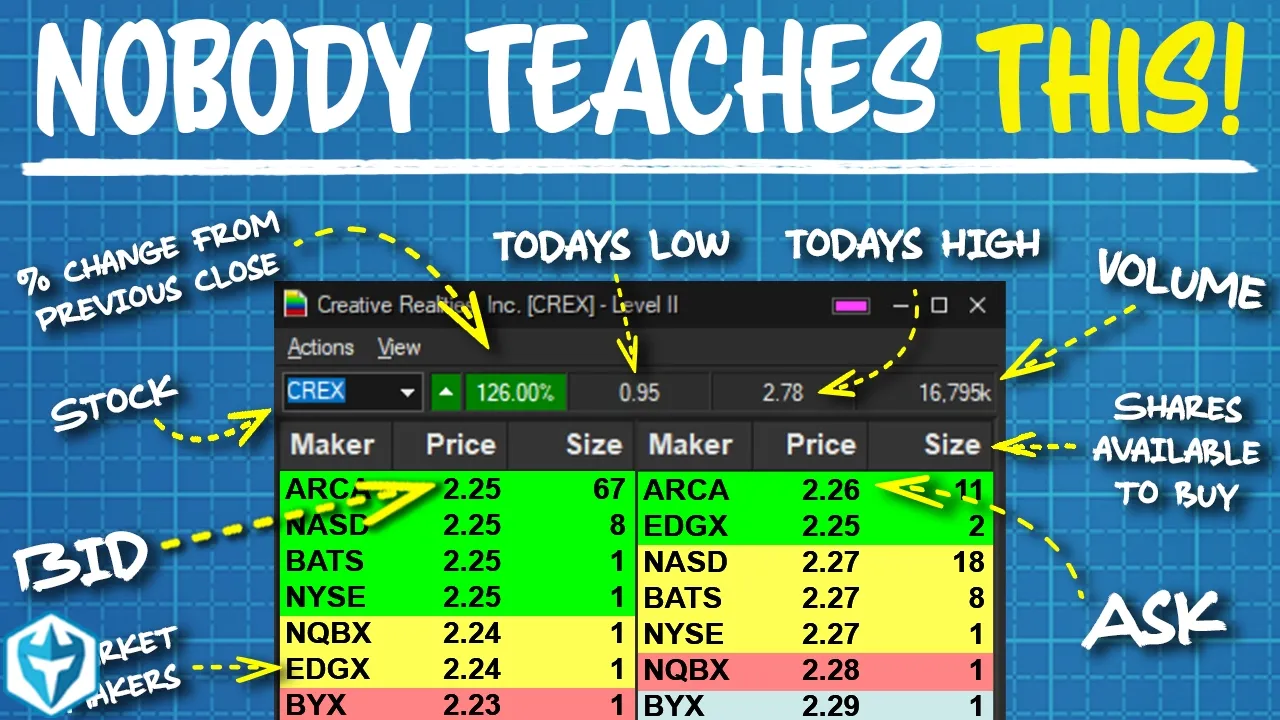
quarter spread is 25 cents an eighth spread is 12.5 cents those are pretty big spreads that was really good for market makers because a market maker creates the spread and they profit by selling shares back and forth across the spread that's how they make money all
Said at 8:42
Most replayed moment #2
45:476.0x the video's typical replay level
even quickly we had a bid there at 17 which is certainly nice to see when you've got a big position now we're 23 by 40 right okay 28 by 45 45 on the ask 44 by 50 I just added why would I do
Said at 45:41
Most replayed moment #3
6:044.4x the video's typical replay level
buyer you can choose to put an order order on the bid and you can wait for a seller to come and sell you shares you're a buyer you're waiting for a seller to come sell you those shares now uh when you alternatively want to just jump into a trade you can buy shares
Said at 5:57
The graph counts replays. It does not show where viewers stopped watching.
Words
10,452
Runtime
55:10
Speaking pace
189wpm
Reading time
44min
189 words per minute, between the 181 median and the 201 75th percentile of 349 measured videos. That distribution comes from the 349-video hook study.
Opening (first 30 seconds)
what's up everybody all right so today we're going to talk about day trading terminology and the term of the day is level two now as beginner Trader I really didn't know what level two meant so uh it's I suppose no surprise that I get uh tons of emails every week from traders who are asking what is level two how does it work how's it supposed to help me trading how am I supposed to read all of these numbers well level two data you can see um this is level two or
95 words, the words spoken in the first 30 seconds at 189 words per minute.
Free, no signup. See how the first 30 seconds hold attention, with rewrites.
Sentence shape
| Measure | This transcript |
|---|---|
| Sentences | 1 |
| Average words per sentence | 10452.0 |
| Longest sentence | 10,452 words |
| Questions asked | 0 |
| Sentences containing a number | 1 |
Most used terms
Filler phrases
305 in total: uh 92 · you know 74 · um 59 · like 42 · actually 13 · kind of 12 · I mean 6 · sort of 6 · literally 1.
A literal whole-word count of the same phrase list the Prepublish browser extension uses, so a phrase inside another word is not counted and a phrase used in its ordinary sense still is. It is a count and not a judgement.
Free, no account. See where attention is likely to drop, with a rewrite for each weak line. The free check shows the scores and the one issue costing the most. Or run it on the words above first.
Free · No login · See a sample audit first if you prefer.
What this transcript is
Every word below is the caption track YouTube publishes for this video, pulled from the video itself and reproduced unchanged. It is not Prepublish's writing, not a summary, and not a re-transcription: it is the video's own published captions. English captions, generated automatically by YouTube, in the video’s original language. Source: the video on YouTube. A channel that would rather this page did not exist can ask for its removal through the contact page, and it is removed.
what's up everybody all right so today we're going to talk about day trading terminology and the term of the day is level two now as beginner Trader I really didn't know what level two meant so uh it's I suppose no surprise that I get uh tons of emails every week from traders who are asking what is level two how does it work how's it supposed to help me trading how am I supposed to read all of these numbers well level two data you can see um this is level two or also known sometimes as Market depth right here and with this shows us is literally the depth of the market whereas traditional level one data simply shows us the bid and the ask in this case 1541 or 1536 by 1543 um you know that alone only tells us the price that's the only information that we get from level one data whereas level two data also tells us the share size and it shows us the number of buyers and sellers both on the bid and on the ask that are just outside the current uh level one quote so we've got our level one quote and then we have the depth of the market now by learning to read Market depth in level two we can start to um interpret Market sentiment just by looking at these numbers and that's really important every Trader needs to have their Edge and for day Traders reading level two is part of having that extra Edge if you're looking at just level one data and you see um you know the stock is is at 38 well when you look at level two data you may see that there's a 100,000 share seller at 38 so that would tell you oh I'm not going to buy this that's too risky whereas someone just looking at level one data is like oh I'll jump in this at 38 no problem they're not going to realize that the Stock's not working until it starts dropping and of course by that time you're already out because you saw that big seller so your losses are smaller and that's because you were able to read level two you were able to uh you know get that early exit indicator or in other cases an early entry indicator so we're going to go over how to read level two how to use it uh and how it can make you uh really a better day trader for me trying to trade without level two is almost like trying to drive with one eye closed can I do it yes I can is it does it make sense to do it no it doesn't and really there's not a single good reason why you would drive with one eye closed open both your eyes use the tools accessible and level two is one of them this is an important tool for day Traders if you're an active day trader you should be using level two so whether you're a beginner and this is something that you're just learning about or you're an experienced Trader who wants to uh learn more about how to use level two through this video my goal is that uh you know at the very end you'll feel like you understand the importance of this tool and you understand the basics of how it works now you guys should know this is going to be um sort of a cliffnotes version of level two and and I'll talk a little bit about level one uh in our fulllength courses at warriortrading.com we go into a lot of depth talking about level two and all the intricacies but we don't have time to do that right now and of course it's not fair to do that for the students who uh join our premium classes but you guys are going to get uh kind of the cliffnotes version and know that some of this stuff is the tip of the iceberg and it can get a lot more detailed so I don't expect by the end of this video that you're going to be able to uh you know profitably trade using level two data but uh I think that by the end of it you'll understand how important this tool is and you're going to want to learn more about it all right so uh with that said let's jump in here and start talking about level two day trading terminology now you can see here uh this is pretty much our standard level two window we've got our bid on the on the left and we've got our ask on the right and you can see here well that's interesting there's three sell or three buyers all at 230 well this is the depth this is showing us that when we see that quote of 230 by 231 that there's more behind that there's actually three people with orders to buy at 230 whether these are just market makers or they're actual retail Traders we may not know but there are three orders right here so let's say you're looking at level one data and you're like man I want to sell 10,000 shares but I'm not sure if I should by looking at level two data you can see hey there's a 15,000 share buyer right here at 230 so you know what it's probably safe to sell 10,000 shares cuz you're going to sell them right to him but if he wasn't sitting here if he was gone then all we have is 100 shares and you can't sell 10,000 shares to a 100 share buyer right so most likely you're going to sell 100 shares to him this is zero so that means it's less than 100 and remember you have to add two zeros so this is 15,500 this is 100 this is maybe 70 or something like that and as you scroll down so in this case if you sold 10,000 and all you have is 100 well you'll sell a 100 to him and now you're selling the rest to this guy at 28 but remember with 10,000 shares every single dollar is 100 bucks so when you're losing you know two cents because you're not looking at level two it's costing you $200 by reading level two you can make sure you get the best exit you can choose to sell when there is a buyer or you could choose to instead maybe put an order on ask and wait for buyers to come to you now in addition to seeing uh the price and the number of buyers and sellers at all these prices we also see all of these market makers and we'll talk about that more in just a moment so the most important thing for you to understand with level one and level two data is that every single stock has a bid and every single stock has an ask right that is universal as a buyer you can choose to put an order order on the bid and you can wait for a seller to come and sell you shares you're a buyer you're waiting for a seller to come sell you those shares now uh when you alternatively want to just jump into a trade you can buy shares from someone who's selling them at the ask price you'll pay a little bit more right but if you want to get in right now that's the quick way to do it uh one of the things that you'll notice is that some stocks have level two that's uh stacked very tightly where you have let's say the bid at $10 and then the next level is 99 the next level is 98 97 96 95 94 other stocks are spaced out a little bit more so you have a bid at $10 and the next closest bid is like 995 right and then $989 974 964 they start to get stretched out those are stocks that you can tell if someone goes and sends a 10,000 share order the stock could quickly drop all the way down to 964 some stocks can move very very quickly and others move slowly and we can understand that simply by looking at the level two so in a sense by by reading level two and looking at level two we can interpret the potential for volatility now as day Traders volatility is our friend we love volatility we look for volatility and we look for volume but volatility is only valuable when we have uh you know high volume and that's going to be the result of a catalyst so one of the things that we talk about extensively at Warrior trading is the importance of trading stocks that have breaking news breaking news is what brings thousands and thousands of Traders you know all across the world into the market to buy these particular stocks that's what creates the high volume that's what creates the big spikes and those are the stocks that it's worth uh looking at and watching looking at level two data on just any old stock is pointless we only look at level two data on stocks that are very active so this is a tool that we apply only to the right types of stocks to trade if you're not sure about the right types of stocks to trade then uh we have another video where we talk about that and you can also see that info on Warrior trading.com all right so um now you'll also notice that right some stocks have a thin market and those are the stocks that are spaced out a little bit more uh the bigger intervals those are stocks that typically also have bigger spreads now uh in 2001 give you a little bit of a little backstory here in 2001 the market underwent decimalization right so before that the market traded in fractions so stocks would trade uh in E and quarters and halves and stuff like that now that meant the spreads were bigger right a stock trading with a a quarter spread is 25 cents an eighth spread is 12.5 cents those are pretty big spreads that was really good for market makers because a market maker creates the spread and they profit by selling shares back and forth across the spread that's how they make money all day long now uh for them uh market makers they need to be incentivized to create the market on these stocks right and their incentive is that they can profit from doing that there's obviously risk in being a market maker as well so you know to offset that risk they have the profit which is uh trading stocks across the spread now thinly traded stocks uh since decimalization have seen even bigger spreads because there's less incentive for market makers to make the market on those stocks because they're so volatile all right so those stocks they often have a low float they're very thinly traded not a lot of market makers are making the market not a lot of active retail Traders have placed out orders and as a result those stocks uh are not very liquid and that means if you wanted to buy 100,000 shares you probably couldn't not at any realistic price the the the stock would move so quickly as you sent that order because there aren't enough sellers there to sell you shares that means that those stocks when they have really strong demand let's say it's a you know pharmaceutical company and they just have really good clinical trial results well once you have really strong demand those stocks can move very quickly in fact 50 to 100% intraday and I'm going to show you some videos um some live clips of me trading towards the end of this video uh where I'm trading these types of stocks that move 50 to 100% I have one that even moves 400% all right so the those are the types of stocks that we watch for day trading opportunities now that gets into a little bit of stock selection and stuff like that but it also comes back to you know thin Market or thick market and one of the things you'll realize as a Trader whether you're beginner or experienced is that all of these things we talk about these are all part of building your foundation uh and one block you know if you don't learn you know one piece of the puzzle it's going to affect everything else so building a strong Foundation every single block needs to be solid you need to understand level two just the way you need to understand Candlestick patterns the way you need to understand U you know how to uh choose stocks how to build a watch list these are all part of the blocks that make up your foundation and this is a foundation that ultimately you can use as the launching pad for your career as a Trader you know we've got traders in our room that are in their 80s so you could be doing this for the next 30 or 40 years it's important that you know if you're thinking about doing that you build a strong Foundation so in contrast to a thin market we've got a thick market and a thick Market is uh going to be a stock that has a very high market cap and is very thickly traded lots of market makers are making the market they see opportunity to profit uh and lots of retail Traders are may also be trading these stocks as Investments they don't necessarily move a lot intraday and that actually makes them uh great vehicles for long-term investment because they're lower risk but at the same time that makes them really unattractive for day Traders because they're not volatile so the desires of an investor are almost the opposite of the desires of a day trader and here this is a the level two of Bank Bank of America the Bank of America float is um over my 100 million uh Max threshold in fact it's 10 billion shares it's a huge float when they did their IPO and you know they've released so many shares out onto the market U that for this stock to move 30% it would take almost an unthinkable amount of volume for that to happen in one day there's 100,000 over 100,000 shares sitting on the bid actually there's over 200,000 shares that means if someone comes and sells you know a 200,000 share order which is like $3 million of stock uh it's not even going to move a penny right that's crazy but this is the reality of thickly traded stocks and again this means an investor who wants to come in with a million dollars can get in easily and can get out easily so there's value there but not for day Traders for day Traders we look for stocks that can move so we're going to be looking at the lower float stocks ideally under 10 million but anything under 100 million is is worth watching and these stocks are going to have slightly bigger spreads as you can see here they're not going to be as thick at all of the tiers they're going to be a little bit uh thinner you've only got one market maker at each tier and they're also spaced out a little bit you know 1110 1112 1114 so you've got a little bit more space and you can realize that it wouldn't take much for this stock to drop from 11:15 all the way down to 1080 or may maybe even 1050 you know this stock could drop 5% in a matter of 10 minutes and that's scary for an investor but as a day trader that's attractive that's potential all right so these are the types of stocks we're going to look at but again remember we only trade these types of stocks when they have a catalyst the rest of the year we don't even look at them but the good news is there's 250 trading days in a year and there's thousands and thousands of stocks on the market so we can almost always find a stock to trade every single day in fact this year I don't think there's been one day where I haven't found at least one stock to trade now when we're looking closer at uh level two you need to understand what we're looking at we've got the price right here in the middle we've got the order size right and plus the two zeros so 15,500 100 and then we've got the market maker so the market makers as I said create the spread by posting both a bid and an Ask they on both sides of the level two both sides of the spread all right now uh these are kind of if you think of this as an island each of these market makers create an electronic communication Network an ecn and we can use that as a bridge onto the island right this is the island and these are all the different bridges that we can take right to here to here to here well just like using a bridge there's a toll it's called an ecn fee and they charge you based on the number of shares that you're passing into the market market and there are some exceptions here with adding liquidity removing liquidity where you can actually get uh rebates you can actually get paid uh to send order flows through some of these routes but again that's a little more complex we're not going to get into that right now so the important thing to know is that there are many different Bridges or uh ecn networks that you can take to get into the market and you can actually specifically choose which ones you want to use or you can let your broker uh choose for you all right now this is what my platform looks like my trading platform is uh a small chart my level two my time in sales this is showing every transaction that goes through so while this is just showing the numbers this is actually showing the orders as they pass through and then this is my open positions and and the trades I've taken now um when we jump out of this yeah I'll show you just for a moment this again is a very thickly traded stock this is AKs and I'll just check here up on um let's see AKs is a how big is this float this is a very very thickly traded stock I'm not sure what the float is it looks like it's 200 this is my trade ideas window this is a 235 million share float so it's certainly not as thick as a stock like Bank of America which is going to be 10 billion shares but you know it's still very thickly traded and too thickly traded for us to want to um to consider it for a day trade there we go it's a little slow there now um we'll talk more about the time and sales in a moment but for right now we're just you know talking about uh the level two data and and level two in general all right now you can see here down at the bottom this is where I can send my orders and I can choose you know to short to buy my order size share size and right here you can see where I've got Market this will send a market order well I actually don't use Market orders I use limit orders but when I choose this when I click this button I'm I'm going to get a drop down of all the different routes that I can choose NYSC NASDAQ ARA bats edx Etc all of these are available and I can choose from them so how would I choose which one to send to well routes these are uh our bridges onto the island okay and a lot of Traders like using ARCA that's one of the most popular uh Ed X is also popular NASDAQ is popular um NYSC jpcc post these are some others you can see here this is my drop down of all of the different routes that are available with speed Trader and speed Trader also lists the various fees for these routes some of them are uh they charge fees others will give you credit they give you a refund a slight refund it's not a big one but you know if you're trading with large size it can certainly add up and then they also have here um smart speed Trader smart this is their own Uh custom route and what it's going to do is it's going to route your order to uh whichever route they think is going to be fastest all right this is an important thing to understand I personally don't use Smart routing I prefer to direct route my orders so when I do direct routing I just go and I click on edge or ARCA or inet and I can also use a hotkey to automatically choose these routes the problem with smart routing most Brokers offer smart routing and the problem to me is that instead of asking you which route you want to send to your broker is going to route to you know whichever ecn they feel is best they may have an arranged discount rate with a certain uh you know with a certain broker certain Market maker um and use that as the preferred route that may be good for the broker but it may not be good for you you may also run into the issue where the broker routes the orders internally to see if someone inside The Brokerage is available to match your order and then they your order doesn't even get sent out to the open market now all of that slows down that creates latency I prefer not to do that I want really fast orders so what I do instead is just simply uh direct route my orders to one of the you know one of my top three market makers uh ARCA NASDAQ or Edge those are the three that I like a lot uh by doing that the orders may still get rerouted and I'll show you why that would happen uh let's back up here so let's say um I'm looking here at bats well you or you see psse here on the bid well that's fine PSC is on the bid but if I send the order through Edge x what happens Ed X is all the way down here at you know what is it 50 or something like that does my order go through at 50 no it goes through at the current best bid market makers have an obligation to give you the fill at the current best bid and that means if they don't have the shares they reroute it to whoever does and this all happens very very quickly so when you're routing orders you can choose to not ow them to reroute and send them out somewhere else uh which is not smart in my opinion or you can let them reroute it and that way if you send an order through ARA but there's only Edge X ARA will send it to Ed X you send it to Ed X and there's only psse they'll send it to psse and you'll get your fill all right that's important the most important thing here is you know when you want to get into a trade that you can get filled quickly all right so I don't use Smart routing I just use direct routing now dark pools right this sounds ominous dark pools of liquidity dark pools are like ports on the island that are kind of like you know hidden in the fog nobody can see them but they're there right and there may be someone at one of those dark pools that's selling 100,000 shares and you want to buy 100,000 shares the problem is most routes don't check the dark pools they can't see them they don't check them so when you send your order to buy 100,000 shares even though there may be someone at one of these quote dark pool that have the shares uh you're not going to be able to get them and you're probably going to end up paying a higher price because you're trying to buy from you know this limited group of sellers that that may have the shares this is a disadvantage for retail Traders uh institutional Traders uh firms um the big Brokers you know sometimes they trade internally and so they end up pull pulling some of the liquidity out of the open market and and they have it almost you know kind of reserved internally so one of the things that's really cool is that we can now ping the dark pools so it's kind of like sonar even though we may not be able to see it visually we might not see it on the level two you can send an order to to buy a stock or sell a stock you can send the order in between the spread Sometimes It's a 65 by 68 you could send the order at 66 in between the spread and sometimes you'll get filled because there is someone out there that has an order at 66 on the dark pool you just can't see it here on uh sort of the front-facing level too so dark pool routing is a pretty cool thing and this helps us especially if you're trading really large size if you're trading a th000 shares or 500 shares it's not not going to make a big difference but when you start trading with big size 10,000 20,000 30,000 or more well every penny starts to really add up so getting good fills is important and that's when you start using dark pool routing to see if you know there is some hidden liquidity available now in addition to looking at your standard level two uh just to the right of level two you have your time and sales all right so time in sales is showing every single transaction that occurs and it's going to list information about that transaction the price the shares the route and the time so if we look here we again at this example that I've got on my screen we've got akao this is our level two and over on the side we've got this is our time in sales now I can choose um let's see I can choose which columns I want to display um where is it I guess it's just properties um and I can show more information if I want to see more information for whatever reason um for me the price and the size is more than enough but you can choose to show uh the routes and you can show um some other things as well for some reason I can't remember where to change the um the oh maybe it's right here trades only I don't know in any case um there are some things that you can do to see more but in any case what you're looking at here are transactions transactions that are R are occurring at the bid price right now even though this would be considered you know red it's a sell you're selling to someone who is buying at 59 so even though this person is selling someone else was buying but we consider it red because it took place at the bid price and it's showing weakness green orders are at the ask price and white orders are in between the spread okay so just by looking at the time in sales even if we you know decided not to look at this at all just by looking at this we can also start to interpret Market sentiment right we can understand there's lots of buyers here or there's lots of sellers here and this is called tape reading learning to read the tape right here we've got a little bit of a batch of of buying going through a lot of buying a lot of green orders and you can also look at the order size you know how big are these orders is this large size is someone really accumulating a large position you know or is it smaller so we had a little batch of buying there now we've kind of shifted to a little bit of selling so this is also an important tool and it really goes hand inand with level two you know level two you'll see all these numbers moving but these go together right when this goes from 100 to zero it's because someone bought 100 shares right when this goes from 600 to zero it's because someone sold 600 shares so this helps us understand what's happening on both sides with the level two and the time in sales all right and this also is a visual representation of the volume that's occurring on every single Candlestick right this is volume this these are transactions these are shares that are being traded and on this stock in the last 5 minutes we've had 580,000 shares of volume so 580,000 shares have gone through right here and you you know that helps us understand for sure if this stock is being thickly traded or if it's being thinly traded and you could look at a stock for instance you know again I'll go back to Bank of America this is a stock that um you know trades tens of millions of shares of volume on on most days it's very very thickly traded whereas a stock let's just say pack B for instance this is a stock that today has only traded 4 180,000 shares really hasn't traded that much the level two surprisingly looks fairly uh thick but this is a pretty thinly traded stock optt look at this one this one's also pretty thinly traded stock you know you've got more space in in between the intervals you know 8 10 12 14 15 18 34 so you know this could move up to 34 fairly quickly or down to you know maybe even 288 fairly quickly this is a stock that in the past has made big moves from $250 to $6 right so this is a stock that has the PO potential to really open up now the way I look at level two is is this sort of traditional way this is an e signal and then the examples in the uh slide when we start showing when I start showing you live examples are on speed Trader and this shows you the um the bids on the left and the ask on the right now another way of displaying this is the way uh TDM a tray does it which is it's all in one column now this is interesting because this shows you the bids on the left left and the ask on the right but it shows you the price in a line and this kind of helps you see in a way where we have resistance right we have resistance coming up at you know at a certain price let's just put up a chart here um akao for instance this one we've kind of been watching so we know this is probably going to have some resistance you know up in the 90s so if we saw for instance a 10,000 share order at 90 and maybe a 100,000 share order at 16 we would think okay I'm seeing resistance I see it on the chart and I see it visually here in the orders that someone has a big order to sell up high so this is kind of an interesting way to view level two um but for me I don't like viewing it in this way because I just personally find it a little bit difficult to read because of the way it's sort of jumping around here it's just not as easy this to me is easier to read and easier to understand and that may just be because I've um traded with this type of level two for a lot longer all right so uh now that you have sort of an understanding of level two time and sales um I'm going to show you a few examples here um of me actually trading um in real time so these are uh recordings that I took at some point over the last uh few months and you can see here this is a stock OPN now on this one we're going to be looking for um big bids and big sellers all right now I get in this in anticipation of the break of the whole dollar I like to buy stocks at whole dollars and half dollars so I buy I've got an average here of looks like four something I've got a pretty good average on this one actually um but I added here for the break of $5 and looking for that squeeze over the whole dollar this is OPN all right so one of the things that um you know you can see here is we've got a fairly big spread 70 by 90 that's a 20 spread so just in between that spread with 10,000 shares you've got $2,000 of potential profit that can be a little bit difficult to trade when you have stocks that have big spreads so when we have a big spread I always try to sell at the ask price I try to get the best price I can that means I put an order like I have right here to sell at $4.99 knowing that when people start buying that order will get filled SO waiting for people to buy at 999 now if no one Buy see someone just bought and I got filled at 99 so got my fill on the ask if no one buys then I can also just cancel that order and sell to someone who's already showing they want to buy on the bit and that's what I did there I I just flipped out and sold I think it was half at 87 on the bid and I do that from time to time because of the fact that look at how fast this stock just went down 45 cents right that's pretty crazy I sold the rest at 455 that right there is volatility and what this represents presents also is an opportunity this is a stock that has the potential to move very very quickly right in the right circumstances so this is a stock that had news this is a stock that on this day and right between these two trading accounts I'll make over $5,000 now the reason I was trading into two accounts is because this month I started a $11,000 trading account over on the right hand side and then I also had my regular trading account so with the small one I was seeing how quickly I could grow $1,000 account and at the end of this month I had made $765 so was 76 3% gain in one month and then the problem of course is that trading with a very small account I couldn't really make a lot of money so when I saw really good opportunities like on a stock that I thought could move 100% I would trade it also with my regular size account now one of the things that we're going to look for on this stock is a really big bid this big bid is going to show us some Market sentiment it's going to show us a strong level too and so when we see that big bid we realize that either someone is putting out a really big order you know to buy this stock or potentially someone is short and they're trying to cover that order and the only way you cover orders is by buying and when you've got a stock that's up 100% this is up 100% right now anyone who's short from yesterday is down big time right so this is the type of thing where those people may just start to cover and just throw in the towel in fact their broker may even be covering for them because they've hit a margin call so when Brokers do that they're just going to Market in they're going to just unload and then you see more buying that's what creates that imbalance between buyers and sellers not only do you have buyers who just naturally want to buy the stock to get a piece of the action you also have buyers who are covering short positions so that multip the number of buyers and that creates an imbalance between buyers and sellers when you have an imbalance on this type of stock you can get extreme moves parabolic moves and again this represents an opportunity for day traders who know how to capitalize on these types of um setups all right so we're watching this you know trading kind of between 480 and and 540 which is a really big range now one of the things I'm going to fast forward this um that we're going to see in moment is we're going to see a pretty big bid show up let's see where is this guy um it's going to show up at 510 it's going to be an 87,000 share there he is 87,000 share buyer see that that's a pretty big order right that's I mean that's a very large order 87,000 shares of a $5 stock I mean it's a lot of money so this is a person you know putting out an order for you know almost half a million dollars in in stock that's a big order now we don't know if this person is uh short and trying to cover or if they have a long bias and they just genuinely want to buy this stock we're not really sure what's you know the the exact reason behind the order but we can look at that as a very strong level too this is a very strong um you know buyer here this is someone propping up the stock essentially so we'll watch this for a couple more minutes here let's fast forward now we come down we test the buyer at 510 and he holds right he's not moving he's not budging so we test support support is solid and then we bounce off that level and start to Surge up and this stock is going to squeeze all the way up to $6 right it's going to be up about 140% now what you're going to see here in just a moment let's see there we go now we've got a 180,000 share buyer and see how I as soon as I saw that I pressed the buy button because I knew that meant this stock could go to $6 when you see someone putting out an order to buy 180,000 shares of stock that's a big deal right now again remember someone who's just looking at level one data they don't even see this right they're at such a disadvantage they don't even recognize so now I've increased my size I'm looking for this to break out over $6 and I'm also keeping my eye out like okay oh here he is he's popped back up and he's at 75 now with 37,000 shares so there's someone with some really Deep Pockets who is propping up this stock whether he's buying or covering a short position uh we're seeing some extreme volatility so you can see right now I'm up about $2,700 in this account in this account I was down 1,000 and look he's propped up now he's at he's at 610 this guy keeps moving it up it's pretty incredible if you weren't looking at level two you wouldn't see any of this now remember we're only looking at this stock because it has a catalyst now he's up at uh 20 now he's up at 30 he's going to move up to 650 I mean think about how quickly the stock is moving we're up 145% right now so now he's now he's there at 650 655 670 on the ask so again we've got a little bit of a spread I would try to sell on the ask if I could and this is a stock that that's going to just continue to rip higher and higher we get up there's $7 right we're up 150% okay so that's the importance of being able to read level two when you can read level two you can start to interpret Market sentiment now just the way we're looking at these big bids here if we popped up and we saw a really big seller we saw 160,000 share seller I would bail out of the trade I would get out of it I would be I would sell I'd be like no there's someone holding it down and I don't want to be in this stock while we've got someone holding it down but in this case we've got someone on the bid propping it up and that's providing us support and that can effectively create a short squeeze where all you have are buyers you don't have Sellers and that's when stocks can go parabolic so when we talk about stocks going parabolic um we have to at least just for a moment look at drys this is a stock that went from $4.50 to over $100 per share in one two three four days that right there is potential that's an opportunity let's look at rgsc this is a stock that in two days went from $2 to $8 these are stocks that just explode and this represents an opportunity where traders who were smart were able to capitalize and make tens of thousands if not hundred hundreds of thousands of dollars but every time we take a trade we're looking at the level two we look at the level two to understand is this strong do we have uh you know some some buyers or do we have a big overhead seller holding it down this helps us understand the current market sentiment all right so let's look at another um another live trade here this is going to be 100K share 100,000 share seller uh holding down the level two all right so we we're looking at this kind of squeezing up looks good looks good and we're going to see him down here and as soon as we see him it's like forget about it get out of the way don't want to still be long this stock cpxx so right now looks okay we've got you know 4 Cent spread looks like it could really move I'd be thinking $12 you know I kind of look at this as like stocks and half dollar and whole dollar increments those are targets that I usually put at it put on them so 1150 to 12 1250 to 133 so right here 1170 1173 oh there we go look at that 1175 see that big seller that is not what you want to see a 100,000 share seller we're not going to be able to break through that level I mean we could but we would need 100,000 shares of buyers to take out that order right so when we see that type of thing usually traders who see that just start to sell they get out of their position they say forget about it and so look the stock is starting to dip now if you were just looking at level one data and you were just looking at the chart maybe you'd be selling now at 63 you know or maybe at 60 or something but because I'm looking at this level two data and I saw that seller right away I had an opportunity to get out sooner that's part of what gives me my Edge as a Trader all right so let's see let's look at another example um here we go we've got um trading in the sh Trader account's see which one is this um all right so here we're going to see a 17,000 share seller um looks like it's 26 22,000 at 217 all right so we've got a seller at 217 and sometimes when we see those sellers if we see them start to get taken out where we see so I just got in at 207 I'm long the stock when we see at 217 and it goes from 20,000 to uh 18 17 16 15 15 14 13 12 11 10 9 and it starts to get bought up I will buy just before it breaks because I I know statistically that we get a quick snap as soon as we break over that level we get a quick pop and that's exactly what's going to happen here and again if you were just using level one data you would never see this but this is an opportunity right here where I'll be able to make a quick little profit so I'm watching I've got my order ready at 18 Okay so we've got 17 on the ass 20,000 shares 17 ,000 all right now we're going to watch this we're going to watch the buyers okay we dip down for a second 17,000 still on the ass now 12 by 16 are we going to get some buyers to come into this I've got my order ready all I have to do is click the buy button no confirmation 177,000 16 15 14 12 7 I double and now instantly I'm up almost $100 on that position right now I've got 400 about $400 unrealized profit I put my order to I'm ready to sell on the ask I put an order there to sell looks like at 29 something like that putting out orders on the ask so now I'm going to be up here in the stack right if the stock continues to squeeze up I'll start to get out sold a th000 shares at 25 right I've got another order out there to sell some more so I can put my orders out there as well now what some Traders will do there we go there's there goes 2,000 more shares out at 25 and I sold the rest taking the profit so gbim looks like it ends up being $200 $250 which is not bad and this is thanks to being able to see level two data so when you're looking at level two and you're trading level two it can get into scalping right very very quick trades but it can also be long holds where you're just waiting for an exit indicator and you use level two to try to find that exit indicator and this can also be just simply what you use to get into the trade and then once you're in the trade right and you feel conf confident in the in the price action and the market sentiment that's being displayed on the level two you set your stop at the low of the pullback now that entry there you can see at 207 that was the first candle to make a new high stop at the low of the pullback this is a a five minute U this is one minute and then the 5 minute was over here a bull flag right very simple pattern that we see all the time so it's not a coincidence that at the breakout point there was a seller sometimes you have some resistance at the breakout points and sometimes that resistance holds and we can't break uh as we saw in the last example with a 100,000 share seller and other times we break and then we pop up all right so this one here we're going to see another example um see what this one is all right so this is a stock that is halted all right so we've got a stock halt now if you're interested in circuit breaker halts we also have a great uh terminology video where we talk all about circuit breaker halts and I show you some examples so this is a stock that was halted um we've got a pretty big spread as you can see all right pretty big spread 167 by 168 now this stock is up 240% I put it out an order to buy and I filled 900 shares right here at 67 and 68 even though this is about to get halted right here sometimes just before the stock gets halted you have an opportunity to get in and so I now have 1,400 shares from 167 this just squeezed up and get halted again now we're at 195 right so holding still now when stocks get halted there's nothing we can do we see this very thick level too nothing we could do about it these are stocks getting halted on circuit breakers they're moving they're exceeding uh the volatility that they're allowed within a 5 minute period and as a result they get halted for 5 minutes all right now here we go this is a stock that is right now up 46% so I've got my order to sell some on the ask there we go sold some on the ask at 250 it's a pretty thinly traded stock but you can see even right here 47 by 55 is not a bad spread 54x 55 and now right here we're about to get halted okay so we're outside our volatility bands which gives us 15 seconds if we stay outside for 15 seconds the stock will be halted and now we've got a p for pause the limit up limit down volatility Hal all right so this is now paused and I've locked up $870 and I'm still holding 300 shares from a167 which is pretty ridiculous right1 67 I'm going to be up almost 100% on that position all right so let's see um let's fast forward this oh here we go all right so we were going to resume here and looks like we might drop for a second and anytime this stock moves more than 10% it will get halted right right now we're working with um looks like 10% circuit breaker halt so we go up 10% we get halted we go down 10% we get halted so I sold the rest of that position it's a $1,000 profit and being able to trade stocks that have just been halted is all about reading the level two if you can't read the level two if you can't see those big sell sers or those big buyers you can't trade them so that's another um really important value in being able to read level two all right and now here we go let's see which one this is this is optt right here up in the top and I'm getting in this here for the break of $3 right so this is my whole dollar breakout I love getting in for $3 rolls $4 roll the whole dollar break so I'm long at 290 with 2,800 shares I'm right now up on the ask about $600 but I'm holding still holding the position thinking that this has more potential more room you can see here how quickly it goes from break e you know up to break even quickly we had a bid there at 17 which is certainly nice to see when you've got a big position now we're 23 by 40 right okay 28 by 45 45 on the ask 44 by 50 I just added why would I do that I'm adding because I see the strength now I recognize potential I'm seeing that lots of Traders are jumping into this and this could squeeze up to $4 look at that now see how I'm I'm selling a little bit right here at 78 selling 3/4 in my position locking up 2,400 now I've got $2,929 of profit right here at 84 we're outside it looks like we're just about to get halted we're getting outside those volatility bands and now we've got $4 by 425 403 by 425 so we're right on that verge of getting halted on a circuit breaker Now Stocks in the first 15 minutes have looser uh thresholds before they'll get halted so that's because the market has Peak volatility in the first five minutes and so it allows stocks to be more volatile see what the level two is doing here it's pinned to 25 this is going to get halted and of course in hindsight if I'd held the whole position would have certainly done better on this trade but you have to have a strategy for trading and my strategy is that once I have profit I start to take some off the table sometimes you end up kicking yourself for it when stocks like this end up running you know my entry is 315 and this stock it just hit a high of 489 but look at how fast it came back down to 380 so I sell into strength you can never know exactly where the top is but I try to put those orders out on the level two s into strength now on this one I ended up adding for the break because I saw a big buyer now let me actually just rewind that for one second um let's see when I this was halted dropped back down and then the first candle to make a new high I'll get back in over the half dollar loving loving those half dooll entries okay so I'm ready to go watching this here watching the bid let's see going to be looking for the first candle to make the new high here and then first candle to make the new high and then move right back up towards high of day so I've got my order ready so I'm not sure if I fast forwarded this or I rewound this where was it here it is okay so right here when we pop back up and we see this I start to add for the half dooll break and now we see a 10,000 share buyer right here 10,000 share bid at 52 and look at how that's flashing I've got orders out to sell at 94 this hit High a day and I was able to flip out orders at 94 and I'm up $4,365 in 10 minutes of trading that's I mean that's more than most of monitors make in a month really and to make that in 12 minutes is ridiculous level two is a huge part of that imagine trying to do that without this tool just looking at the charts you wouldn't be able to do it this is so important learning how to read level two is what can help take your trading to the next level but remember level two is a tool and we use it specifically on certain types of stocks so whenever we're trading we have to come back to are we trading the right type of stock right and if you're not trading the right type of stock then obviously that's a problem we need to focus first on the right type of stock we need to focus on managing risk making sure that you understand every trade you take carries risk but you can reduce your risk by only trading the strongest setups I focus on a 2 to1 profit loss ratio so that means I risk 100 to make 200 and sometimes I risk a th000 to make 2,000 sometimes I risk 2,000 to make 4,000 on my best day this year I made over $110,000 my best month was a34 ,000 winning month so sometimes I do increase the risk but it's all because I know I can justify the risk right I risk a th000 to make 2,000 it has to have a reasonable profit loss ratio you understand risk you understand how to choose stocks with home run potential the stocks that are um you know lower float with a catalyst with breaking news and with super high relative volume thousands and thousands of traders that are looking at these stocks and then you take your entries on the bull Flags the Flatt top breakouts you set your stop and you hold it as long as you can you watch the level two you look for those early entry signals those early exit indicators and at the end of the day if you have the metrics to be profitable then you can do really well as a Trader the last 12 months I'm up uh just over $200,000 about $210,000 and it's trading two hours a day now all the students that we work with we put them on our trading simulator and the reason we do that is because we want want to watch how they're trading now learning to read level two is something that takes time it takes practice the best way to practice trading is trading in a safe environment right when you trade in a safe environment then if you lose money the losses are not real having that period where you can practice it's I mean it's invaluable if I had had that it would have saved me over $30,000 in trading losses that I incurred during my first 18 months as a Trader so in our simulator here I can log in and I can see um you know what our students are doing I can I can actually look at their trades and understand uh if they're making good decisions or if they're making bad decisions right whether they're you know holding positions from yesterday whether they're taking too much risk and that sort of thing now we also allow them to go and actually see all of their stats so let me pull this up here um they can go and they can look at their statistics because once you're uh practicing you need to understand well where you know what are my metrics right now every Trader who's trading has metrics so you either have metrics that are um sustainable and that will allow you to be a profitable Trader or you have metrics that are um you know the metrics of a Trader who's going to lose money metrics come down to your accuracy and your profit loss ratio if you have good profit loss ratios and you have good accuracy then you can be a profitable Trader long term so we look at your metrics and then we understand based on how you've been trading in this simulator you know for the last 30 days if you'd been trading with real money would you have been profitable and once you have you know two months under your belt where the answer is yes then you're ready to transition to real money so during the first 90 days you're watching level two you're trading side by side with me right you're looking at all of these same things the only difference is that all of your trades are practice and then when you log in and you want to check um your stats you can log in you can see your metrics and you can understand you know over the last 30 days or whatever it is what were you doing right what were you doing wrong so you can understand your average daily volume your win rate your profit loss ratios you know your average losing trade versus your average winning trade this uh this level of um Insight really for a beginner Trader is is invaluable this is what tells you what you need to focus on to get better right this gives you that feedback that direct feedback and I wish even my uh like my live brokerage account had this because it would be so interesting to be able to see uh my metrics you know through reports that they offer so um you know I just wanted to touch on this because as Traders are looking up terms like you know level two and market makers and dark pools stuff like that inevitably 90% of Traders will fail okay you have to realize that they fail not because they're not trying hard but because they lack the strategy the framework and the support uh to trade profitably okay so trading profitably uh it is an option all you have to do is focus on your metrics focus on one strategy learn how to choose stocks with home run potential learn how to manage risk learn how to use the tools like level two like your hotkey and then you're going to be well on your way to being a profitable Trader all right guys so I hope this has been helpful this is a long uh day trading terminology uh session here but uh I'm sure that you guys got a lot out of it so if you have any questions please email me rossit warrior trading.com or put your comments uh down below all right thanks guys let's be honest if you made it this far you must have really enjoyed that video so what's stopping you subscribe right here and get email alerts anytime I upload new content until then Happy surfing
The words are the caption track's own and nothing is reworded or re-transcribed. Paragraph breaks are placed between sentences so the text reads as prose.
Free tools for your own script: paste a draft and see where it stands before you record it.
Paste your draft and see where viewers are likely to drop off, with a rewrite for each weak line.
Paste the first 30 seconds of your own draft for a hook score and rewrites.
Check your draft against YouTube's advertiser-friendly guidelines before you record it.
Read this channel's public videos and transcripts, and download a writing brief for it.