Getting the transcript
Reading the captions from YouTube. A video nobody has opened here before takes 10 to 30 seconds; this page fills in on its own.
Getting the transcript
Reading the captions from YouTube. A video nobody has opened here before takes 10 to 30 seconds; this page fills in on its own.
The Inner Circle Trader · @InnerCircleTrader
This video has no Most replayed graph yet: YouTube shows one only once a video has enough views. These are the moments viewers replayed most in The Inner Circle Trader's most watched videos.
Most replayed moment at 51:50
3.7x that video's typical replay level
Okay? So, now we have two points of reference. Now, when I have this like that, I have two little sweet spots in the previous day's range and to the left of that, why? Cuz we're going to go back 3 days.
Said at 51:44
Most replayed moment at 12:06
4.1x that video's typical replay level
So we have relative equal highs during lunch macro, 11:30 Eastern time to 1:30 p.m. Eastern time. The setup usually forms in the first hour of that 2-hour lunch period. Okay? So between 12:30 noon
Said at 11:59
Most replayed moment at 10:06
3.2x that video's typical replay level
towards that of this buy side imbalance or side inefficiency, which is a suspension block, which has a volume imbalance on the high end and a volume imbalance on the low end. All right, so let's move into the lower time frames now. So, we're at a 1-minute chart.
Said at 9:58
The graph counts replays. It does not show where viewers stopped watching.
Words
3,409
Runtime
24:56
Speaking pace
137wpm
Reading time
14min
137 words per minute, below the 160 25th percentile of 349 measured videos. That distribution comes from the 349-video hook study.
Opening (first 30 seconds)
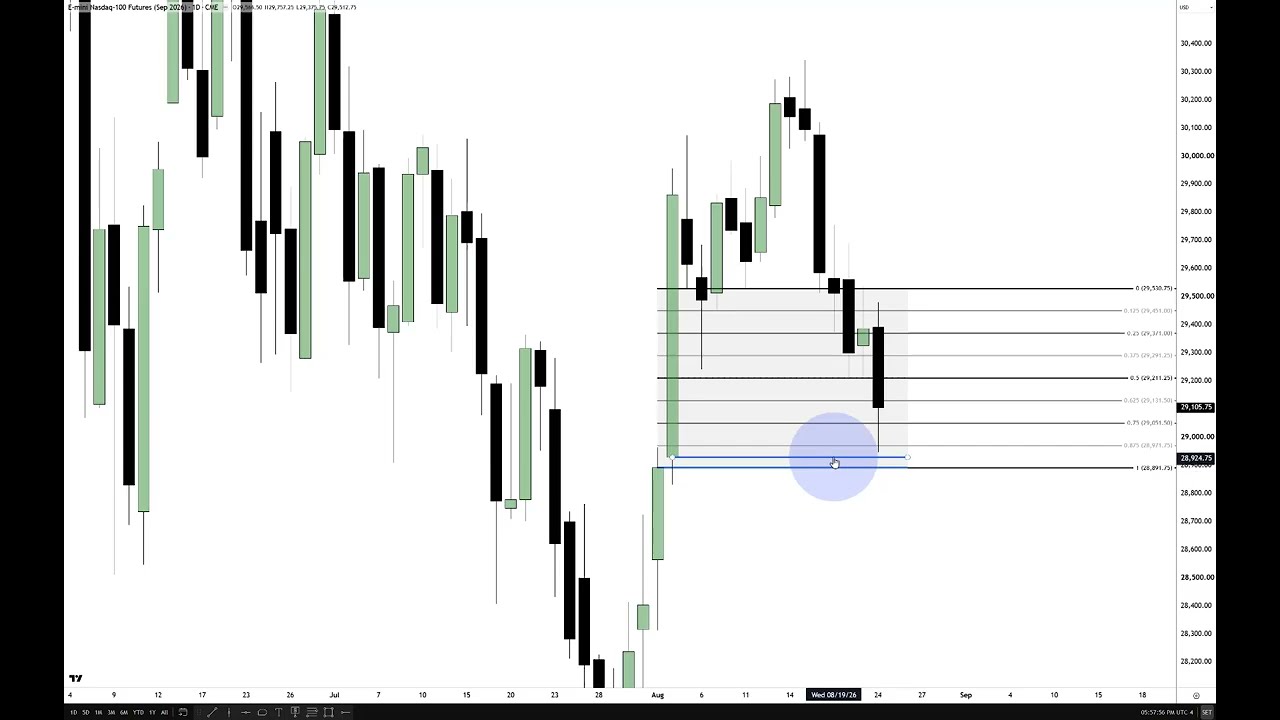
A gang, how are you? All right, so we're looking at the daily chart for Nasdaq 100 delivery. And if you've been keeping tabs on me, I've been [clears throat] telling you that we were likely to draw down into this buy-side imbalance, sell-side inefficiency. So, we'll look at that added to the chart here. So, notice this area is just slightly grayed out. All right, and when we're
69 words, the words spoken in the first 30 seconds at 137 words per minute.
Free, no signup. See how the first 30 seconds hold attention, with rewrites.
Sentence shape
| Measure | This transcript |
|---|---|
| Sentences | 343 |
| Average words per sentence | 9.9 |
| Longest sentence | 37 words |
| Questions asked | 39 |
| Sentences containing a number | 26 |
Most used terms
Filler phrases
46 in total: uh 19 · like 10 · you know 8 · um 4 · right? 2 · I mean 1 · actually 1 · literally 1.
A literal whole-word count of the same phrase list the Prepublish browser extension uses, so a phrase inside another word is not counted and a phrase used in its ordinary sense still is. It is a count and not a judgement.
Run the check on the words above: where attention is likely to drop, with a rewrite for each weak line. The free check shows the scores and the one issue costing the most.
What this transcript is
Every word below is the caption track YouTube publishes for this video, pulled from the video itself and reproduced unchanged. It is not Prepublish's writing, not a summary, and not a re-transcription: it is the video's own published captions. English captions, generated automatically by YouTube, in the video’s original language. Source: the video on YouTube. A channel that would rather this page did not exist can ask for its removal through the contact page, and it is removed.
A gang, how are you? All right, so we're looking at the daily chart for Nasdaq 100 delivery. And if you've been keeping tabs on me, I've been [clears throat] telling you that we were likely to draw down into this buy-side imbalance, sell-side inefficiency. So, we'll look at that added to the chart here. So, notice this area is just slightly grayed out. All right, and when we're looking at price moving down into these types of imbalances, we want to grade them.
Okay? Uh the first important thing we wanted to see was did we get a close below midpoint of this wick, which is consequent encroachment, and we got it right there. So, we knew last Thursday that likely it was going to go down. Next order of business is this buy-side imbalance, sell-side inefficiency, and this volume imbalance between the two bodies that are separated there, even though there's wicks connecting the two candlesticks.
The bodies are telling us useful information. So, if we roll over here, it started up at 6:00 p.m. overnight going into Tuesday's regular trading hours tomorrow, just be mindful of that volume imbalance, and then we have a small little fair value gap right there. Okay? So, remember I told you we would clear out these highs, and then this SIBI, and the consequent encroachment of this wick, and then how we left all this here.
It failed to show willingness to want to go higher. Sharp displacement lower. Nothing up here is smooth. There's several pockets of inefficiencies in here. We have this big volume imbalance, this volume imbalance, and have the remaining portion of this buy side imbalance sell side efficiency. So, I'm going to add the Fib levels, drawing it from high down to the low of the volume imbalance, which is this candlestick's close.
Now, I'll drop down to 1-minute timeframe and get through this rather quickly. I have things I have to take care of. Have a wonderful weekend, and let's go back over here. So, we had new week opening gap here. Already? So, you can see that here. Make sure I have that correct. So, 74.25. Don't have that on there correctly, appears. Be 74. And 25, right? Close. 74 even. Yeah, okay, good. Just want to double check that.
Some of you Hardy boys out there like to [laughter] figure out the mystery of why my level doesn't gel with yours. It's the old man's eyes. It's It's not intentional. Or is it? Forced forced homework. You got to go in and check the old man. All right, so anyway, the market opened up here at 6:00 p.m. Sunday morning, or Sunday evening, rather. And then traded lower aggressively. And rallied back up, climb back up into a quadrant level of that buy side imbalance sell side efficiency on the daily chart.
See the background? It's a little graded out, okay? Versus the white that's over here in the price axis. Remember, we're inside that large imbalance. Market comes up, uses the consequent encouragement upper half. If it's bullish, it'll do those types of things. And it rallies up, goes into an octant. Try to rally here, fails, goes lower. Trades down into 8:30. Meander around, we rally up into Asia. We fall short of hitting this octant.
We trade softer. And we get in here and we need to use the new week opening gap. Sells off. Comes down, clears out sell side, pulls right back up into new week opening gap. And notice it's around the quadrant level of that buy side imbalance sell side efficiency on the daily chart that we graded out. That's what these horizontal lines are. Okay? Watch how price gravitates to them. Spend a little time here, meandering around.
And finally, as we enter Europe, Let's see if we're doing them, by the way. The uh we drop down, aggressively trade to consequent encouragement, which is midpoint of that daily buy side imbalance sell side efficiency. Volume imbalance trades to it there. Finally down to a lower octant, the one immediately beneath consequent encouragement. And we come right back up to consequent encouragement. Look at this swing here, beautiful.
They're right back up to consequent encouragement, then we get above it. And now we're coming back down into it. Here. Consolidating here. Look what it leaves. Look at that. So, this already looks too suspect, okay? They spent a whole lot of time gyrating around here. This is likely to get taken. So, we have buy side imbalance sell side inefficiency. Uh consequent encouragement right here, and then we're up in a premium with price relative to the midpoint of that buy side imbalance sell side inefficiency on the daily chart.
We have relative equal highs after staying inside this range. And the market trades lower. Comes right down into 7:00 in the morning is right there. Okay? So, 7:00 in the morning. Let's create that out. Sure, we have a little bit of a pop here, but that's just running liquidity. That's not a trend. Okay? There's a distinction here that you have to make that when we're looking for the range in between 7:00 9:00 What it did, yes.
For the first hour or so, it ran up. Half an hour or so, about 40 minutes. It ran up just to take the buy side out. So, that buy side's taken. And then what does it do? It pulls right down inside of the low and the high, and it starts gyrating around its middle. So, is that consolidation? Yes. This how can you going to call that trend? Okay, it's not being allowed to protract. So, it's consolidating. Okay? So, when we get into 9:00, we have several things in here with the bodies.
Forget the wicks. Forget all that. Look at the bodies. Okay, see that? So, in and of itself, where was it made jagged? Down here. So, where is it smooth? Where the bodies are right here. See that? Now, this big wick here, you got to you got to forget that because that's where the damage is allowed to be done. So, it's the bodies in here. So, we're going to anticipate a rally. Approach 9:30, we rip higher. Clear those bodies.
Disregarding the wicks cuz we're already above consequent encroachment of that wick. So, it's no longer a factor. Okay, normally if we were bearish, we want to see it stay in the lower half of it. But we can't use that here because we have reason to believe it may go above these bodies. Cuz when we have a a a group of candlesticks like this, we want to look at where the liquidity is. And this is the extreme. Now, granted, it does get a little bit of of movement beyond that.
I'm I'm not looking at that. I'm looking at the bodies here. So, the higher one here is the buy side liquidity at the first few minutes of the opening range may flutter and run above. It does that. And then right at 9:30 >> [laughter] >> it took off and it gave me no chance, literally no chance to get in this. And I was sitting with Caleb this morning. I was like, "Look, you know, they're going to take the sell side here.
They're going to take the sell side here. And then the volume imbalance down at the low of the daily buy side imbalance sell side efficiency which is in here. This level and and somewhere abouts in here, okay? And we just immediately out the gate just fell like a elevator. Just fell right out of the open. And didn't give me a chance to get short. It just moved too far. And I just watched that. I told my son, I said, "Look, you know, we'd like to see this become an order block.
And I'm going to take the 7:00 gradient levels off now. So now we're simply just back to buy side imbalance sell side efficiency grading levels on the daily chart. That's what these vertical I'm sorry, these horizontal lines are. So as market breaks down aggressively, missed any opportunity to get in here, moved too fast, too far. Uh I just said, "Look, Caleb, let's just watch this." And there was really no participation on our part.
Open here is changed state to lower it. Changed trades up into it. Notice this order block, okay? Is anchored and tethered to an octant. So that means this order block is a valid order block if you know where the market is likely to go. So I had a little bit lower target. And I'll I'll go back up to the daily chart before I close and let let you see it cuz I I I wasn't thinking ahead before I did this uh recording. to tell you where they are, but I'll show you.
So, this is bearish order block and trades up into it here and then gives up the ghost, trades lower. Trades down into the octant right below the quadrant level. Starts to consolidate in here. And it gives us a silver bullet. Where are we at with this uh rectangle here? So, we're going to look at 10:00. Okay, we'll go we'll go to 10:30 just for the sake of marking out enough time. Take this off. And that off. All right.
So, we're going to be hunting silver bullet at 10:00. And at 10:00, the first presented fair value gap is a sibi. While the market is not allowed to go lower. Okay? We already used it here to try to sell off, but we came back above it here. This Let me highlight it. This video is already becoming much longer than I wanted it to be. So, we have a bullish inversion fair value gap. There. So, we tried to go lower off of using this as a bearish fair value gap.
It started to go lower, took out that swing low, took out the bodies. See that? Look at the body right here. And then look at that. Lower. So, that's a run below, even though it didn't take out that wick. Why? Because the wick is allowed to do the damage. The narrative all of the real volume that is useful information you can see it all in the candlestick. No gimmicks required. See that? Rallies up. Bounces back down in.
Bullish fair value gap. Look for it to trade up into this high because we have the low of this sibi right here. So it draw up into that. Right there. So market rallies up. Why again why is this a fair value gap this that's valid? Because this candlestick is candlestick three. Candlestick two, candlestick one. Candlestick three is tethered to that octant. That validates this as a fair value gap. It's useful. Okay? We use it here.
It rallies up. Starts consolidate trades back down into the quadrant 0.75. Accumulates. Goes higher. Trades up into another octant consolidates. Trades into the order block open of this candlestick has changed its state delivery. Rallies up hits the low of that sibi. And then we would want to see it draw up into this small little gap right there. That's the smallest little gap right before we get this run up higher and drops.
So if we highlight that These are the things you're supposed to be doing with your charts. Not just simply taking mine saying, "Nah, I I agree with that. If you're If you're doing that, you're not doing what's required for you to learn how to build on your own. Okay. So, that's that's the draw up here. And then we have the market trade around this level here, which is the low of the SIBY. This is the SIBY over here. Sell side imbalance, buy side inefficiency.
We don't need to extend that over cuz there's going to be too many things on the chart. And we'll just There you go. Market accumulates here. And it pops up and hits that little gap. Meanders around, hits the It's that the upper quadrant. Now, it's the uh It's not going to correct you. Now, the BIZY on the daily chart. And trades up into it once more here. Look how much it sells off there. Trades higher, breaks lower, trades lower in here.
Then, as we close the day out, it got a little bit sloppy. So, I'm tempted to see where we're going to open up at. So, I'm going to hang out with you for a couple more minutes to get to the 6:00 restart. Uh we have Jackson Hole Symposium uh Thursday at the I think it's Thursday, day one. If it's not Thursday, it's Friday. One of the two. Check your economic calendar. Don't hold me to my word on that because I might be wrong.
I don't I don't trust it. But, I think it's Thursday, day one is Jackson Hole Symposium. Uh the week that that comes out, it's >> [sighs and gasps] >> it can create little wonky things in the marketplace. Um you're just going to have to trade through it, I guess. You know, that it's not like a FOMC or CPI or PPI type thing. Just expect some weird things to happen sometimes, you know, and don't over leverage this week.
But all know the idea of the market consolidating between 7 and 9. That's the rules, buddy. And then if it's going to go down, let me go into that uh daily chart real quick. I'm going to highlight volume imbalance levels. And you'll see where I got it wrong. So, I missed the opportunity to get in on a move I thought was going to come. Even told you about it in the Twitter space this weekend. And I wanted to see a trade down into this volume imbalance.
Right here. So, I was looking for that. I think it's on the biggest Yeah, it's widest. I wish you could make it a little bit wider than that. I would like to have certain little levels like really be bolder and I mean at least twice as bold as these are. But yeah. Can't have everything, right? So, I wanted to be short. And I wanted to take this very gap right here that I just highlighted a moments ago. I wanted this to become an inversion fair value gap.
Okay, so I wanted to see it act as this. Okay, where it was bullish here, if it comes back down and an order flow was bullish and we were expecting higher prices, trading here and going higher would be reasonable. But because I'm thinking it's going to go down to the volume imbalance. And this is what I was telling my son. I said we're going to go down and hit the high of that and maybe go to consequent encouragement or maybe failed to get the consequent consequent encouragement.
Uh either way, you can see it I was wrong there. It never got there. So, my son got to watch his dad not do too well with the NQ today. But I wanted to see it trade below that and come back up and use it as an inversion fair value gap. I would have sold short six contracts there and broke lower and then anything in here that would have created another PD array. You know, it just moved too quickly for me. And this was the first up close candle.
So, they had the order block there and you saw me mark march through all the rest of that stuff. So, we have just a a a second or two. We're going to see where we open up at. Okay, we just opened. We have new day opening gap right here. So, we'll mark that out. All righty, let's go with um deeper purple. What's with you and this purple all the time, ICT? >> [gasps] >> Purple rain. All right, let's see. We'll scale it down to like 20% opacity.
And we'll bring that one down to There you are. All right, so we have the new day opening gap. And looking at this this looks a little too clean. It just jumped off the chart at me. So it might want to come up here and bump that. But um we're going to see if it wants to continue lower. I suspect it'll probably want to go down to that volume imbalance that it couldn't get to in regular trading hours. So just have this level here highlighted.
And then that's the low of the the buy side imbalance sell side inefficiency. If we get below that and start to really accelerate, then things could get really exciting. But uh that's going to be it for today. Hopefully you weren't hurt today. Uh hopefully you were inspired by seeing the rules I gave you. Th- There's an algorithm, folks. Okay? I can't take you to where it's at. Okay? I can't physically place it in your hands and say here's study this and look at the source code of it all.
I can't do that. But what I can tell you is is look at certain things that are absolutely not part of any other discipline out there. Okay? You know you you see these guys making videos, you see them making posts and whatnot saying I rebranded and renamed things that's always been there. Nobody's ever talked about seven and nine and used the information of whether it's consolidating or if it's trending tells you how the morning session's going to move.
I told you this weekend we were going to trade down in the lower ends of that buy side imbalance sell side inefficiency because we're entering into that seasonal tendency where it's likely to pull prices lower. Okay? And when we're consolidating, what does that mean? Two pieces of the puzzle are right there for you. We're going to see big movement one directional at 9:30. Which direction? I told you the direction over the weekend in my space on Saturday.
Go and listen to it. It's not that long. It's actually a really good space, but you know, we probably hindsight cherry-picked that stuff, too, didn't I? But, I missed it today. I did. I know some of you guys like to you post stuff, man. This guy never misses. I wanted to get short there, but it just simply just tore off way too fast. Left me standing there at the bus stop, and I just just couldn't catch it. Couldn't catch it at all, and I just tape read with uh tape read, rather, with Caleb and with the slots that drip down here.
And the target I aimed for, it didn't go to that. So, part of me is a little bit happy cuz I didn't get in. I would have been stopped out in here somewhere, most likely right there. But, uh I think I earned the right to talk a little bit in hindsight. >> [laughter] >> Uh so, hopefully, if this video doesn't take too long to get compressed and sent out there on the airwaves, I just watch and see how we get these highs.
Okay, if we get up here. If we get them and we start to really break down lower, just look for that uh volume imbalance that we traded to at the lower end of the daily buy-side imbalance outside of efficiency. And again, that's this bit of business right here. Okay? Until I talk to you next time, I'm going to be very uh low output this week. Um we're planning some some get-togethers. So, my wife is requiring my input on that and shopping and it's just a bunch of stuff.
And holidays are coming up. So, there's that. It'll probably just be uploads on YouTube, one or two posts on X, and that's going to be probably the the extent of it for this week. So, it'll be a slower pace. Then, catch up to everything I've put out, the real important stuff the last couple weeks, the last couple months, really. And until I talk to you next time, Lord willing, be safe.
The words are the caption track's own and nothing is reworded or re-transcribed. Paragraph breaks are placed between sentences so the text reads as prose.
Free tools for your own script: paste a draft and see where it stands before you record it.
Paste your draft and see where viewers are likely to drop off, with a rewrite for each weak line.
Paste the first 30 seconds of your own draft for a hook score and rewrites.
Check your draft against YouTube's advertiser-friendly guidelines before you record it.
Read this channel's public videos and transcripts, and download a writing brief for it.