Getting the transcript
Reading the captions from YouTube. A video nobody has opened here before takes 10 to 30 seconds; this page fills in on its own.
Getting the transcript
Reading the captions from YouTube. A video nobody has opened here before takes 10 to 30 seconds; this page fills in on its own.
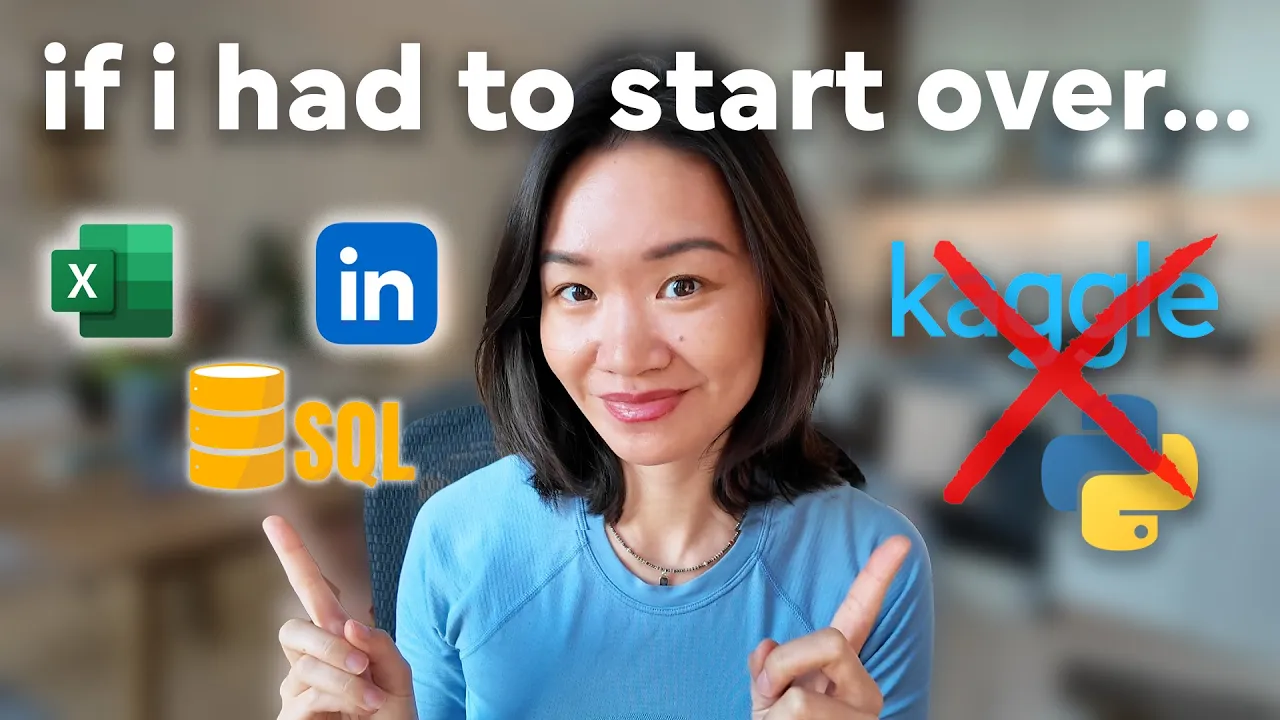
Christine Jiang · @christinejiangdata
Where viewers went back to watch this video again, from YouTube's public Most replayed graph, lined up with what was said at that moment.
Most replayed moment #1
4:143.4x the video's typical replay level
So with these visualization softwares, it's important to, of course, be able to create visualizations and dashboards and be able to work with parameters and calculated fields. And just to answer a question that I'm sure I'm going to get about Python, the reason why Python isn't on this list is because even for
Said at 4:07
Most replayed moment #2
6:523.3x the video's typical replay level
And how do I actually go about building this kind of showing project? That is exactly why I made the portfolio playbook series for you guys. So check that out here. It gives you a dataset that you can actually download and it walks you through step-by-step how to go from the raw messy data to that final write-up.
Said at 6:44
Most replayed moment #3
6:343.2x the video's typical replay level
product that you build with a real stakeholder with real data sets and that's where i recommend and thinking about volunteering, doing contract work, or doing freelance work by checking out any of these platforms down below. And you might be thinking, okay, Christine, this all sounds great, but where the heck do I
Said at 6:28
The graph counts replays. It does not show where viewers stopped watching.
Words
3,121
Runtime
14:36
Speaking pace
214wpm
Reading time
13min
214 words per minute, above the 201 75th percentile of 349 measured videos. That distribution comes from the 349-video hook study.
Opening (first 30 seconds)
So most how to become a data analyst videos are talking about the same things. Learn Excel, learn SQL, learn Tableau, build some portfolio projects, build a resume, start applying, and then hope for the best. Honestly, that used to work, but after mentoring hundreds of aspiring data analysts over the last few years, I see that there are four differentiating factors that are going to stand out in 2026 and in the age of AI that most tutorials are not talking about. So in today's video, I'm going to talk about what those differentiating factors are, and And then I'm going to walk you through the
107 words, the words spoken in the first 30 seconds at 214 words per minute.
Free, no signup. See how the first 30 seconds hold attention, with rewrites.
Sentence shape
| Measure | This transcript |
|---|---|
| Sentences | 131 |
| Average words per sentence | 23.8 |
| Longest sentence | 229 words |
| Questions asked | 8 |
| Sentences containing a number | 9 |
Most used terms
Filler phrases
46 in total: actually 27 · like 13 · kind of 3 · literally 2 · you know 1.
A literal whole-word count of the same phrase list the Prepublish browser extension uses, so a phrase inside another word is not counted and a phrase used in its ordinary sense still is. It is a count and not a judgement.
Free, no account. See where attention is likely to drop, with a rewrite for each weak line. The free check shows the scores and the one issue costing the most. Or run it on the words above first.
Free · No login · See a sample audit first if you prefer.
What this transcript is
Every word below is the caption track YouTube publishes for this video, pulled from the video itself and reproduced unchanged. It is not Prepublish's writing, not a summary, and not a re-transcription: it is the video's own published captions. English captions, published by the channel, in the video’s original language. Source: the video on YouTube. A channel that would rather this page did not exist can ask for its removal through the contact page, and it is removed.
So most how to become a data analyst videos are talking about the same things. Learn Excel, learn SQL, learn Tableau, build some portfolio projects, build a resume, start applying, and then hope for the best. Honestly, that used to work, but after mentoring hundreds of aspiring data analysts over the last few years, I see that there are four differentiating factors that are going to stand out in 2026 and in the age of AI that most tutorials are not talking about.
So in today's video, I'm going to talk about what those differentiating factors are, and And then I'm going to walk you through the end-to-end roadmap that has helped my students land their first data jobs at companies like Uber, Peloton, Grubhub, often with a 30% plus salary increase and with far fewer applications than you'd expect. If you're near here, I'm Christine. I'm a former data director and a hiring manager who now helps people take the most direct path to working a job in data.
And on this channel, I share the strategic frameworks, analytical thinking, and business intuition that is going to help you stand out. If that sounds helpful to you, make sure to subscribe and let's dive in. First, it's crucial that you understand the four factors that are going to differentiate you in 2026. The first is domain knowledge. Now you don't have to be an industry expert, but any field where you have some previous experience, whether it's in sales, operations, marketing, business development, partnerships, accounting, finance, any area where you already have that background experience is going to make you instantly more valuable.
You already understand the metrics, the customers, the stakeholders, and the company dynamics. And these are things that a purely technical candidate cannot compete with. The second is understanding how you fit into the technical ecosystem. Now, data analysts do not operate in a vacuum. One of the teams that we partner the most closely with is the data engineering team. And so the more you can speak their language and you understand concepts like data warehousing, data infrastructure, data governance, and data architecture.
And if you have some conceptual understanding of tools like DBT, that is instantly going to make you sound more senior and more experienced. The third is having soft skills that actually matter. And here I'm not talking about the strong communications line that everyone puts on their resume. I'm talking about being able to actually demonstrate that you know how to bring the numbers to life when it comes to interviews, when it comes to your project write-ups and your portfolios, and when it comes to doing a presentation in that final interview round.
This is where you prove that you can verbally connect the dots and tie all of your insights back to the actual business. Lastly, is having a strong reason why. Now, I really cannot overemphasize this. I've seen over and over again the difference between the people who actually break into data versus those who get stuck or burn out before they get there. That difference isn't in their technical skill. It's in their ability to stay consistent long enough.
This requires having a clear reason why you're doing this, whether that's wanting to be able to financially support your family or maybe it's wanting to have location freedom that you can travel the world while working remotely or maybe it's having a career that finally suits you make sure that you have a clear purpose for why you want to become a data analyst now let's dive into a roadmap that hits on all four of these factors and if you want to download of this roadmap in a cheat sheet then check out my newsletter below it links to all the platforms that i mentioned as well as features a mini curriculum from my own youtube videos so that you don't have to guess what step to take next so let's start with the obvious the technical skills Yes, you do need a strong technical foundation, but most people overestimate how much this actually is.
One of the biggest mistakes I see of self-taught data analysts is in watching hours of online tutorials and then thinking, I'm just going to watch one more tutorial before I actually get started. So here's the most lean tech stack that I recommend along with the concepts that you should focus on. So with Excel, you should know pivot tables, conditional formatting. You should be able to make graphs and you should also understand aggregation functions and lookup functions.
Then with SQL, you should be able to write queries with multiple joins, CTEs, subqueries, window functions. You don't have to be completely fluent at these functions, but you should be good enough to be able to Google your way through a few queries. And you can always practice this and get better at it as you're applying to jobs. And then with visualization. So in this case, let's say Tableau, though you could also do Power BI or Looker, but any one of these should be fine.
And you can always transfer some of your learnings from one tool to the next. So with these visualization softwares, it's important to, of course, be able to create visualizations and dashboards and be able to work with parameters and calculated fields. And just to answer a question that I'm sure I'm going to get about Python, the reason why Python isn't on this list is because even for mid-career data analyst positions, even if it says Python on the job description, most of the time you're not going to be tested on Python in the interview process.
And we still seldom use it on the job, mostly because data analysts work very closely with business stakeholders and stakeholders can't understand python code or output i would actually recommend focusing on tools that help you stand out even more like dbt which is on the data engineering side or google analytics which is more on the marketing side or even understand the concept of a b testing for marketing data analyst roles having a basic understanding of these tools and how they fit into the day-to-day of the data analyst can give you much more of a leg up than python can you don't have to be a data wizard who is fluent in these tools but you have to be comfortable enough to start working on some projects and And that's when it's time to start moving from learning to applying.
So when it comes to projects, I recommend you think of two different categories. There are the learning projects, and those are really low-pressure projects that are geared towards using one tool at a time. You're using clean Kaggle datasets, and you're really just practicing Excel, SQL, or visualization using that dataset to just get a little bit more familiar with that tool. And then the next bucket are projects that I call showing projects.
And these are projects where start to feel a little bit more real you're answering actual business questions you should be using really messy data you should be using the tools so excel sql tableau together as a system using data best practices and also demonstrating your storytelling skills your communication skills through the actual write-up maybe you'll even record a loom of yourself walking through the actual insights so that people can come to your portfolio and see your communication skills and it can be very helpful if you work on a project that relates to an industry that you already have experience and if you're planning on applying to data analyst roles in that field some really approachable ideas to start with are analyzing airbnb data in your state and looking at trends and seasonality or maybe conducting some sales analysis on shopify data whether that's a shopify data set that you find online or maybe you approach a local small business to see if you can work with them on more of a volunteer basis now one of the best kind of showing projects you can build is a product that you build with a real stakeholder with real data sets and that's where i recommend and thinking about volunteering, doing contract work, or doing freelance work by checking out any of these platforms down below.
And you might be thinking, okay, Christine, this all sounds great, but where the heck do I actually find this data? And how do I actually go about building this kind of showing project? That is exactly why I made the portfolio playbook series for you guys. So check that out here. It gives you a dataset that you can actually download and it walks you through step-by-step how to go from the raw messy data to that final write-up.
So let's say you've been focusing on this a few hours a day or a few hours a week. And in months one to two, you've built the technical foundations. Months two to three, you're working on those projects, maybe even finding a volunteering experience to exercise your data skills in a more real world environment. Then months four and up is when you start job hunting. Now, having the right job hunt strategy is honestly half the battle.
You might have all the right intentions, you might've put in all of the work and done all the portfolio projects, but if you don't have the right job hunt strategy, all of that energy is going to be for nothing. So instead of cold applying to a hundred generic data endless jobs with a generic data endless resume and then hoping that a recruiter feels adventurous, here's what actually works. The first is to craft your story.
Think about it from a recruiter's perspective. If you have a generic resume that signals, I'm open to literally any kind of data job, it sends the signal to the recruiter that you're really unfocused and that you don't actually understand what that specific job is about. Instead, you wanna choose one or two jobs and tailor your entire story towards that narrative. This is gonna make you seem way more intentional and aligned, especially if your past experience connects to the jobs that you're applying to now.
So if you have a background in consulting, marketing, operations, sales, finance, e-commerce, or any other industry like healthcare or supply chain, you should actually use it. Ideally, you would apply to a flavor of a data in this role that uses that background. For example, operations analyst or marketing analyst or e-commerce insights and reporting analyst. You don't wanna throw this experience away because it's actually your competitive advantage.
If you're interested in understanding how you can translate your past experience to the data job market, then sign up for my newsletter below. The second step is to interview early and often. Now, this is actually so important. The goal of the first 50 applications that you send out is not to get interviews at your dream role. It's actually to get as many interviews as you can. Now, the reason is because you need to get those practice reps in. no one really steps into their first interview with the perfect answers and perfectly calm nerves.
You actually need to do a few maybe not so perfectly to get to the point that you feel really confident. So here, make sure to be applying to jobs where you satisfy at least 70% of the requirements and lean into networking messages to make sure that your resume is getting pulled to the top of the stack where you actually stand out for those roles. Now, one of my students is actually a perfect example of this. He interviewed with a bunch of different companies and he eventually interviewed for a role that was looking for three to five years of data analyst experience, even though he actually only had two to three years of experience in consulting.
But because he had done so many interviews and looked at each one of those as a learning process and he used it to refine his responses and learn more about what he needed to know about the industry, he literally leveled up in real time as each interview made him better and he landed that dream position at L'Oreal. Now, if within the first 50 applications, you're not getting any interviews, then that is actually feedback.
It means that something isn't right with your resume or the jobs that you're applying to are not the right fit for you, or that you need to lean more heavily into networking or meeting people in real life to get those conversations going. So approach this process like an analyst and refine and iterate on that process. Now, here's one of the things that have changed the most over the last few years, and that is that focusing on relationships instead of cold applying is going to win almost every single time.
A 12-minute conversation with someone who uses data your target domain area is going to give you way more insight and lead you to possibly more opportunities than just cold applying to 10 different jobs. These don't have to be really formal, cringy, palm sweaty networking events. They can just be casual, real conversations with people, whether those are data analysts in the industry that you're excited to apply to, or they're just people in your secondary network and friends of friends who maybe have some exposure to data.
This is where I recommend sending two or three thoughtful networking messages a week just to ask for a 15 to 20 minute chat to learn more about that person's journey and their industry. So just remember that a focused story, a domain relevant project, and a warm introduction is going to be cold applying every single time. Over the last year, I've seen how much more job hunting has become a social game. And so think of LinkedIn as a way to increase your surface area for recruiters and hiring managers to discover you.
Your LinkedIn should act more like a general resume where the job titles don't have to match exactly the names of the job titles that you put in your resume, But it should show a similar story where every single job is geared towards a data narrative and you don't include any positions that are highly unrelated to data analytics or weren't done in a corporate environment. Some of these simple updates can yield a pretty surprising change in the number of recruiters who reach out to you.
So use LinkedIn as a way for people to find you instead of waiting for your resume to get to the top of the stack. Now, when it comes to interviews, there are four key aspects that you're being tested on. The first is technical skills. The second is the ability to generate insights from the actual data. The third is having stakeholder communication. And the fourth is having professional polish and what people might call culture fit.
And my biggest piece of advice here is to not try to practice everything all at once. That's how you're going to get completely overwhelmed. Instead, think of it like a video game where you need to level up in every single round. So for the H.R. screen, first, you're going to practice your behavioral questions and explaining more about your background. Then when it comes to live case studies and take homes, that's where you want to brush up on your technical skills.
And when it comes to the insights and analysis, that's where you want to actually practice speaking your thought process out loud. Lastly, when it comes to presentation and communication, you should be practicing through mock interviews or maybe even recording yourself on Zoom by seeing how you come across on camera. And just remember that every interview is a learning experience that you're then going to take to the next interview to do even better.
So always reflect after an interview and ask yourself, what questions did I get stumped on and how would I do better? Write those answers down so that every interview you get stronger and stronger. Here are some of my other tips. One, every job description has a lot of different requirements on it, but most jobs can be distilled down into three core principles. I would actually read that job description and ask yourself, what are the three main areas that this job description or hiring manager seems to care the most about?
And make sure that all your interview responses relate back to those bullets. Chachibuti is really helpful for interview response practice. but you wanna feed into it the questions that you think that you'll get asked and also share your actual response and ask it for feedback. Now, one of the biggest ways that you can actually stand out is in the questions that you ask towards the end of the interview. Most people will ask really generic questions like what's the day-to-day of a data analyst on your team or what does success look like in the first 90 days?
Instead, you wanna ask questions that actually show your strategic thinking and your professional maturity. Things like what are current challenges of the team and how would a new data analyst actually help fill this gap? For my understanding of the main metrics that the leadership team cares about at this company are metrics like blank, blank, and blank. Are there any other kinds of metrics that your team prioritizes?
Or even a question like, what does your top data analysts do that other analysts don't? These questions signal that you're not just here to take instructions. You can actually help a team run things better. Companies are no longer hiring the most technical candidates. They care much more about clear communication, business intuition, and logical structured answers that show the way that you actually think. If you want to accelerate your entire process throughout this entire roadmap and shorten the process from six months to even less, then check out the link below for more details on my mentorship program.
I'm going to be opening up the next cohort in just a few weeks. And if you want the expanded roadmap with links to all the platforms and notes on the timelines and the concepts, then check out my link below. That's it for this one. I hope you enjoyed and I'll see you in the next one.
The words are the caption track's own and nothing is reworded or re-transcribed. Paragraph breaks are placed between sentences so the text reads as prose.
Free tools for your own script: paste a draft and see where it stands before you record it.
Paste your draft and see where viewers are likely to drop off, with a rewrite for each weak line.
Paste the first 30 seconds of your own draft for a hook score and rewrites.
Check your draft against YouTube's advertiser-friendly guidelines before you record it.
Read this channel's public videos and transcripts, and download a writing brief for it.