Getting the transcript
Reading the captions from YouTube. A video nobody has opened here before takes 10 to 30 seconds; this page fills in on its own.
Getting the transcript
Reading the captions from YouTube. A video nobody has opened here before takes 10 to 30 seconds; this page fills in on its own.
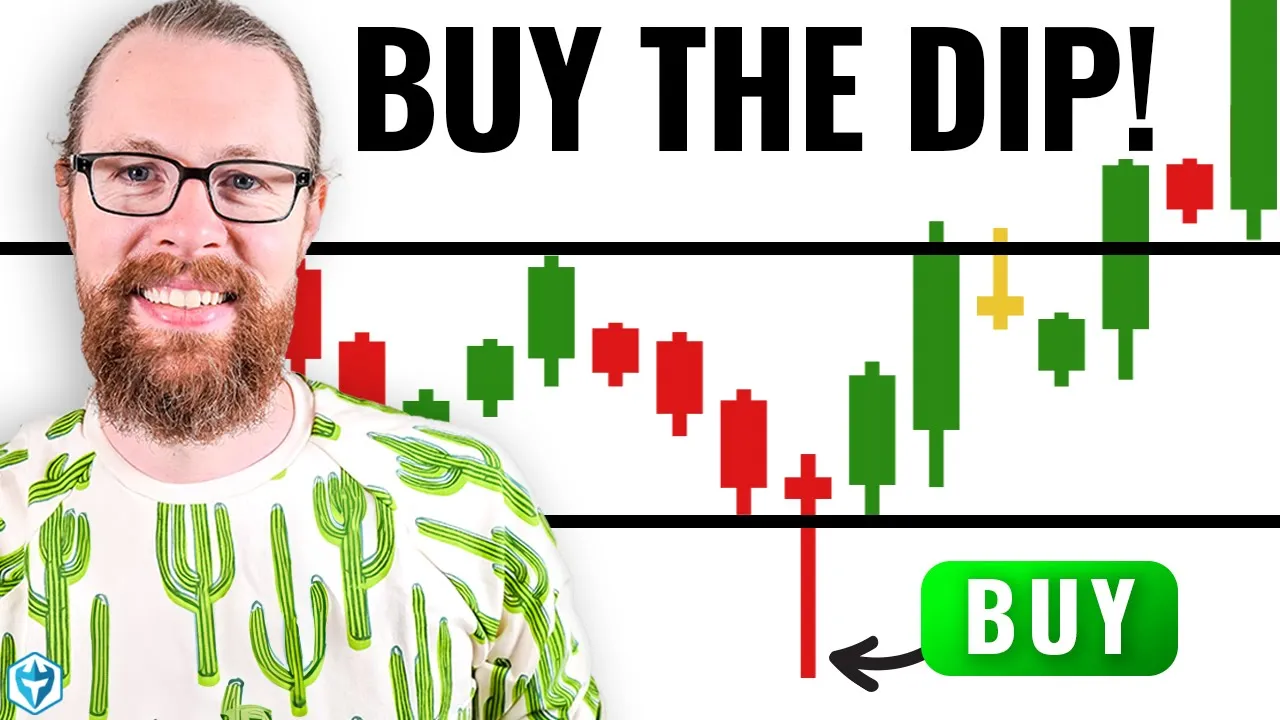
Ross Cameron - Warrior Trading · @DaytradeWarrior
Where viewers went back to watch this video again, from YouTube's public Most replayed graph, lined up with what was said at that moment.
Most replayed moment #1
16:063.8x the video's typical replay level
and then I've got twice as big of a position as if I had just bought at the breakout and then if it does break out and moves up here I'm going to make twice as much money and that's that's literally what I started doing so what happened in 2020 was we started seeing these really
Said at 15:58
Most replayed moment #2
5:433.4x the video's typical replay level
simplify it into a few steps that you can check and you can do that every time before you consider taking a dip trade so the first thing you're going to check is the volume profile and you're going to look for increasing volume that's step number one so that means we want to see the price moving higher and the
Said at 5:35
Most replayed moment #3
18:412.7x the video's typical replay level
other thing I check and that's the macd right here I check the moving average convergence Divergence indicator and I want to see number three that Mac D is open open is when uh the
Said at 18:34
The graph counts replays. It does not show where viewers stopped watching.
Words
9,964
Runtime
51:54
Speaking pace
192wpm
Reading time
42min
192 words per minute, between the 181 median and the 201 75th percentile of 349 measured videos. That distribution comes from the 349-video hook study.
Opening (first 30 seconds)
I spent the first eight near nearly 10 years of my career never buying dips or pullbacks but only doing breakout trades and the reason I did that was because for me breakout trades were pretty much an R instant resolution you get in they either break out immediately and you've got a winner or they don't and you stop out and for me that felt good and one of the challenges that I struggled with in a huge way was that whenever I tried to buy a dip or a pullback the price just seemed
96 words, the words spoken in the first 30 seconds at 192 words per minute.
Free, no signup. See how the first 30 seconds hold attention, with rewrites.
Sentence shape
| Measure | This transcript |
|---|---|
| Sentences | 3 |
| Average words per sentence | 3321.3 |
| Longest sentence | 7,533 words |
| Questions asked | 0 |
| Sentences containing a number | 3 |
Most used terms
Filler phrases
261 in total: like 76 · um 56 · you know 47 · uh 30 · kind of 21 · actually 11 · sort of 11 · I mean 4 · basically 4 · literally 1.
A literal whole-word count of the same phrase list the Prepublish browser extension uses, so a phrase inside another word is not counted and a phrase used in its ordinary sense still is. It is a count and not a judgement.
Free, no account. See where attention is likely to drop, with a rewrite for each weak line. The free check shows the scores and the one issue costing the most. Or run it on the words above first.
Free · No login · See a sample audit first if you prefer.
What this transcript is
Every word below is the caption track YouTube publishes for this video, pulled from the video itself and reproduced unchanged. It is not Prepublish's writing, not a summary, and not a re-transcription: it is the video's own published captions. English captions, generated automatically by YouTube, in the video’s original language. Source: the video on YouTube. A channel that would rather this page did not exist can ask for its removal through the contact page, and it is removed.
I spent the first eight near nearly 10 years of my career never buying dips or pullbacks but only doing breakout trades and the reason I did that was because for me breakout trades were pretty much an R instant resolution you get in they either break out immediately and you've got a winner or they don't and you stop out and for me that felt good and one of the challenges that I struggled with in a huge way was that whenever I tried to buy a dip or a pullback the price just seemed to go lower and I felt like I was just losing every time so I kind of just trained myself not to even do it at all and then in 2020 things changed something happened and I learned a little trick that helped me differentiate the difference between a dip where the price is going to go higher and a true reversal and since implementing that in my trading I've now been able to expand from Trading breakouts to trading really nice pullbacks and this has allowed me to sign significantly increase the amount of money I'm making if you can start implementing these steps in your own trading I think you'll also see a big Improvement so let's go ahead and jump onto the screen share I want to start by getting oriented with uh a chart here that um this is a Candlestick chart and on this particular uh day we had a news Catalyst that sent the price from about $89 a share here this is crazy all the way up to over $24 a share this is a huge move so naturally this is something where you could look at a lot of these dips and say yep I should have been buying these dips right it's easy to say that in hindsight but when we're sitting here and this is the information we have right let's just say we're sitting right here we're going just Candle by candle and we're thinking all right um you know price is moving higher now it's pulling back what do I do right and this is where a lot of us have paralysis we Panic we're like I don't know it's extended it it just went from $9 980 all the way up to 12 should I really I don't know should I should I buy this here should I buy this dip or is this just going to go lower and then you talk yourself out of it and next thing you know it's up at 13 you're like oh my gosh I just missed the whole move so how many of you can relate to that if you can relate to it you're not alone I did the same thing for a long time and look sometimes I'll even do the same thing today as a Trader we are ultimately trying to predict the future and the traders who do it the best will be the ones who make the most money so what we're doing is we're seeing only half the pattern right we see the beginning of the pattern and we're now trying to visualize how it's going to resolve is it going to resolve to the upside is it going to resolve to the downside okay so the first trick that I'm using to help me understand whether or not this is going to be something that does a complete reversal well sometimes call it a round trip or is something that's going to continue higher number one we're going to start making a list all right so um number one is I check the volume profile now as a beginner Trader you most likely have volume on your chart but it's it's very easy to kind of Overlook it and in fact some charts for whatever reason don't even differentiate the color of of the uh candle the color of the volume bar based on the color of the candle sometimes they'll just all be you know light blue or something like that so then you know you you're just you sort of see the volume like this just it's almost like an afterthought like oh yeah I guess we should throw volume on there and I'm not saying you did this but like the whoever made the charts for you the the provider using but they're not this doesn't give you what you need so so okay so let's go in here and change this back so falling is going to be red right growing is going to be green volume okay so this is the profile that I look at I always want to see the volume is increasing as the price is moving higher that's the first step so number one so we'll do a increasing volume so in contrast to increasing volume what we sometimes will see and this was from something I was working on yesterday for taxes that's another episode that you guys should check out those of you who have not seen it already so if we had a chart where where the price was moving up we'll make this candle just a little bit all right so the price is moving up here like this but the volume bar was steadily declining like that this for me um is a little bit of a red flag because I'm like on the one hand I'm like yes the price is moving up but on the other hand I'm like fewer and fewer and fewer people are interested in buying it why is that it shouldn't be like that in fact it should be the exact opposite where we see um lighter volume as it starts and volume increasing as it goes higher that's a really good volume profile so anytime we see a sort of Divergence between indicators where price is going up a volume's declining for instance or we have one of our other technical indicators like the macd the macd has gone against the trade but the price is still moving higher I consider those to be sort of like caution flags and it's really important to be able to be aware of them but it's difficult for a lot of Traders especially beginner traders to keep track of all these things so the goal here is that we can simplify it into a few steps that you can check and you can do that every time before you consider taking a dip trade so the first thing you're going to check is the volume profile and you're going to look for increasing volume that's step number one so that means we want to see the price moving higher and the volume bars also moving higher so these should be correlating they should be basically doing the same thing and if we look at our chart here on on rent we see that's exactly what happened the price uh moved higher and the volume moved higher as well okay so this is this is great this is what we like to see now when we start to get the pullback uh as this candle is forming I am watching the volume very closely what I do not want to see is a high volume selling candle so if this candle for instance was red all the way up to here that would tell a very dramatically different story to me what that would be telling me is that there was light volume on the move up and then when selling came in there were not only buyers who were dumping their shares there were probably people shorting or maybe insiders selling as well in any case what it very clearly communicates is an imbalance between supply and demand that's stronger to the cell side so what you have right here are four candles of green volume accumulation and now you have a light volume selling candle so if you just looked at this volume profile if if this was all that you had to look at just for instance I think I I hope that you would be able to see that the the imbalance is stronger to the buy side in fact if you only looked at this volume profile and not the chart let's see what we might um think is happening so we have a little bit of selling and then look at that it I mean I know you've already seen the chart so you could probably visualize fairly easily what happened but look at this volume right right this is telling us a huge Story look at the peaking volume right there 850,000 shares just in that one volume just in that one bar right now this is interesting if we're really analyzing the volume I would say based on volume profile alone we've got the nice move up light volume pullback starting to move higher this is where you sort of get that next wave up right most likely then you get a little bit of a pullback a little bit maybe a chop right in here a little pullback but the selling volume is still very light on these red candles and then it surges back up right now it's possible that we could look at the chart and see that it was sideways right here and if we saw that just for instance then that would again be where we have a bit of a Divergence and what that would communicate to us is that although there's a lot of buyers the price is not moving substantially higher which means there may be what we call Hidden sellers a hidden seller is an iceberg order and what it looks like when you're actually in a trade is you'll be looking at the level two so you've got the bid you've got the ask right here let's say it's 9 915 by 925 and on the time and sales window here you're going to see tons of orders going through in green and you'll see maybe like a 5,000 share seller here at 925 and you'll see orders going through here for 5,000 Shar 10,000 shares huge orders going through but this is not changing what that tells us is that that order right there they're displaying 5,000 shares but it's an iceberg which means behind that who knows they may have you know 100,000 shares that they're selling and this is something that uh big Traders especially at um proprietary trading firms prop firms and also um Professional Day Traders even Traders like myself um who are using the right soft Ware we can choose to uh use Iceberg orders this is allowed because um in the market if you show your full size and you tip your hat to the market that you're trying to sell 100,000 shares for instance uh it it could hurt you it would hurt your own position so you're allowed to protect yourself from other Traders sort of seeing how much you're selling by hiding some of your shares now you can't do that with Robin Hood you can't do that with thinker swim or Weeble you you can really only do it with Brokers that are designed for professional Traders traders who trade with you know multi-million dollar positions so anyways um so so so there's a possibility that the price could stall out here in terms of upward movement and that would be indicative of a hidden seller but let's just assume here that the price went higher then we get a little pull back on light volume selling a little more pull a couple green candles but lighter volume and this is where I would say we're beginning to to see a little bit of a shift between supply and demand where we're seeing more selling now if we step back for a moment and think kind of high level about what's going on on this chart and this is like getting into sort of the psychology and the Dynamics of what moves the market you have typically a catalyst you know there's some type of news that has brought Traders onto this chart and it doesn't matter if it's a futures um you know if it's commodity if it's a Forex pair if it's a cryptocurrency or if it's a you know us Equity stock or a stock anywhere in the world there's some type of catalyst that's gotten people interested and initially they start buying and that's where that early green volume comes from those first traders who are looking at this who are like I like this and then after that first wave of buying some of those early buyers decide to take little profit some people who maybe have been holding for a while decide to take a little profit some short sellers decide to take some positions and now the question is does all of that selling exceed the amount of buying that we had because if it does the price is going to swing way back down and you'll have what we sometimes call a round trip where the price could go up and then come all the way back down but if the price doesn't go all the way back down then what it tells us is in that moment in time there were more buyers than there were Sellers and the supply demand and balance is to the buy side and then what happens is other Traders will see this um whatever it is stock commodity Forex pair cryptocurrency they'll see it and they'll realize wow this thing is moving up and it's holding up so now what you have um essentially and I I kind of call this um a a wave you have this wave higher a little pullback and then that sets up for the next wave up right so now you have the profit taking the little bit of pullback down here these would be red candles a little profit taking and now it balances the supply demand and balance as of right here is still obviously positive because we went from a low price to this high price and now we're coming in where the next round of Traders are like I'm going to buy this buy this short sellers may stop out realizing this thing is strong and all of a sudden you get this next leg higher and that's what usually is correlated with higher increasing volume that increasing volume is because of early shorts who stop out they buy to cover and long buas traders who jump into establish new positions on something that is strong so we're typically we being long biased traders who are trading this type of trend we're buying these pullbacks now when I first got started I wasn't buying down here what I was doing was I was just buying basically the breakout right here so I was buying the high a day break as soon as something broke High a day I would get in right here and you know what that was fine for a long time and it's still a fine strategy today because it's instant resolution you can get in you can get out you pretty much get the breakout immediately but there is a little bit of a challenge with it and the challenge is that you're getting in a little high right relative to someone who maybe bought down here like I might today you might even be buying their shares right if you got in low enough you could be taking profit here now if it goes a lot higher you might feel silly for selling but nonetheless buying up here is not your best entry I would say that this is an entry that has confirmation and when you ask for confirmation you pay a price confirmation is the stock or the chart is making a new high but you pay a price by getting in at the higher price so when you get in down here you don't yet have confirmation that it is going to make new highs you think that the way is starting to curl back up you think the dip is going to move higher you've done your volume profile which was step one you checked to make sure that we had increasing volume and um number two you made sure there was um no um high volume selling so this was increasing volume as it was ramping up and then no high volume selling um on the pullback right so you made sure there's no high volume selling here in increasing volume on the move up so check check volume profile you like now there's another step that we're going to go over in just a moment uh but you say okay I'm going to get in here you don't quite have the confirmation right so it's a little bit of a higher risk position but that's offset by the fact that your max loss is the low of the pullback so if you get in right here where would you logically stop you wouldn't hold it if it goes all the way down to here no way why would you do that you sell at the low of the pull back because if it can't hold those lows you get out so rather than buying something as it's actively dipping right down here I'm waiting for these first early signs of the wave kind of shifting from pulling back to moving back in I'll show you what those look like in just a moment so when we get that that's where I'm getting in stop is right down here and as it comes up to this level I could choose to add to my position which will give me a cost basis right around here and then I've got twice as big of a position as if I had just bought at the breakout and then if it does break out and moves up here I'm going to make twice as much money and that's that's literally what I started doing so what happened in 2020 was we started seeing these really dramatic Moves In in price and we kept seeing I think it was just the exuberance that there was in the market we would see these huge moves to the upside and then we would see dramatic pullbacks and then it would rally all the way back up and because these moves were so elongated because they were so stretched out it felt like you know you got this move up the pullback and then to get in at the very top back up here for the breakout I mean you were getting in like $2 a share higher it just felt like you were in way too high and so I started as I would see it beginning to make this curl right down here that's where I was like okay boom I'm getting in and and and then I started to figure out okay some of these are not working and what is it that's the issue and so the first step of course is analyzing that volume profile okay so step one analyze the volume profile now let's back out of this for a second uh oh let's see we'll go like this we'll go back to full screen sorry all right so so now we're dialed in here so we had our um first few green candles right here right here two volume two candles of light volume selling okay and then what happens is we come down to the support of what you see in this case is our nine exponential moving average so I always want to see price at or above we'll put it on the Whiteboard the 9 EMA and this is on the one minute chart one minute time frame so price should be at or above the 9 EMA if the price breaks below the 90 ma then this to me is a more sustained pullback and I don't like it now it's not impossible for the price to dip below it just for a second and come back up that'll happen sometimes if a big seller just presses a sell button you get a little flush but if it just sustains that and keeps going lower that's no good so generally I want to see it holding right around the nine moving average right here and we got that and my cue to enter I'm looking here one two three four green candles in a row two light volume red candles first candle's green okay now there's one other thing I check and that's the macd right here I check the moving average convergence Divergence indicator and I want to see number three that Mac D is open open is when uh the average is above the signal line so you have the moving average um line right here and then you have the signal line and you want to see this is above the signal line and when it crosses below it then that's usually when we're coming into a period of consolidation this has been a real uh game Cher for me especially trading through the bare Market of 2022 and 2023 to help me stay out of um trades that most likely we're going to fail so anyway so we have this pullback here right here macd is open we're above the 90 ma right at it that's fine volume profile checks out this is a place where I'd be buying the dip and so what I would look for on the level two before I take the trade I'm just G to use my hand here whatever so I would look for the price moving up like this then we get the sell off one two let's just say three candles doesn't matter and then what I'm looking for we've got our 9 EMA right got that our macd checks out I'm looking on the level two the level two window we've got the bid we've got the ask and we've got the time and sales I always have my time and sales right next to it so I could see these orders and what I'm looking for right here again let's just say 915 by 925 I want to see we've come down we've sold off and I'm looking for green on the tape I want to see all of a sudden a burst of volume that's to the buy side those transactions are going to be green because they're occurring at the ask price which means people are executing their orders at this price which is bullish when people execute their orders at the bid price it indicates weakness and those orders appear in red on the tape the time in sales now I will also add that I prefer to take entries near half and whole dollars so I know that there is a significant amount of um psychological resistance when the price is approaching half dollars and whole dollars we see this um all the time so I'm going to just kind of simulate what this looks like approximately um this isn't going to be perfect but you'll you'll get the idea so let's just say this is five this is 550 or well I guess we said nine so um so this is N9 here this is 950 This was um $850 this is $8 okay that's fine so the price squeezes higher it hits resistance at $ 950 which is at the half doll it pulls down here and let's just say dips to like basically N9 and then this is where it starts to bounce back up right right off of $9 psychological support the closer that I can get in to $9 if this is also right at the N9 moving average we have now two elements of support we have support at the psychological level which is the whole dollar and we have support near the 9 moving average what we'll sometimes see happen is the price will test N9 and sometimes it'll actually dip below 9 and you'll see a little burst of selling that burst of selling is usually early traders who got in too early on the dip who are bailing out they're like oh shoot it's breaking $9 I got to get out of this thing this is too weak and I actually like to buy in those spots because what often happens is if it can reclaim nine and hold above it then it's really a good indicator we broke below it but we immediately Got Back above it so now I'm executing a buy order down here at like 898 or 905 and I'm doing it because I'm seeing some green on the tape basically we drop and we immediately pop back up now if just to elaborate on this a little bit more we came down to to you know $8.95 on the bid and I'm like okay I could buy the dip here and at $9 there's a 100,000 share seller on the level two no I'm not going to buy right clearly there's a huge seller dumping shares so whenever I'm looking at these dips I Am Naturally going to be checking the level two to confirm that we do not have huge sellers that are blocking the way so I guess number four uh I could add here check um level two for big Sellers and um and this is more of like kind of a bonus um and then another bonus is the the preference preference for um entry at half and whole dollars I find that those are some of my better entries all right so this is sort of like preference um I but I do I mean obviously checking the level two is is pretty important so anyway so if the level two only shows you know a five five 1,000 2,000 share seller no big deal okay so I buy that I'm then in and then sometimes I'm in very early I'm seeing some of those green orders and whenever I'm taking that kind of dip entry my stop is right at the low here right whatever the low of this candle was that's my Max loss so there are times where I will take a starter on a dip I'll get in at N9 it dips down to 95 and it sell and I see more red going through on the level two on the time in sales and I'm like I'm early I got to jump out and I'll get out maybe for a 5cent 7-cent loss usually those losses are less than 10 cents a share which is not that bad okay so I'm okay with taking a couple of small losses if I have to if I'm trying to do this type of trade and then once I CU I'm trying to time my entry knowing that the earlier I get in with a really tight stop ultimately the more money I'll make if the trade works so I don't mind taking a couple stabs as long as everything checked out that we already discussed volume profile price above 90 ma macd open and you know the level two looks good and especially if it's near a half dollar oops sorry half dollar a whole dollar so then what happens is I'm in down here at $ 8.98 and as we get this green candle forming I'm like okay I feel like the tide is starting to shift and as soon as we get our first candle that makes a new high there I often will add to my position so I'm not the type of Trader that goes in to dip trades ever with just full size on the first entry I I never do that because dip trading it does carry more risk the the success rate is lower but the profit loss ratio is higher and this is important so when it works they work really well you get that move all the way back to the high but you are buying into a bit of weakness you're using these steps to help me help you take the best entries but there's still a little bit more risk of it failing than the obvious breakout trade at least in my experience so I don't go in with full size ever I take a starter position and then I add as it starts working so I always add to my winners I don't want to add to my losers so if it goes lower I want cut the loss and get out and get back in if I see another setup but if it works I want to add to my winners so I take a starter at 8.98 say for instance I add 915 up here maybe 925 so now my cost basis is $910 approximately it squeezes up to 935 945 I now am like look I could add another thousand shares maybe 1,000 starter 1,000 add I go to a 3,000 share position adding at 950 so now my average which is like you know let's just say 9918 or something and it squeezes up here right to $975 into $10 so now with 3,000 shares from 918 to 10 I'm locking up you know 80 cents a share $2,000 winner that's a really solid trade and this was on initially a 1,000 share position at 8.98 where my Max loss was like 10 cents 100 bucks so so what do you think about that risking approximately 100 to make 2,000 that sounds like a great profit to loss ratio and it is so even if this is right even if you were successful on this trade only 50% of the time let's just say you would still be very profitable now with 50% accuracy as long as your average winners and average losers are the same you'll be break even so even if you only made a 100 on your winners and lost 100 on your losers you'd be break even so making 2,000 on the winners and 100 on the losers this losing 100 that that's great that's terrific this a good profit loss ratio now I'll say that something that's important for mitigating risk is making sure you're trading the right stock so at Le at least for me because I'm trading stocks what I think is important is that you're trading something that is obvious so if it's a cryptocurrency it's a Forex pairs Futures commodity you want to make sure you're trading something that's obvious that has a lot of volume because that is what's going to create that strong resolution so ultimately being obvious usually means you need a catalyst you need some typ type of news that's bringing in the buyers so that's an important thing to be aware of if you try to trade you know like this on the S&P 500 you know e- minis or something like that you're not going to find good success because you're just going to get chopped up so this is really a strategy more designed for trading something that has news that has a catalyst and that we're looking for the next leg higher so now let's jump onto this chart and kind of apply what we've talked about here in this example and I've got another example that I'll show you too okay so um and by the way this is something that I also refer to as a micro pullback it's a micro pullback because these are this on a one minute chart is only like 120 seconds of pulling back it's very brief so I'll put a link to my micro pullback strategy PDF it'll be pinned to the top of the comments and it'll be linked in the description and you can download it print it out and it's going to have everything you know that I've kind of been laying out oops sorry a lot of what I've been laying out here and it has some other stuff that pertains specifically to these micro pullbacks so you might want to check that out and you can uh download it and use it in your trading okay so we had this move up we had this pullback and then um hopefully as long as the level two checked out everything else looks good the volume is good the macd is good um and we're above the 9 EMA so everything checks out there we get this nice move up four green candles this is the spot where I would have been um you know taking a starter potentially and look at this this actually bounced right off the doar of 11 so maybe a starter at like 1105 with a stop at 1098 adding first candle to make a new high was actually at 1170 so that's 70 cents a share higher but look if you had a starter down here you know you're up 70 cents a share so you could add there the high of day is 1210 so let's say maybe you added over 1150 when it bounced over 1150 you're like okay this looks good I'm going to add to this so now you're adding 1150 you've got 2,000 shares average cost $120 25 it squeezes up here to 12 you add another th000 shares at 12 so you know look this is a $30,000 position a little more than if you actually took it with 3,000 shares but nonetheless let's just play it out and your average is now like 1140 you get the squeeze here up to 1250 to 13 up to nearly so you know for real on a 3,000 share position your max profit on this could have been $6,000 it's a 20% return that's a huge trade now realistically you probably would have sold some into this break over 12 1250 up to 13 scaling out maybe you locked up three grand right still a 10% return and you're doing that in a very short period of time now here we get a pullback uh but again notice that the selling volume was was a little higher and then the green volume of this candle is also a little lower than the selling volume so now we're a little matched in the supply demand relationship a little more selling another little pop and a little more selling the price is above the 90 ma right here but we're starting to kind of go sideways all right so this this type of area gets a little tricky because usually I like this nice clean wave when we start to go kind of sideways here that's where we may be dealing with issues of hidden sellers up around 1350 possibly I'm not 100% sure it does because I I'm not looking at the level two right now it does break 1350 and when it does you get that move higher this right here this setup wouldn't have been as easy to buy a dip on because of the way it dipped here bounced back up but then didn't go through the high so you could have taken a starter probably wouldn't well you wouldn't have added because you wouldn't have had the high day break right so you wouldn't have added up there it dips down again it dips down again it dips down again to about 1250 and I don't know if I would have taken a starter on this on this one I might have only done the breakout trade as it started to pull away so let it pull away and then buy a micro pullback here under 1450 for the move up to 15 1550 16 and so on you get another dip right here so relatively light volume here a couple light volume selling candles though as well a green candle sorry another high volume higher volume red candle and now we're getting into chop so this is where it becomes a grinder and one of the things I always focus on is the first and the second pullback by the time we get up to the third pullback it can work but the risk is getting higher okay so now let's look at um an example here of another stock I traded this week um this one was uh really nice here so okay so we're going to get dialed in here so we've got a pretty big move as you could see from $4 up to a high of 850 um we started to pull away right in this area this is kind of when when it began if we go back here one of the things I also am noticing immediately is like the the macd waves so the macd is open right here and then crosses over right there so now it's negative and then it crosses back into the positive right here so I don't like to trade when the macd is against the trade I wait for it to be positive so this right here would have been a pullback that would have been acceptable um high volume move up relatively light volume selling macd is positive we're near the 9 moving average right here and we pull away so that would have been fine uh for a dip down here you didn't get the Breakthrough the high on the first attempt but it Formed what we call an ABCD pattern so uh a b c boom breaks on letter d uh and it looks like a w when it breaks and then right here uh this it it's this is consolidation right underneath the high of day so it's not really a true uh pullback it hits a high here but then look high volume selling okay so we got to wait a second macd now crosses over okay so we're still waiting we're still waiting then it starts to pull away here this isn't a spot where I would have bought this dip you're below the N9 moving average your volume profile was higher on the selling your macd is negative I wouldn't have traded it it's fine if it goes up but it's just not a high probability setup it moves higher here I let it go without me and then I watch the first pullback discipline all right we get the first pullback right here accumulating on these bottoming Wicks where we dip and then adding for the first cand to make a new high we don't get stopped out because it doesn't come down below the low we're just going sideways and again another sort of ABCD pattern it pulls away here this is a micro pullback right here some Traders will dip do a dip there for a quick scalp higher and then uhoh high volume rejection higher volume rejection macd crosses over we go negative and we have another higher volume rejection candle here so now we're seeing some higher volume selling candles in spite of that the price does surge higher and when it surges higher now we have another opportunity to watch this pullback so right here light volume selling higher volume green candle and there you get that resolution as it pushes higher now in this case another rejection on higher volume indicates that this is getting a little bit more difficult to trade when you have um when you start seeing these big rejection candles what it usually tells me is that there's an Insider who's dumping shares into the move and I want to be careful because they could dump shares at any time so you do get another move higher here um um barely a pullback squeezes up but these candles start to get really big and this is where although there's profit to be had it's actually easier to manage risk early in the move now you're starting to get a little extended it gets a little choppy once again we get a macd crossover right here cross over so none of this is interesting not trading any of this range and at this point now it's below the high so there's no opportunity higher volume rejection candle right there okay so then the next day this gave us more opportunities all right so next morning right here all of a sudden bright and early this thing squeezes up at 6:30 to seven it pulls back and it comes back up for second attempt all right now this was a longer pullback not the type of pullback that we're talking about here today but this here two four five six seven eight green candles one small red candle the volume is a little higher on that candle and I actually remember when I looked at that I was like okay we got 68 seven green candles in a row this is going to roll over here and I was surprised when it pushed higher what I think happened was some shorts hit this because it had been up so much and it was a continuation uh setup from the previous day those don't typically work as well and you know it was kind of coming into this resistance which was right against uh this rejection candle right here so there were a lot of reasons I think people were short had a short bias on it and then when it went higher they had to cover and so they bought to cover and then long Traders are jumping in just to scalp that momentum higher and all of a sudden look it goes to 8 810 820 830 859 here's a nice pullback little bit again higher volume but still lighter than the previous candles and there's no doubt that the imbalance here is to the buy side there's a lot more buying than selling it pushes higher another light volume pullback and it pushes higher again macd is open we're above our 9 moving average the volume profile is decent there's an imbalance to the Buy side this all checks out first pullback maybe this one's a little bit tough to say cuz it was kind of a little bull trap or a bear trap short sellers got trapped this was a proper pullback this was a proper pullback this again now we're getting in this area where we've got big ranges you take take a little bit more risk when you're trading in this area you have to mitigate that with slightly smaller share size but nonetheless this was a really solid move so we got in this case two days of opportunities on this and through this move here from down here up to the top here I had $10,000 of profit trading that now I ended up giving back a little bit off the top by trading this range with too much size even I was being a little too aggressive but once that macd crosses over right here then it's time to walk away take a break so a lot of Traders they'll get caught into now buying this dip and it doesn't really bounce and then they're buying this dip here it's going lower it's like guys the macd has crossed over the volume profile the sellers have come in right we're below the N9 moving average so if you started following these steps before you consider taking a dip trade you're checking the volume profile you're asking if the price is above the 90 Ma and you're checking that the macd is open that from a chart perspective is going to help you rule rule this out or or tell you whether or not you should proceed if all of that checks out then you're pulling up the level two and you're looking for entries around half dollars and whole dollars right those are your bonuses for being you know really dialed in so this ended up really the the the move was pre-market right here and then the rest of the day it ended up being choppy and look at the open look at that high volume selling there's no doubt the imbalance was to the sell side there were people that were buying these dips but didn't make sense now the the price is below the volume weight average price this just it's not the right place to be a buyer here now after hours ended up squeezing up again uh but I don't usually trade in the after hour session later in the day I focus on trading my window gener is from about 700 a.m. until uh 11:00 a.m. each day that's that's kind of the extent of my window for the most part so I I'll trade for a few hours each day but I try not to overstay my welcome one of the things that I found is that it is really hard as a beginner Trader to know when to walk away right when to call it a good day and I'm sure many of you have the had the experience of you know doing well having a nice Green Day right you're watching your p&l um let's see well we'll do this side it's fine you're watching your p&l build up you know first you're up um you know whatever and then you pull back and you're up a little more a little more a little more and you know should you should you walked away there you kept going should you have walked away there you kept going should you walked away there you kept going should you walked away there you kept going what about here and next thing you know you're actually finishing the day in the red that is devastating and I've been there so to help you in in sort of multiple ways in this episode if you have fallen into that habit here's a little bonus trick that I'll share with you that I think that you'll appreciate okay so what I would do is when you're trading every day when I start I'm starting not with my full position on my first few trades so for me when I'm trading full size that could be 30,000 50,000 shares if I'm feel really confident and the price is moving so that's like full size for me so when I'm starting each day I kep my share size at 5,000 shares so that's like 10% of full size right at full full size so you know you go a little higher than 10% but in any case 20% maybe so 5,000 shares is my starter position and I will not increase my share size until I have first made over $1,000 on the day which is 20 cents per share so until I've made that first $1,000 right here I'm not increasing my share size and the reason is because when I start each day at zero that's when I have the most risk of going red if on that first trade I take 20,000 shares and I lose 20 cents I'm going to be down six grand right that's a huge loss I want to avoid those kind of red days as much as possible so instead of starting with that kind of size I start with small size until I'm up $1,000 once I'm up 1,000 I take my cap off and I can trade aggressively right now I've got 1,000 a cushion if I go right back down to a th000 I'm going to bring my size back down but on a good day I increase my size and next thing you know I'm up you know 3,000 I'm up 4,000 I'm up 5,000 right I start making progress maybe higher and then here's the thing that's really important when do I walk away so I have rules that I follow in my trading that help me sort of automate this process the first rule is not taking more than 5,000 shares 5,000 shares right here until I'm up more than $1,000 the second rule is once I cross my daily goal once I cross my daily goal right here I never want to give back more than half of my profit so at this point I essentially have a trailing stop on the day at $2,500 right here but if I end up making my way up to 10 or 15,000 well I'm that trailing stop is moving Higher and Higher and this is giving back half is like the worst for me I hate giving back half I don't like that at all but if if I give back half I walk away I shut my computer off I walk away if I give back 10% a lot of times I'm thinking all right let's cool off let's start to reduce that share size right I might put the 5,000 share cap back on for the rest of the day if I give back too much so 10% you know 15% 20% these are all acceptable places to walk away or to put a restriction back on the account to avoid the risk of going below this halfway point right so I tried to make sure I do not go below this point but if I give back more than half I walk away right then and there the problem for a lot of Traders is that this might happen in one trade all of a sudden in one trade they give back half and now they're emotionally triggered they're like oh my gosh I cannot believe that just happened and immediately they jump in the next trade and in a second trade to go like this so this right here this loss it'll happen sometimes it'll happen you're having a good day you're feeling confident you scale up and then boom it you take a big loss but what you have to do is you have to walk away as soon as that happens and that way you're walking away still with profit on the day right whatever you made up till there maybe it's 2500 maybe it's a th000 whatever it is you're walking away with profit and then when you're sitting down and you're looking you know at the end of the month or whatever it is you're looking at your p&l you're saying oh geez you know I'm actually I'm really having some solid consistency here you know and I'm just going to pull this up here for you so you look at this and you're like all right you know these are a lot of solid green days I'm avoiding the red days now look even for me I will have bigger red days from time to time I had a couple in um in March here this was uh a little while ago I had a couple back here and this red day was 5,800 back there so look it happens I'll have these red days um but one of the things that I did following those bigger red days was I so during this stretch here where I made over $100,000 just in this stretch I took my restrictions off my account I wasn't using the 5,000 share cap when I was starting trading I was going big from the beginning because the market was so hot right and that's what gave me this big push but then I had a couple red days and I was like okay got a course correct let's put the restrictions on let's put the bumpers on the guard rails the training wheels regain confidence and then you know if we come back into a really hot Market I can loosen them up but as a beginner Trader it's so important for you to cultivate a mindset of confidence right calm cool collected confidence all right now one of the things that I'm thinking about uh for a lot of beginner Traders is if you're struggling with your confidence how do you get yourself into what I would call a positive feedback loop and what I would focus on first is your accuracy because one of the things that creates um sort of low low confidence low self-esteem for um for beginner Traders is when they're trading at like 45% accuracy you know you're losing on most of your trades the majority and you're like I'm trying but I just keep losing so focus on accuracy when I say focus on accuracy I mean take fewer trades and focus on the best quality setups trade just those first and second pullbacks don't overstay your welcome make sure you're always trading really obvious setups not like not the Obscure ones that have no volume trade stuff that's obvious what you will most likely see when you focus on increasing your quality standard is that what improves your accuracy and you can see a bump from 50% to 60% and that's substantial you go up to 60% accuracy you know that's that's a huge Improvement so what ises that do now your accuracy is improving so out of 100 trades you're right on 60 of them and because you're focusing on A+ quality setups you have started to reduce the number of times you take big losses on B and C quality setups which means what improves your profit to loss ratio your profit to loss ratio is the a the comparison of your average winners and your average losers right so your average winners and your average losers these are positive these are negative so for a lot of beginner Traders and and I was no exception my average losers were twice the size of my average winners on on average I was let's see I can't remember now I I can remember it in cents per share so I was making in cents per share um about 12 cents per share but I was losing about uh 24 cents so I had a negative profit loss ratio of 1 to two with the profit loss ratio of 1 to two you actually need to be right 66.67% of the time in order just to break even now that's that's setting the bar kind of High um and and I'll show you my metrics here if we look at my trading um and this is going to be over the of course I'll filter this out this is $12.6 million of profit real money accuracy 68.6% so you can make a lot of money with 68 you can you can make here's a way to phrase it you can make a lot of money and be wrong 32% of the time that's awesome right average winners average losers 5 minutes long pretty quick trades um but that's only when you have the right profit loss ratio my profit loss ratio right now is slightly negative it's close to 1 to one uh during the GameStop period I had one huge loss $240,000 loss which was terrible I did have a $140,000 winner during that period And I I I came out with profit but anyways that definitely hurt my profit loss ratio pretty badly anyways it's water under the bridge now it's whatever so if we come back here if you were trading with your average winners being you know a dollar on average and your average losers being $2 66% success that's not realistic for beginner so ultimately that profit loss ratio is not acceptable you need a profit loss ratio that's closer to 1 to one which would have your break even be at 50% and if you could be 60 65% you're doing well so tightening up the profit loss ratio if I said hey you need to improve your profit loss ratio what would you do you might think ah I need to cut my losers sooner and hold my winners longer those are logical things to do but it's going to be a lot easier to do that if you're Trading the best quality setups so it starts with a quality setups and then that improves your profit loss ratio and then what's going to happen is your consistency is going to improve so this is where we're looking at the calendar right we're looking at the calendar all the days of the the week whatever and you're seeing uh when you look at it in hindsight you're like okay wow green um you know green green Green these are all green days right you're going to have a couple red days here and there whatever um but you're seeing mostly green days consistencies Improv proving and when you have this kind of these kind of metrics then when you look back at your p&l for you know the last 30 days or whatever you know it's going to be more like this all of a sudden next thing you know you're on a positive feedback loop your accuracy is strong your profit ratio is strong your consistency is strong your confidence is building up this is where you've got dedication discipline Drive You've Got Confidence you've got um you're calm and you're collected and you're also cool so and and you're you're you're you're damn good I don't know it's the 4D the four it doesn't matter I just had to I just wanted to make it even so the idea here for beginner Traders is as always to practice in a simulator before you put real money on the line and to build this track record of consistency because this track record of consistency right here this is what's going to give you confidence when you have your first draw down the biggest milestone every beginner Trader is recovering in whole from your first draw down once you've done that then you know you've you've like you've made it so you have your your first move up which is awesome but it could be beginner's luck have your first draw down recover from that and go higher and now you're in really good shape so I hope this episode has been really helpful I really encourage you to download the micro pullback strategy PDF that's Linked In the description and pinned in the top of the comments make sure you check your volume profile make sure the price is at or above the 90 ma make sure the macd is open and it's a bonus check the level two for big Sellers and preference is always going to be towards entries at half dollars and whole dollars if this episode was helpful make sure you hit that thumbs up subscribe to the channel for more episodes on trading strategy just like this and I want to thank you for tuning in I'll remind you as always trading is risky my results are not typical and there's no guarantee you'll find success whether you trade on your own or you learn from me so take it slow manage your risk and practice in a simulator I'll see you for the next episode real soon
The words are the caption track's own and nothing is reworded or re-transcribed. Paragraph breaks are placed between sentences so the text reads as prose.
Free tools for your own script: paste a draft and see where it stands before you record it.
Paste your draft and see where viewers are likely to drop off, with a rewrite for each weak line.
Paste the first 30 seconds of your own draft for a hook score and rewrites.
Check your draft against YouTube's advertiser-friendly guidelines before you record it.
Read this channel's public videos and transcripts, and download a writing brief for it.