Getting the transcript
Reading the captions from YouTube. A video nobody has opened here before takes 10 to 30 seconds; this page fills in on its own.
Getting the transcript
Reading the captions from YouTube. A video nobody has opened here before takes 10 to 30 seconds; this page fills in on its own.
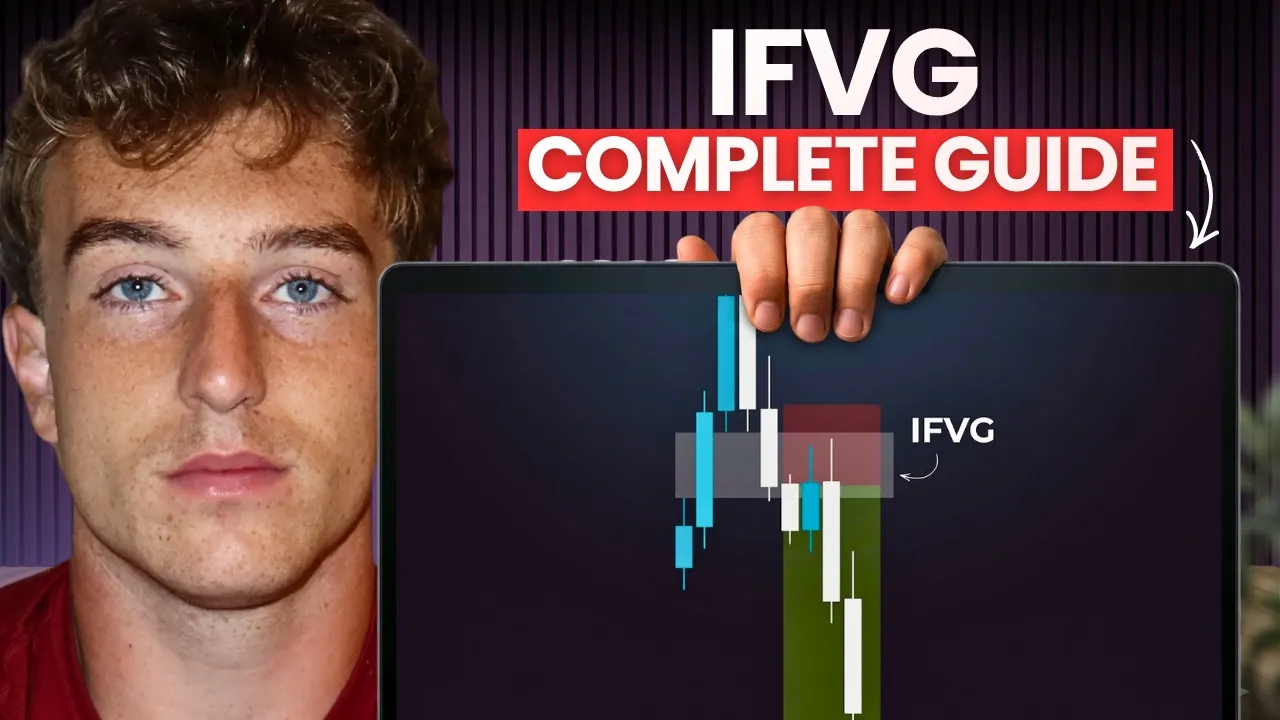
Where viewers went back to watch this video again, from YouTube's public Most replayed graph, lined up with what was said at that moment.
Most replayed moment #1
15:222.4x the video's typical replay level
go like the 5-minute, nope, hourly. Okay, there is an hourly balanced price range here. Look at this. So, there's an hourly fair value gap combined with a bearish fair value gap here, which is a balanced price range. And you can see when we were inside of it, there was never a candle closure on the hourly
Said at 15:15
Most replayed moment #2
32:262.4x the video's typical replay level
but we haven't closed. Ooh, okay, I see something like there's a lot of trend line liquidity right here. I think we run this. So, at this point, I'd probably be bearish, but we did hold this 15-minute, so not yet. So, let me just play price and see what happens here and I'll kind of give you my thought process.
Said at 32:19
Most replayed moment #3
10:142.2x the video's typical replay level
ran right here, and then an inversion for a fair value gap back to the upside. And you can see we just perfectly re-run the data highs, and funny enough, this is on Bitcoin, but this works in everything. NQ, Bitcoin, gold, anything with red folder news. It can work with orange folder and yellow folder, too, but red
Said at 10:07
The graph counts replays. It does not show where viewers stopped watching.
Words
9,917
Runtime
42:40
Speaking pace
232wpm
Reading time
41min
232 words per minute, above the 201 75th percentile of 349 measured videos. That distribution comes from the 349-video hook study.
Opening (first 30 seconds)
3 years ago I made my first ever video about IVGs in my mom's basement. 3 years later, I've taught almost every single mentor in the space and IVGs have just blown up. And And I'm super excited to make this video cuz this is going to be a complete guide from my perspective as the IVG kind of founder after ICT concepts. I'm always going to credit ICT, watch the 2022 mentorship, but this model I kind of created on my own based off those concepts and every other mentor has started teaching in the space. So, without further ado, here's a full complete foolproof guide on my IVGs, how I see them, the different
116 words, the words spoken in the first 30 seconds at 232 words per minute.
Free, no signup. See how the first 30 seconds hold attention, with rewrites.
Sentence shape
| Measure | This transcript |
|---|---|
| Sentences | 728 |
| Average words per sentence | 13.6 |
| Longest sentence | 82 words |
| Questions asked | 145 |
| Sentences containing a number | 63 |
Most used terms
Filler phrases
310 in total: like 138 · right? 32 · you know 32 · kind of 28 · um 24 · uh 19 · actually 17 · basically 10 · sort of 7 · I mean 2 · literally 1.
A literal whole-word count of the same phrase list the Prepublish browser extension uses, so a phrase inside another word is not counted and a phrase used in its ordinary sense still is. It is a count and not a judgement.
Free, no account. See where attention is likely to drop, with a rewrite for each weak line. The free check shows the scores and the one issue costing the most. Or run it on the words above first.
Free · No login · See a sample audit first if you prefer.
What this transcript is
Every word below is the caption track YouTube publishes for this video, pulled from the video itself and reproduced unchanged. It is not Prepublish's writing, not a summary, and not a re-transcription: it is the video's own published captions. English captions, generated automatically by YouTube, in the video’s original language. Source: the video on YouTube. A channel that would rather this page did not exist can ask for its removal through the contact page, and it is removed.
3 years ago I made my first ever video about IVGs in my mom's basement. 3 years later, I've taught almost every single mentor in the space and IVGs have just blown up. And And I'm super excited to make this video cuz this is going to be a complete guide from my perspective as the IVG kind of founder after ICT concepts. I'm always going to credit ICT, watch the 2022 mentorship, but this model I kind of created on my own based off those concepts and every other mentor has started teaching in the space.
So, without further ado, here's a full complete foolproof guide on my IVGs, how I see them, the different types of models you can take with IVGs, and how you can become consistently profitable. Let's begin. The number one thing that you have to understand before I show you my model, teach my model, give you any sort of thoughts, or make you think anything in your brain is this. There's only one thing that matters, and it's draw on liquidity, okay, or DOL for short.
And this is the most important thing in the entire market. It's more important than daily bias. It is more important than inversion fair value gaps. It's more important than VWAP. It's more important than fair value gaps. It's more important than EMAs. It is the most important thing in the entire market, okay? And every single time that you enter a trade, you need to be looking for the draw on liquidity. So, what exactly is draw on liquidity?
Draw on liquidity is where the market should move in like a certain amount of time, okay? So, for example, if I go to any sort of chart and I go to a line chart here, I'm just going to mark out a random low, okay? So, this one right here. I already have it marked out cuz I was doing another video, but this low is a draw on liquidity. This high is a draw on liquidity. This low is a draw on liquidity. This low is a draw on liquidity.
This low Every single one Every single low and high you see in the entire market is a draw on liquidity. And our job is to figure out when the draw on liquidity is likely going to hit and what about the candlesticks tells us that it's going to hit, such as momentum towards it or other concepts such as market maker models that I learned from ICT. That is the most important by far. So, let me just give you a good example of this.
In this case here, I know the draw on liquidity is going to be this low, but in this case here, I don't know that, okay? This is not the draw on liquidity at this point in time. It is only the draw on liquidity once we start shifting and once we start shifting down towards it and we get market structure that actually supports the draw on liquidity. Play the price. Play price. So, around right here is where I'm going to be like, "Okay, we're dumping through everything.
Every single fair value gap's failing. I know this is likely to be the draw on liquidity." And once I have that, that's when I like to take my inversion fair value gap down to the draw on liquidity. But it all starts with the draw. Where is the draw? Why is that the draw? How does it, you know, affect daily bias? Because daily bias and draw on liquidity are completely two different things. So, it is one of the most important concepts you have to understand.
Now, I want to talk a little bit about why daily bias and why draw on liquidity are different, okay? A daily bias is basically you trying to predict where the daily candle is going to go. So, you know, if I'm going to see the daily candle open up here, right? You're going to have to try and predict will it go up or down. It is not the same thing as draw on liquidity though because there can be multiple different draws on liquidity on the one minute time frame within this whole candle.
Because this candle takes 24 hours to actually close, there's a lot of many setups and just things going on on the one minute time frame that has nothing to do with daily bias, right? So, me trying to predict where the daily candle is going to go might not help me if I am bullish because there's a short-term draw on liquidity right here, right? The daily candle could be bearish, but we could get a setup that looks good because we have like a mini draw on liquidity on the one minute time frame to the upside and not the downside.
Let me just show you one more example. In this scenario here, we have a fair value gap that gets broken. We go up and there's a short-term draw on liquidity to these relative equal highs. We hit them, great. But price overall throughout the day ends up going down in the long run. So, you can see the draw on liquidity here is bullish, but the bias overall might be bearish. And that's why draw on liquidity is a lot more important because it just helps you with timing and really getting those quick easy one hour plays.
Now, let me go over my favorite draw on liquidities that are going to help you because again, I see the market target these constantly and constantly constantly, and you need to know what these are. These are all my draw on liquidities, and this is my tier list, okay? So, I'm just going to go over each one real quick. We have perfect equal highs and lows more than three candles away in an S tier. This is the type of draw on liquidity I see hit the most.
Then we have a data high and data low with a giant wick, which I will go over later in the video. Then we have perfect equal lows and highs one three one to three candles away. Those are A. And then we have a trend line, okay? Trend line's a good draw on liquidity, too. It's in the A tier. Highs and lows inside of fair value gaps, B tier. I love these. Trend line liquidity with two to three touches, B tier. New week opening gap, new day opening gap, B tier.
Relative equal lows and highs, B tier. These are not perfect, but they're relative equal, okay? And then previous session lows and highs, you know, London, Asia, etc. And then in C tier, we have unbalanced inefficiencies and then volume imbalances and then F tier. Uh I'm not even going to go over F tier. Order blocks is one. Order blocks is not a draw on liquidity. A lot of people get this confused for some reason. Now, some of you might disagree with something like an unbalanced inefficiency being a C tier, but in the bottom I say, if you combined the unbalanced effic- inefficiency with a trend line or perfect equal highs or lows, this C tier now becomes like an A tier if you combine it.
So, just remember that. An unbalanced inefficiency alone is not great. This is one thing where a lot of mentors who teach who learn off me actually get wrong. They have these models where they only target unbalanced inefficiencies, but little do they realize it's not good unless they're combined with something else, and they fail to teach that. And that is a very important concept that you need to understand. So, let's just go over a couple of the draw on liquidities right now on the chart cuz you need to be aware of what each one is.
So, one of my favorite draw on liquidities, which I labeled this at A tier, okay, is trend line liquidity. A trend line is something like this where we get so many perfect touches in the same line, and it looks so engineered and so just like juicy. I don't even know how to explain it. And the bodies kind of respect the same level multiple times over. So, you can see right here, right? We have a level respected. We don't know what the trend line level respected.
We don't know what a trend line. Okay, now we're starting to see the trend line. Now it's starting to build up more on liquidity. So, it's gone from like a B tier setup to a B tier liquidity to like a A, you know, almost even to an S because of how many touches there are here. So, I know it's going to be ran. And again, people are longing out this trend line. So, that's where all the stop losses going to be below this trend line.
So, I just I love this for targets. I love, you know, finding entries that go run these trend lines. And again, I would probably end up giving this like an A tier, right? Because there's just so many touches. Another draw on liquidity I love is relative equal highs and relative equal lows and perfect equal highs and lows, right? I usually give like equal highs and equal lows that are perfect with more than three candles apart as tier because they always hit.
So, for example, this would be relative equal, okay? This high does not run this high. So, this is a completely relative equal. It's not perfect equal. Now, I would still give this like an A tier because they're still pretty far apart, and the fact that a index at 24,328 is this far apart, and they're just just sitting there like a double top is very algorithmic, okay? These are going to be ran. Now, what would make it S tier?
Well, if we had a perfect equal high and equal low, right? This would be perfect equal highs. At this point, I know we're going to go run it because I know a lot of people think this is a double top. And uh yeah, so that would that's my equal highs and equal lows and what I like to target. Again, pretty simple if you ask me. Same thing to the opposite side, you know, if we have relative equal lows like this, right? It's the same idea.
This one is not perfect perfect. They're not touching, but they're still pretty good. As this one right here, this would be perfect the two of the set. So, this would be a little better. But regardless, they're both great draw on liquidities, and they're both good targets when we have them in the market. And again, I love targeting lows and highs like this. Now, for my famous one, data wicks, data high and data low. If you don't know what these are, it's basically red folder news that forms a candle at exactly 8:30, okay?
Sometimes 10:00, sometimes FOMC, just any really news event. So, I'm not going to show you guys a live example because I want you to go back test yourself, and I I don't want to keep showing you, "Oh, here's a data wick, and here's how you play it." Complete hindsight, okay? I'm giving you a concept. You're going to learn it. You're going to be a free thinker, and you're going to go back test yourself. So, remember, these are usually at 8:30.
So, let's say this is 8:29, and then we get a, you know, 8:30 red folder news event, which again, in order to find these, you have to go to FX Replay, okay? So, you know. And again, in order to find these, you have to go to ForexFactory.com. Pretty simple to type in. And, you know, if we go to tomorrow at the time of making this video, there's no red folder news. Next day, and we have red folder news, USD. This is what you're going to want to look for.
So, Tuesday, we have red folder news at 9:45, and uh we could potentially get a data wick there. But I like the 8:30 data wicks the best off of CPI, NFP, um you know, unemployment claims. Those are like my favorite ones. But that's where you're going to find these. And typically, what happens at this 8:30 red folder news is we'll get some sort of algorithmic candle with either a giant wick to the upside, giant wick to the downside, or even both.
But essentially, if we if one of these are swing low or swing high, okay? You need to understand that they're going to be a great draw on liquidity. So, this would be a draw on liquidity right here, and then this would be a draw on liquidity. And typically, what I do is I wait for one of them to hit, and then I look for the opposite. Wait for one of them to hit, look for the opposite. And this is like what I do. So, I want you to go back test this, okay?
Only 8:30 red folder news events only. And I want you to go look at how price reacts and, you know, how you can play that. So, right here is an example of we had news at 8:30. You can see how obviously the wicks were. We wait for run one to be ran right here, and then an inversion for a fair value gap back to the upside. And you can see we just perfectly re-run the data highs, and funny enough, this is on Bitcoin, but this works in everything.
NQ, Bitcoin, gold, anything with red folder news. It can work with orange folder and yellow folder, too, but red folder is going to be obviously your best bet most likelihood of getting a candle that looks like this. But, this is typically the, you know, the setup I like to look for. Now, another one of my favorites, highs and lows inside old fair value gaps. And I only care about these when price reverses, okay? So, for example, going to the next week at the time of this video, I do love this for a target.
It is an old high inside of a fair value gap, and we respected it, and it just makes sense to go hit because of this reversal. Right here, if I go on the replay mode, this is not a good draw on liquidity. There's nothing telling me the market's going to go up. There's nothing telling me the market's going to reverse. There's nothing telling me that this is going to be a target. This is bearish, okay? When we go down, we go down, right?
We're just kind of watching price. And then, all of a sudden, boom, hourly inversion back to the upside signifies some smart money reversal. Where could the draw on liquidity be? This high inside of this fair value gap right here. I love these. I love when I combine it with these inefficiencies because technically this is the part of the inefficient inefficiency that's still unfilled. So, this is a great target not only to target the rest of the inefficiency of the fair value gap, but also the high inside of the fair value gap.
Because when price goes down here initially, what causes price to go down? Sellers or algorithm selling. Where are their stop losses going to be? At this high that caused it to go down initially. And once we do get that true reversal, that's true smart money reversal, then this is going to be a very prime and really good target. All right, two more. I want to talk about new week opening gaps and new day opening gaps.
Uh I'm not going to go spend time trying to find these. Um I'm just going to type in a new week opening gap indicator, okay? Turn this on, I guess. Now, these are also great draw on liquidities, but the reason I have them in my, you know, B tier is because there's just a lot of them. You know, they're going to be draw on liquidities no matter what at some point. But, my favorite ones are when we open up on a Sunday like down here, okay, or or up here, and we have like the the gap right away.
So, let's say price just opens up here or opens up here. And then, we have a giant gap right here or right here. Price will usually draw into the unfilled gap, right? If we opened here, price is going to draw into the unfilled gap like this. I'll label this in a bluish color, okay? And if we open higher on the Sunday gap, price is likely going to retrace into the gap right there. And if we don't do it on Sunday night, then this is a great draw on liquidity for Sunday morning.
Let's say price opens, we don't even go fill the gap, we just go up, and all of a sudden it's 9:30 and we have this gap below. I would be looking for shorts back into that gap and filling the whole gap. So, it's on the B tier, but when you combine it with other stuff, it's even better. And last but not least, I want to go over unbalanced inefficiencies. These are just unbalanced fair value gaps. So, for example, price goes down here, and we left an unbalanced 15-minute gap.
So, price a lot of the times likes to rebalance or retrace into these gaps if we're still bearish. So, right? This might be a good time to target a long into this unbalanced gap. But, even better when you combine it with other stuff. So, here you can actually see we have kind of like this mini trend on liquidity. So, not only do we have a gap above that's unfilled, but we also have, you know, good highs to target here, which is why this might be a good play.
A lot of mentors when they re-teach us, they're like, "Oh, it's a good because we just have an unbalanced gap." But, there's a lot more and you need to understand there's a lot more because if this weren't here, this probably would not be a good draw on liquidity in the first place. When you combine the unbalanced gap with the all these stacked up highs, well, then this becomes a much better draw on liquidity. And yeah, that's pretty much it for draw on liquidity.
There's a lot more, but I go more in the depth in my everyday livestreams in lifetime. I hate explaining hindsight, but this is just a starter for you to kind of look into this and understand why draw on liquidity is the most important thing in the market. All right, now that you understand draw on liquidity, I'm going to be going over my actual model, okay? My model is nothing without draw on liquidity, but draw on liquidity is nothing without my model as well.
So, let me just teach you my whole model and do a basic rundown of what I like to do. All right, so, here's my basic IFVG model. And before you get confused and you're like, "What is going on here?" Okay, let me explain, okay? Don't worry. And by the way, I'm going to leave a link to all these PDFs I show in this video in the description, so don't worry about that. This is my IFVG model, and there's two main things I like the best, okay?
And it's actually going to be one and two here, okay? Which the one is a liquidity sweep, okay? Like when we go above or below some old high. And two is delivery from a fair value gap, okay? Before I go any further into this, let me just show you some examples so you can get what I'm talking about, okay? So, if I go here, there's actually a very easy one right here. Look. a previous day low sitting right here. If I just zoom in, you can see pretty low.
You know, if I go to the 5-minute, you can see better. And we go below it, and then we kind of just shoot back up. This is the first thing I look for, okay? The second thing I look for is some sort of fair value gap or uh PD array to the left right here. I don't know if there's one here. Let's just check and see. If I go like the 5-minute, nope, hourly. Okay, there is an hourly balanced price range here. Look at this.
So, there's an hourly fair value gap combined with a bearish fair value gap here, which is a balanced price range. And you can see when we were inside of it, there was never a candle closure on the hourly below this zone telling me that we're going to go down. So, when we swept liquidity here, this was still a very valid liquidity sweep based off of this hourly zone holding, if that makes sense. If we swept this liquidity pool right here, but the hourly closed below it, then that would not be as good, right?
Because the hourly didn't close yet, we still know this is a valid long setup, okay? So, that's like the first thing I like to look for in my model, okay? Now, the third thing I like to look for is a clear liquidity target, which I just talked about. I think this is the most important, a super clear and strong draw on liquidity where you can see I have equal highs, equal lows, intermediate-term high, which is a high inside of a fair value gap, intermediate-term low, which is low inside of a fair value gap, data highs, data lows, or LRLR, which is trendline liquidity, okay?
I love this. If we don't have a clear target, I will likely not take it on my live account. Maybe I'll take it on a funded, but obviously I trade those a little more loosely, okay? And then, for the singular and obvious fair value gap. If it stands out, if I can see it all the way back here, then I absolutely love it. If I don't see it from back there, then I hate it, okay? Yes, you can get higher RR taking very non-obvious fair value gaps to the draw on liquidity, which I can do and I have done.
Um and, you know, a couple of my mentors in the space like to do that, but long-term, it's very hard to earn and will make you stressed out because you will probably take a couple more losses doing that. But, if you really want, you could be patient and and wait and, you know, take the obvious gaps. And if you're not patient, you could try those. Just hopefully your RR makes up for it, and hopefully you're really good at understanding the math because it will be lower win rate, but it can be profitable as well because it's a, you know, there's more RR basically to be made, okay?
And then, last but not least, the long in discount, short in premium, okay? Typically, when I'm taking a live account trade to putting a lot of risk on the setup I take, I love to only take it if it's in discount for a long and premium for a short, right? I will not You will not catch me longing an inversion for a fair value gap in my live account like way up here. Like sometimes they work, but like I just I don't like doing that, okay?
So, this one right here just way, way too way too high, basically. And you can see some of them do work, but some of them also fail as well, and I just don't like the probability. I'd rather just stick to the ones when we're like super low, like near low of day, or stick to the shorts where we're at high of day, right? It's going to be a lot more high probability taking shorts up here than it's going to be taking shorts down here.
Going to be a lot more high probability taking longs down here than it's going to be taking up there, okay? So, that is basically my main model. I like the V-shape, and I like the liquidity sweep and delivery from a higher time frame gap. And again, there's a lot more to this model, so give me a second, I'll explain. But, let's just go over a few examples of what this model looks like so I can show you what trades I like to take.
We're going to go back to this first example I just showed you. We have a low of day that was from the previous day low right here. We swept it, and I don't know how we're going to react to this in hindsight. Like I generally don't know if we're going to bounce off this or not, okay? But, we react to it, all right? And I'm looking for some sort of singular obvious fair value gap. And on this PDF it says singular and obvious fair value gap, but this setup here has this fair value gap here, and then this fair value gap here.
Now, is it singular? No, but you can combine both of these and say, "Okay, there's two fair value gaps here. They both combine into a very obvious. This is singular." I do that all the time. So, this would actually still be valid. But, when I see this reaction on hindsight, okay, at this low here, this is a good setup to me because not only is it obvious, not only if is it like an obvious fair value gap breaking, but we have a liquidity sweep, we're delivering off an hourly, and it just sucks good momentum back to the upside.
So, how do I enter? I basically just get in on the close, and I target like a one to two RR. This one I probably target these equal highs before this inefficiency because it's like, I don't know if this is going to break or not, and at that point I'm up one RR or 1.2 RR, actually, and it's just it's a safe kind of like play for me. Because I don't know if this is going to break. You could always guess if this is going to break, but I really won't target higher unless this wasn't there.
If this wasn't here, and there was more draw on liquidity up here, a very obvious high, or equal highs up here, or trendline liquidity, I'd probably end up targeting up there. Now, this setup right here is a short that I actually alerted live and I took on my live account. And this one is a little less V-shape, but what's important about this? We swept this trendline liquidity right here. There's three highs in consecutively.
We swept these equal highs right here. They were triple equal highs. And we got a very bearish reaction from not only the triple equal highs, but this fair value gap here, which is actually is also a balanced price range, okay? So, that's already three confluences in the trade. We swept drawn liquidity of the trendline. We swept the equal highs. And we're delivering from this gap. And we're in premium, okay? Now, it's a little less V-shape on the 5-minute.
But, if you go to like the 15-minute, okay? Right here, this actually the time frame I took it off of. It looks a little better, right? It takes 1 2 3 4 candles inverse, right? It's singular. It's obvious. I didn't even combine this with anything. And there was a drawn liquidity on the other side. If I go to the hourly, which was a low inside of a fair value gap, okay? And this is where it should all start to be coming together, okay?
What did I see first before ever taking this trade? I saw the drawn liquidity. I saw momentum going towards this low inside of this fair value gap. I called this out multiple times in my stream. I'm like, "Guys, listen. We're not bearish yet, but the second we start death candling through here, just keep in mind there's a low inside of a fair value gap here. Very obvious. And if we get a set up to it, I'm taking it." What do you notice?
I wake up that morning. I saw this death candle below 15-minute. And I'm thinking, "Hmm, have we hit the hourly low here yet?" And the answer is no. So, I took this knowing that. And literally just targeted this hourly low. And that was my trade. But, it doesn't start with the inversion. It starts with the drawn liquidity. And then I look for context right after, right here, okay? They can see just how important that is.
Now, I want to go over my other rule on break even because this is a big part of my model. And a lot of people failed to understand this. They just see, "Oh, dodgy inversions." But, I have this special break even method I do. And I'll explain the idea behind it first just so you understand why I do it, okay? And just, you know, explain. Okay, listen. Let's say we sweep liquidity here. Inversion back up like this. We have Let's say we have equal highs up here.
Super obvious. And I'm looking to target these, okay? If we have an inversion fair value gap, and price closes above the gap, but also hits the internal high at the same time or internal low, I likely won't take it because I like to go break even at these highs because in so many of my winning trades, if we get an inversion fair value to the upside, and there's obviously equal highs, we will just accelerate through that break even point and boom, go down.
And what I've noticed is if we don't accelerate through this internal high, okay? If we don't accelerate, it will likely fail and go down again. So, if we do like this, we just kind of slow down, and then we go back to my break even, it usually ends up failing. I would say that fails about 60% of time. Now, for the other 40% of time, it goes above, and then it still works. You're like mad, but like this is where I start branching off of other mentors a little bit and where other mentors kind of change it up because there's times where like we will hit the break even point, but I'll still take the trade because I'm still pretty confident.
But, then there's times where like I don't like conditions, and I won't. And this is where, you know, other mentors teaching my strategy to start to get really subjective on when to go break even when not to go break even. And this is one of the most important things I think you can understand the market because it's like every single one of my winning setups, if I go back to that, it's just all run just so quickly. And if it doesn't, then I don't want to participate in price, okay?
Like for example, if we just go to my trade recap channel here, like again, look. This inverse, it ran super quickly, right? I would have gone break even quicker there. And what does price do? Just It just goes at the TP. And I don't want to be in a trade that's going to stall, okay? Another trade right here, okay? This one inverses. We kind of go back into the fair value gap a little bit, but then look. When we run this internal high and these equal highs, I'm going break even because it's like I know if the market's going to go in my favor, it's just going to keep running and not do BS and not pull back.
And if it does, then we're either one, I'm wrong, or two, you have bad price action. So again, a typical winning trade for me will typically run like pretty well. And if it doesn't, it's just I don't know, I don't like it, okay? We got another one. This one right here. I took a loss on this one. What And look, what do you notice? It just It It inversed, and then we just didn't really get that running candle like any of my winning trades that did.
So, I figured this one would lose because we didn't get the same reaction we did as my winning trade, okay? Um another one if I go up here. There's another one here. Okay, this one is a little different. Um this one was on the 5-minute, so sometimes this happens. But, this one did kind of chop around a little bit, then come up, then go down. But, even after this little reaction out of the 5-minute, look how quickly we just go down.
This is where I'm going break even, the next internal low. We kind of chop before it, don't hit it. We go retest it. And then boom, it just instantly runs through the break even and then goes lower. Because I know if price is right and it's going to go in my direction, the break even will just get plummeted through. And if we again, if we have bad price action or I'm wrong, it will not. And that's just what I've kind of learned from my past experiences, okay?
But, this is something you're going to have to backtest yourself. Same thing with this trade. When I took this long, we just absolutely sprinted up. We did not slow down. It was beautiful. It just worked. And again, that's just what my typical winning trade looks like. So, I want to show you guys a couple examples of, you know, invalid versus valid trades, okay? So, right here, okay? We have these two fair value gaps.
So, I'm going to combine them into one because I like the singular fair value gap kind of theory. And you can see where's the mechanical spot to go break even. The high that is a swing high, which basically a swing high, if you don't know what that is, is basically when we have a high, higher high, lower high, right? And this would be your swing high, the top of the three. This would be the break even point. So, this trade would be a trade that would just instantly be a break even because you can see we hit the break even point, and then we go down.
And did it work after? Yes, it did. Sometimes that sucks, but in the long run I know that saves me, okay? Another break even point is a fair value gap. So, this one right here. We have a bearish fair value gap. We close above, but at the same time of closing above, we also hit this fair value gap. So, this would be an invalid trade because we Yes, we close above this, but we need to close above both in this situation.
Let's say price closes right here. Where do you go break even? You go break even here because it's a high inside of this fair value gap, okay? So, that is very very very very important, okay? Let me go to the hourly time frame. Okay, let me see if I can find an example on the hourly. Right here. We have an inversion fair value gap. It looks like we swept a lot of liquidity. I feel like it's a lot we swept. I guess this low right here.
Here's the entry. Where would the break even point be? The break even point would be at the next high, which this would be a new week opening gap as well. And the reason I do this is because look. This trade hits the break even point. We never go back down to the entry point. And if we did, that would not be a good sign. And price just runs. And I know if I'm right, and I know if I'm it's going to be good price action and not bad conditions, we will not go back to the entry.
And most times you do, it just ends up being horrible conditions anyways and just horrible PA. And I don't like trading when that happens. And that's just from my own psychology. If you like sitting in trades with choppy conditions for hours, or you are okay with being wrong and taking a lot more losses, then the break even method is probably not for you. Some people do it. Some people don't. It's really up to you. And that's just what I prefer, okay?
If that makes sense. Now, let me show you one more advanced method to go break even. Uh this one is something I've kind of built after years of experience. And it's this right here. We have two fair value gaps, right? If we close above them, boom, we'd probably go up here, okay? And I want to show you what happens. We close and hit this break even point, right? This would be the break even point cuz it's the last swing high before the fair value gap.
But, low-key I'd still probably take this trade or try it because if you ever see us close and there's trendline liquidity, and let's say we hit like one of the highs, but not all of them, I still know we're going to finish running the trendline liquidity. So, this is one of those examples where if we close above, I still might take it because I'm like, "Okay, we close above. Yes, we hit this little tiny high, but we still have a lot more liquidity to run." And let's say we closed here.
Let's say we closed here. This would be a valid trade. But, on this trade I might not go break even right here because it's like this should technically be a domino effect. If we close there and we hit the high, I know we should domino into the other highs. So, I would not go break even until we started running more of the highs. I'll probably wait a break even for a little bit and go break even here. Same thing with this example.
We have a giant trendline here. It's like a 2-minute trendline, okay? And we get a break of structure here, okay? We get an inversion on the 1-minute time frame here. Technically speaking, the break even would be here, okay? For if you took this trade, right? And then By the way, I'm going to go over stop loss in a second, so just bear with me. Technically go break even here, but for this I'd probably honestly wait to go break even like here because we have so much trendline liquidity here.
And it's like I know if I'm right, price not going to stop here. And if we do stop here and go up, I'm like I still have enough conviction that price is going to keep running these lows. So, that might be an example where I might move my subjective break even or my mechanical break even from here and make it subjective and go break even here instead. And that's just something you're going to figure out through screen time.
So, yeah, that's basically three examples of when I do and don't move my stop to break even, but it really just depends on you and your experience. Now, pretty much last thing I want to go over is stop losses. And stop losses are interesting because they're pretty subjective or they can be subjective. Let me go over like my typical stop loss. When I take an inversion fair value gap like this, some mentors just put hard stops below the low.
Some just do it right at the bottom of the inversion. Some just guess. But, here's my way of doing it. If we have an inversion that looks pretty obvious, but we don't close too far above it, I will keep the stop loss as a close back below the inversion. So, what I typically do is I will risk one contract less than what I'm comfortable with if I'm on micros. Usually on minis I don't cuz I'm only taking like one to five minis and like there's not much leeway for room.
But on like micros, what I'll do is if if I'm about to take like six micros in a trade, I'll take five instead just in case the close below is really bad and it wrecks me more than normal. I somewhat do a stop loss that's like this though, okay? So, if I were to see this trade, I'd probably do a stop loss around here if I had to guess. like to keep it like at the swing low, but I don't like to keep it right here and I do it right there.
Okay, that's what I size for. But I will not stop out if we don't go and close below back below it, okay? So, if I had a stop loss here, I would not stop out of this because we didn't close below. I have my hand on the X button and I'd be ready to click the X, but I would not stop out there yet because we didn't close below, okay? So, that's super important to understand. Same thing with right here. Right here, we have a five-minute inversion, right?
We closed below. I would probably guestimate loss to be somewhere between the swing high and the top of the inversion, so like right here and that's what I'd size for. It doesn't mean I'd stop out there, it just means that's what I'd size for. And sometimes if you do stop out, sometimes the close is actually a lot better than you think, so you lose less than you think and sometimes it's worse than you think, okay? I'm always going to keep a hard stop at the swing high no matter what, but I size for like this and usually if I get stopped here and then here sometimes, it usually balances out to somewhere like this.
So, right here, here's an example where we have a bullish fair value gap. We closed below it right here and you can see price actually closes right here, which is not too bad, right? Where I probably would have had my stop loss sized for here. So, as you can see, sometimes it closes above much better than you think right here and you'll actually lose less than you think. But sometimes but it's going to bounce up because sometimes you might close there, if that makes sense.
So, you can see this is actually a horrible setup. I'm just using it for an example, but it stops out clearly and even after we close, it would have just wrecked you anyway. And last but not least in this video, I want to do a couple trades on FX Replay and back test it just so you guys can see, you know, what my thoughts are in live time. So, I'm going to take two trades, win or lose. I'm not going to edit this out, okay?
So, let's just get into this, all right? So, I'm always going to go to New York session. We're going to go to 9:30 open just to make it easy and we're going to start with the one-minute time frame. Now, I'm going to first check the 15-minute. Is there anything obvious? Yes, there is. There's an obvious 15-minute fair value gap here. We have any inversions on the 15-minute time frame? And not really. Um and then hourly, uh hourly's below this, but we haven't closed.
Ooh, okay, I see something like there's a lot of trend line liquidity right here. I think we run this. So, at this point, I'd probably be bearish, but we did hold this 15-minute, so not yet. So, let me just play price and see what happens here and I'll kind of give you my thought process. Thinking I'm going to look for a short. Could do one here. 30 second? Okay, 30 second short. I would take this. Boom, right there, look.
There's a play right there. I'm bearish, right? There's my entry. This case, I'd probably do a stop above like like a hard stop here because there's an order block, an order block right there and then I target all of that trend line liquidity down to here. So, you can see, let's see what happens here. Okay, so it would have been a scale half size break even trade and we're probably going to go back down is my guess eventually.
Um but pretty bad PA here. Um but you can see we get a move up at open, but I'm leaning bearish because I knew we had the liquidity below and then we V-shaped back through it. I'm shorting that. I'm doing probably like honestly main TP, I'm probably doing at these equal lows, these relative equal lows. I'm probably getting out most here and then I probably just see a runner and I would have gotten stopped with the runner.
So, that's what I would have done for that, okay? And then I would have been done for the day, okay? So, that's one win. Let's go to the next session right here, okay? All right, so we're going to go to the 15-minute. I'm going to see if there's anything Oh my, this looks horrible. Okay, so this I would not use a 15-minute here, too choppy, there's no fair value gaps. Hourly, no fair value gap. So, I would not have a higher time frame bias here.
This looks awful. Um I'd probably just sit on the one-minute time frame and look for a decent pattern trade or decent equal highs. I guess we have equal highs here and see if I can make something work. Let's see what happens. Okay, there's open, there's dumping, dumping. Any like 30 second inversion here maybe? Ooh, okay. We have a pretty good 30 second here. Pretty good 30 second. I like how we manipulated below and I like how this is so V-shaped and I like how we have a really good break even point right here, so I I'm almost guaranteeing that this is going to be not a loser.
And are we Yes, we are. Look, we're delivering from a five-minute gap right here. The body held the gap, it also held this little volume imbalance. So, this would still be valid in my opinion. Um it probably is cleaner off the 15-minute though. Yeah, look. 15-minute's like what we're actually delivering off of. See how we have a 15-minute here? So, I think this would be a great trade. I know we don't really have a higher time frame bias, but we just swept into these lows right here, these relative equal lows and then we have a 30 second.
So, I I'd take that personally. I'd go for like a 1R. I'd probably go for this high inside this fair value gap and up here, anything interesting? Ooh, okay. I mean we kind of have equal highs here, so I'd probably like I'd probably like to target there to be honest, maybe scale half here, but uh let's see what happens here. Okay, break even. So, it would have been a break even trade, all right? Now, does it end up saving me?
Yes, it does. Look. Look how bad this price action was after, okay? So, you can see I would have gone break even there. It would have been a break even trade and look how bad the conditions or conditions are after. This is why I like to go break even because I know if I'm wrong, I'm either going to stop break even and I know if there's going to be bad price action, I want to get stopped break even, okay? Um so, yeah.
All right, so I would not trade the rest of that day. I would probably get stopped break even and be like this condition horrible and then go to the next day. Next session, we're going to start with the 15-minute. Pretty pretty damn bullish. Uh yeah, I'm probably bullish here. We're just ripping. We're probably going to go to like this buy side if I had to guess. It looks like it's an old high inside of a fair value gap right here.
So, just because momentum and everything and I just assume we're going to rip here. So, let's see if we So, this is where I'd be going to the one-minute looking for like a fake move down to the downside and then an inversion up. Okay, we're just not going to get it. That's what that's fine. So, I had the draw on the liquidity there, right? Right? I figured we'd go to this 15-minute just because momentum, you know, it's kind of a freight train, but unfortunately Oh, and also if you look to the left here, look, we inverse this gap.
Um but we just didn't get like a lower time frame model, okay? So, at that point, we expanded 15 million points. I'd probably not trade that day, probably just go to the next Next session, 15-minute time frame again. We have a bearish gap right here. We're kind of inside of it. We haven't broken it, but we do look bullish, so I'm just going to kind of see if we can deliver it. So, no close above, so I'm probably leaning bearish here.
Let's see if we get anything. Okay, so we're not going to get any model here, but yeah, we're just dumping. But the fact that we failed to close above that 15-minute that would tell me we're bearish. For this point, we're so far low. I mean I guess we could come down here, but uh okay, this long actually looks pretty good. I like how we came into this fair value gap and I like how even if the bias still bearish, we're likely to retrace to the point five here.
So, I'd maybe try this. Um it's like a five-minute inverse here, stop at the like midpoint of this wick, target like the CE. Let's see if it would work. Again, I wouldn't get out yet cuz we didn't close below. Let's see. I've got I'd go break even here cuz I know if I'm right, we're not going to stall. And boom, I get stopped break even. So, that would probably be like a break even trade for me, right? And look, I would not get out of this trade because we did not close back below this five-minute, right?
But I like that trade idea because I figured we'd go to 50%. We probably will, but that was just a really bad PA. Unfortunately, this will not save me, but it's fine. Was there like another setup to get in? I probably would have gone back in if you got another setup maybe, but not the most likely one. Go over to one more here, session for me to do that. Okay, uh New York session, we're going to go to the one 15-minute first. 15-minute, this is very tricky.
We have this fair value gap, but then we have this high. Um okay, rejecting this. So, I'm leaning bearish just based off this reaction. Hourly doesn't really tell me Oh, okay, we're rejecting this hourly, too. I'm leaning bearish because of this reaction. So, now what I'm going to do is I'm going to go on the one-minute. Is there a setup? Yes, there is. Look at this. Perfect V-shape. I'm bearish cuz of reaction. I'd probably short this, stop at loss at the death candle high and then I probably target like a London low.
I guess there's an Asia low, yeah. And I'd probably just target this Asia low, so. Again, I don't really know what's going to happen in that, but I was leaning bearish just because of reaction. Let's see what happens. And boom, it would break even trade. Um so, you can see I would break even there and it would have saved me, see? And now it looks like we're going to go long again. I'm bullish here, but I probably would have been done for the day to be honest.
So, yeah, um that's basically what I do and my thought process. Uh all right, let me find one more example cuz I kind of want to end it on a win, not a break even trade. All right, so like I said before, we're going to do the same thing. Here's 9:30 open. We're going to go to the 15-minute, see what's obvious, see what we're working with. Uh looks like we're pretty high in premium, so I'd probably be looking for some sort of short here.
Um is there any gap we can base anything off of to the left? No, it looks like we're at all-time highs. So, we're at all-time highs, uh probably going to be a little tricky, but we're going to see if we get some sort of decent short. Okay, this already looks decent, okay? I will say this, taking a short like this at all-time highs is not the smartest plan in the world, okay? We're not delivering from anything and we're never delivering anything off of all-time highs, so the win rate of these setups go way down.
Can they be profitable? Yes. So, we're going to try it. Um this could be a loss and if it is, I'm going to keep it in the video, but I like how you know, we manipulated, we're in premium. I like how there's a quick break even point and I think I'm just going to go for a 1R and go for this gap because usually all-time highs just keeps running up. So, we're going to try it. I think this is probably like a 50-60% win rate play, but it doesn't look bad and if it loses, I guess it'll be better cuz it'll be more transparent for the video to show that I don't win every time.
So, let's try it. Get in and boom. Okay, just stopped out instantly. >> [laughter] >> So, uh yeah, okay, wow. So, it ended up stopping me out, hit the hard stop here, but it never closed back above the inversion and then it did hit my TP. Um yeah, wow. Just unlucky I guess and then we did go to lower day, but yeah, shorting all time highs is not the um not my strong suit, okay? Shorting all time highs is is pretty risky.
All right, we're going to try again one more time, see if we can land in a win here. Again, we're going to start with the 15-minute time frame, see where we're at. Um it looks like we have an obvious 15-minute gap here, which like this could be higher time frame hourly. Let's check. Okay, we're in a very obvious hourly, okay? So, I'm probably going to base my bias based off of whatever happens in this hourly. So, let's just watch price and see kind of the vibe at open.
I go to the 1-minute. I usually like to start the 1-minute chart, but okay, so pretty bearish reaction. Okay, pretty bearish reaction. We cannot break this hourly. So, I'm thinking that this is going to be a short, okay? This candle closure here. I'm going to do a stop like probably the high here and I'm going to go for what's a good targets. Do you want to go to liquidity pools? I like to look for equal highs, equal lows.
We don't really have anything major. I guess we kind of have I guess you consider these relative equal lows, but not the greatest targets, but we're going to try it. We're uh reacting obviously, you know, we're in premium, so it looks good. I'll probably go break even uh we take this low again. Yeah, looks pretty good. Okay, see and boom. Uh funny enough that the the the candle didn't even close when I got in. It closed down here, um but you can still see the concept applies, right?
In premium, rejected the gap. Kind of just started shooting through this, target relative equal lows. Could you target down here? Probably, but it's a little risky when we're close to all time highs, you know, you're not always going to get that target. It hits. Looks like it's just not not going to hit. So, yeah, would have been a break even trade. So, I feel great about that one and uh yeah. And with that, that is going to be a full beginner's guide on how I trade inversion for rally gaps, okay?
If you scroll on Instagram, you scroll on YouTube, you're going to see a lot of other mentors teaching my exact model. They all kind of have their own renditions of it and you know, everyone in the space who does this I either taught or I taught their mentor or their mentor. Um and I'm not claiming to take credit for their experience um because, you know, once they do get the experience, they kind of just learn and teach things themselves, but it's crazy how far and how wrong some of these guys are teaching this and I still believe my way is the best way and then you're going to find your own kind of rendition of it and get your own experience and that's where you're going to truly become profitable.
So, this is just a good baseline to start. I hope you guys understood. If you guys have any questions in the comments, let me know and that's pretty much going to be it for this video. Don't forget to shoot Dodgy for all prop firms. I strongly recommend, you know, buying a few prop firm accounts, you know, whatever one has a discount, Apex 20 accounts as well, code Dodgy and, you know, try the strategy as a beginner and see how you do and I would probably stick with it for 6 months to a year before you decide, "Hey, maybe I don't like it." but most people do like it.
So, good luck, go study, go backtest and let's get rich.
The words are the caption track's own and nothing is reworded or re-transcribed. Paragraph breaks are placed between sentences so the text reads as prose.
Free tools for your own script: paste a draft and see where it stands before you record it.
Paste your draft and see where viewers are likely to drop off, with a rewrite for each weak line.
Paste the first 30 seconds of your own draft for a hook score and rewrites.
Check your draft against YouTube's advertiser-friendly guidelines before you record it.
Read this channel's public videos and transcripts, and download a writing brief for it.