Getting the transcript
Reading the captions from YouTube. A video nobody has opened here before takes 10 to 30 seconds; this page fills in on its own.
Getting the transcript
Reading the captions from YouTube. A video nobody has opened here before takes 10 to 30 seconds; this page fills in on its own.
Joseph James Trading With JJ · @SchoolOfTrade
Words
4,356
Runtime
26:12
Speaking pace
166wpm
Reading time
18min
166 words per minute, between the 160 25th percentile and the 181 median of 349 measured videos. That distribution comes from the 349-video hook study.
Opening (first 30 seconds)
Ooh, we have a beautiful breakout pullback setting up right now on the Nasdaq and the S&P tonight. In fact, I've got two breakout pullbacks I'm watching for tomorrow's session. The good news is I only need one of these trades to hit to make a bunch of money with you on the live stream tomorrow morning. So, in tonight's video, let's break down this strategy with entries, exits, and variations because tomorrow got a bunch of news tomorrow morning. But by the
83 words, the words spoken in the first 30 seconds at 166 words per minute.
Free, no signup. See how the first 30 seconds hold attention, with rewrites.
Sentence shape
| Measure | This transcript |
|---|---|
| Sentences | 326 |
| Average words per sentence | 13.4 |
| Longest sentence | 46 words |
| Questions asked | 56 |
| Sentences containing a number | 27 |
Most used terms
Filler phrases
46 in total: right? 29 · like 9 · basically 3 · kind of 3 · uh 1 · you know 1.
A literal whole-word count of the same phrase list the Prepublish browser extension uses, so a phrase inside another word is not counted and a phrase used in its ordinary sense still is. It is a count and not a judgement.
Free, no account. See where attention is likely to drop, with a rewrite for each weak line. The free check shows the scores and the one issue costing the most. Or run it on the words above first.
Free · No login · See a sample audit first if you prefer.
What this transcript is
Every word below is the caption track YouTube publishes for this video, pulled from the video itself and reproduced unchanged. It is not Prepublish's writing, not a summary, and not a re-transcription: it is the video's own published captions. English captions, generated automatically by YouTube, in the video’s original language. Source: the video on YouTube. A channel that would rather this page did not exist can ask for its removal through the contact page, and it is removed.
No Script X-ray for this video: YouTube shows a Most replayed graph only once a video has enough views.
Ooh, we have a beautiful breakout pullback setting up right now on the Nasdaq and the S&P tonight. In fact, I've got two breakout pullbacks I'm watching for tomorrow's session. The good news is I only need one of these trades to hit to make a bunch of money with you on the live stream tomorrow morning. So, in tonight's video, let's break down this strategy with entries, exits, and variations because tomorrow got a bunch of news tomorrow morning.
But by the time we're done this video though, I want to make sure everyone has a clear vision of the game plan to make a bunch of money together on the live stream on Wednesday morning. So, charts are ready. Enough of the intro, right? We got one more day left September, end of the month, end of the quarter. Let's get these charts put together, put the game plan together, get some more green on the screen the final day of September tomorrow morning.
Nasdaq's ready. Oh, the S&P's always ready. I've got three clues tonight telling me where I think the easy big money is made on Wednesday's trading session. The first clue, it's all the way up on the daily chart right now. What do we know on the Nasdaq daily? Well, first of all, that was a very strong run up May into June. Anytime we see that much strength, we know a deep pullback and a retest of those, in this case, those all-time highs.
So, we know exactly where the buyers are trying to go right now. The only question right now though is there's a range below us down there. Ranges, when they break out, they love to break out pullback. So, the question right now is is will we pull back, fill that gap, take out that breakout pullback before we take out the all-time highs, or will we take this small range right there, rotate higher, and punch that ticket in between?
So, the Nasdaq daily tells us we're definitely bullish overall. We know exactly now where the buyers are trying to go. The question is do we go lower before we get there? That's the only question right now we have on the Nasdaq. There's one big clue here on the daily chart. But, let's now drill down to a faster time frame. A bit of a messy chart here on the Nasdaq hourly. What do we see right now? Well, first of all, we have that big strong run up we saw last week.
Anytime we see those big moves like that, it's always a deep pullback and a retest of the high. know once again, we know these buyers are in full control of momentum. They had a shot to reverse it, but they failed on that one. So, buyers are definitely still in control here on the hourly. Look at that large triangle. Triangles like to rotate back higher here right now, and that range right there, up, down, back up again, trying to rotate here off of that low.
So, lots of bullish pressure here on the hourly. Now, tomorrow we have the PCE number at 8:30 Eastern time. So, if we were to go lower, look at all the support we have below us, a gap below us, two breakout pullbacks. Both of these are what we call unfinished business on our live stream. So, even if we do go lower right now, this is still going to be a big buying opportunity. That's a lot of important clues right now on the Nasdaq hourly.
But, the one thing the hourly will not do, it will not help us time the entries. Final chart right now on the Nasdaq. We'll grab the S&P a bit later on in this video. This one is a 4,000 tick chart. Tick charts make entry timing easier. So, the money is made every morning on our live stream. We got really three clues right now. One clue is that strong run higher. Again, anytime we see a strong move like that, we know a pullback and a retest.
So, we know exactly where these buyers are hunting for in the short-term on the Nasdaq. What else do you see? There's a range right there. What do ranges do? They rotate, right? The amount above the range, the amount below the range, we get into that range, rotate up, rotate down, and now we're trying to finish off that bullish rotation going higher. It lines up just above that recent high at 741. But, my favorite clue on the chart right now is that little range we have underneath us.
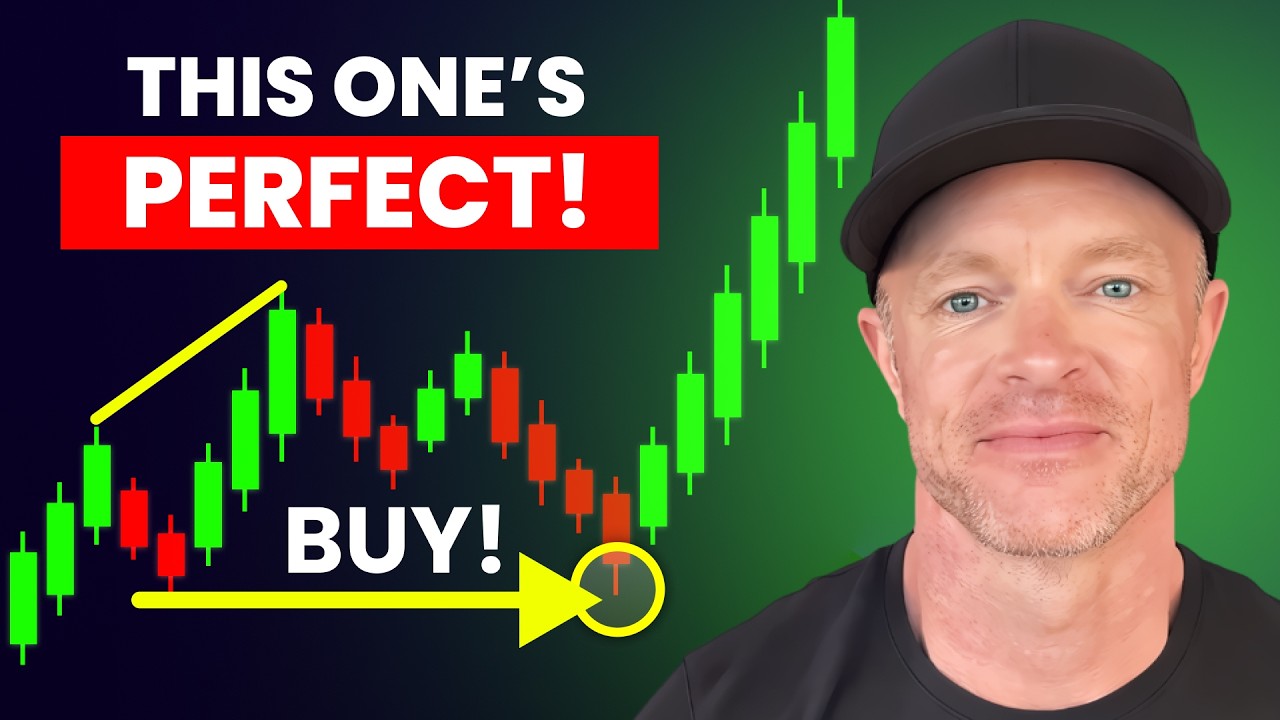
That's why I said earlier, it smells like a breakout pullback setting up right now. That range has now rotated off that low. We're trying to run higher, and I would imagine a breakout pullback would be a great trade for us on the way up to those recent highs, up to that pendulum swing, up to that gap fill overhead. So, one of my favorite trades here for tomorrow is I would love to pull back off the low of that channel.
Ideally, I want to pull back off that range back there. Get below that 21 EMA, and really, guys, the stronger that pullback is, the better. Cuz I want to fool some bears into thinking this is a reversal. Because once those bears get trapped below that 21 EMA, I can squeeze those stops, basically buy that breakout pullback, and run that sucker higher. Now, remember, if that breakout pullback works, and we start to squeeze running higher here right now, my goal will be to add to my winner.
And to do that, I'm looking for some separation away from that moving average. If I see separation off the 21 EMA, my goal will be to add more on this winner before we take out those highs up around that gap fill at and 3/4. Love that breakout pullback bear trap. Add more as it rotates higher. We're trying to go up, take out the highs, up for the gap up there. Pretty easy game plan overall. Now, we get some news tomorrow morning, right?
We may see a relatively sharp move going lower, and it may punch right back up again. Remember, if we run lower and we don't get a chance trap those bears in, if it V-bottoms off of that low, my goal will be find that channel, then find those prior swings. We talk a lot about this on our live stream. And what do we always say? First test is the best test off the low of that channel. So, if we get a sharp run lower tomorrow, look for that V-bottom, no bear trap, but as it runs higher, don't miss that V-bottom play getting in below those swings, and that first test the best test off the low of that channel.
Now, remember, this breakout pullback strategy is very simple, but this strategy could easily change tomorrow morning because we have big news at 8:30 Eastern Time. So, come join me on the live stream. I'll be sharing screens, calling trades, and most importantly, I'll be adapting to changes once that news comes out at 8:30 Eastern Time. So, guys, gals, if you're not making the money you want right now, if you're making a bunch of mental mistakes, losing money right now, get on my live stream tomorrow, and I will show you how to time these entries properly.
That way, you can start making this money, too. What I'll do is I'll put a link down bottom of the video in the description of the video. I'll put a pop-up there for you, upper right-hand corner. Do me a favor here, guys. Pause the video, then hit that pop-up link there, upper right-hand corner for tomorrow's live stream, because trading is so much easier when we do it together on the live stream. You'll know where the best entries are, how to hold those runners a lot longer, and you'll finally get the confidence and consistency you're missing in your trading.
Guys, my live stream is the missing piece you've been looking for. So again, grab that link down bottom description or hit that pop-up there upper right-hand corner. You do not want to miss tomorrow's live stream 8:30 Eastern time. So grab those links, get registered. I'll see you tomorrow morning at the opening bell and we'll trade these breakout pullbacks together. Now, I mentioned earlier we have a big news report tomorrow at 8:30 Eastern time.
What if price makes a really strong run going lower here? I want to make sure we steel man or get ready for both of these situations. Well, this is basically one big range. What do we always say on the live stream? The money is made around the edges, right? The edges, the edges of these ranges. So again, I like the idea of a breakout pullback there. But if we were to see a really strong run lower Think about this, if news comes out tomorrow morning and we see a very strong run going lower, what do we know about strong moves?
Strong moves love to retest and then resume the overall bullish trend. So if that happens for tomorrow, the goal is simple. I want to get in with what is basically a technical bear trap buying below swings tomorrow morning and get the run back up. That way, if we do pop higher and let's say we hold the underbelly, if you will, of that trading range I don't want to be buying as we go higher, right? So run lower, strong run, anticipate a retest then back higher.
I can try to buy that initial leg lower, but my goal will be to get in as low as I can. That way, if it holds the underbelly of that range and goes lower, I'm already in the green on that trade, right? I want to be buying as low as I can. I do not want to buy as it goes higher if we see a really strong move lower. And then the buy the retest on this, I love to use those 1 2 3 moves we use on our live stream, right? We always say 1 2 3 move.
It's a Fibonacci calculation, right? 1 2 3 Imagine that 1 38 2, that 1 61 8. I'll go into more detail on this tomorrow morning on the live stream, but that is how we buy that retest off that low. So, playing devil's advocate here tonight, if we do make a strong run lower, we know the edges of these ranges are where the money's made. It could be that low, could be that low, doesn't matter. But again, if it's a very strong move down, my goal is to initially buy below swings, get in as low as I possibly can to get quick first target, get rid of that risk.
Hopefully, it keeps running for us, but a lot of times though, those strong runs down, they're going to hold the underbelly of that range, and I will not hesitate to buy that retest. 1 2 3 moves we call them on the live stream, and we're buying that retest trade. I love retest trades on our live stream. So, that's the devil's advocate trade. That's if we're wrong about going higher here cuz then tomorrow we have some big news reports coming out at 8:30 Eastern Time.
All right, looking good. That's the game plan if we go lower, right? Going lower, buying breakout pullbacks, buying V bottoms, buying that big move going lower now. But what if we go higher here? I mentioned earlier I've got two different breakout pullbacks on my radar. We covered one of those breakout pullbacks here on the Nasdaq. Let's go grab the S&P right now and finish up the process for tomorrow's live stream. First things first though, let's go one step higher here on the S&P daily chart.
And before I forget, don't forget tomorrow we've got a bunch of news coming out at 8:30 Eastern time. We got GDP at 8:30, international trade, but the big number tomorrow is definitely that personal income number. We know the Fed is trying to figure out if they're going to raise rates again in October and that that PCE number will be a big big factor in the decision. That report tomorrow, the ISM on Thursday, we got the big jobs report on Friday.
So, a lot of big inflation related news coming out here tomorrow and the rest of the week. And don't forget tomorrow night, too. We got big earnings, Micron earnings report tomorrow night after the close. So, we have to be very careful tomorrow late in the day. Micron a very well-known kind of bellwether stock for the overall AI industry. Back to our charts though, it's good to know when the news is, 8:30 Eastern time tomorrow.
What do we see though on the S&P daily? A very strong run going higher. Buyers left that big gap wide open below. They chipped away at that gap and now they're trying to go back up and take out those all-time highs again, right? That range right in the middle. Ranges rotate up, down, back up again. So, the daily chart on the S&P definitely confirms we're definitely bullish overall right now. We certainly are in what I call the messy middle.
We're in the middle of that range right now. Things do get messy in the middle. No surprise there. We saw that recently on the hourly chart, but make no mistake. Bullish overall, we know the all-time highs are where these buyers are hunting for right now. That's one big clue here on the S&P daily. Let's drill down now to the hourly chart. What do we see here on the hourly? First of all, that strong run down is still there.
It's still there. That's still unfinished business. Anytime we see a strong move like that, it's only a matter of time for we take out those lows. So, just let me play both sides on the Nasdaq earlier, be prepared for a run lower here on the S&P tomorrow. But again, all that will be is is taking out that low, then we can probably resume the overall bullish move back up to those recent highs we saw, you know, early middle of the week last week.
On top of that, there's a big triangle. They tried to hold below it, but kept on closing back above it. That triangle has a bullish rotation going higher. That range right there, that range has a bullish rotation going higher right now. So, lots of bullish clues here on the S&P hourly chart. And again, we know if we do go lower, we know exactly why, right? Unfinished business down around those lows from late last week.
Hourly chart, big clue there. But again, the hourly chart will not help us time the entries. Final time frame here on the S&P, 7,000 tick chart there, 21 EMA. In case you're watching here tonight for the first time tonight, there are two ranges on this chart right now. The range right in the middle. And as I always say on our live stream, you have to learn how to find and use ranges because once you learn ranges, everything begins to make sense.
For example, the amount above the range, project that down below the range. Oh, coincidence, right? Yeah, probably not. Probably not a coincidence. What do you see right there, though? Right? Strong run down. Separates off that moving average. Separation means strength. They retest that low. So, now we have strong move taken out. Strong move taken out. All of the unfinished business is now all removed from this chart right now.
This range wants to rotate all the way back up again. Now, my favorite range on this is this one down here. That sneaky little range down there, right? A bearish range that now breaks out. And like I said earlier on the Nasdaq, I love the idea of buying a breakout pullback down here. So, the exact same game play we said earlier on the Nasdaq. Let's run this thing lower. Let's trap in some bears down here. Squeeze those stops.
And boy, we've a lot more space to go here on the S&P than we did earlier on the Nasdaq. Look at all the open space up there. Tons of open space there on the S&P. So, I'm going to grab that bear trap down there hopefully tomorrow. I'm going to try to add more on this as we rotate going higher. Remember, the key to adding more is is waiting for separation. Because once I see separation, then I know we have strength. Strength means another leg in the same direction.
It's a bear trap down here. It's an add-on as we rotate. And we know exactly where these buyers are trying to go because of that range rotation. Now, remember, let's play devil's advocate, right? That strong run down is all the way back there, right? That strong run down around that 7707 that level down there. If we were to get some bad news tomorrow, and this price gets whacked running lower here, we know why. We know that level down there is just begging to get retested.
And as I said earlier, if it makes a really strong run, expect that strength to want to retest and then go higher, right? Strong run, retest, and then go higher. So, the to buy this as we go lower, I really have to be buying as low as I can get in below swings. That way, if we hold the underbelly and make a run back down again, I'm already making money on that trade. I do not want to buy it as we go higher, right? Make sense?
There are times when I can buy as we go higher, but not in that scenario. Then what I'll do is is I'll use that Fibonacci extension. 1 2 3 move, we call these on the live stream, and we're going to buy a retest of that low. It's a bear trap, a technical bear trap. I call these crown reversal patterns on our live stream. You'll see lots of those tomorrow morning on the live stream. It's a crown reversal, a technical bear trap, and a retest trade tomorrow.
Two good trades there if that PCE number comes out a bit higher than expected. But here's the big question now, though. What if we keep going higher? Now, I would love to think that if we keep going higher, we're going to pull all the way back and get that breakout pullback. So, I'll definitely keep that on my mind for tomorrow. What's more likely though is if we do go higher here, there's a gap up there, you'll notice, around 7760, and we know the big high of day up there at that pendulum swing tells exactly where this price wants to go right now.
If we do wind up going higher, could I buy this? I can, but what do I need? I need separation, right? Separation is strength. So, as we're going higher, if I see continuation separation with the moving average, I'm buying below those swings. Now, what do you think? That range high up there, could I sell up here? How would I sell off the high up there? Well, first of all, I would go smaller size. I wouldn't go full size.
And second of all, I would use a crown reversal pattern. It's buyers trying once, lower low, buyers trying twice. The goal is is I want to see some lower lows in price. I want to get momentum to turn over for me, and then focus on shorting above a prior swing. Right? Often times, by the way, often times, these will go higher. We get that separation. We run up, take out those highs, and we get whacked back down again.
Often times, it'll get crushed back down again. Grinding, grinding down. The goal will be find some lower lows, and then get in above those swings. That's the most important thing, right? The most important thing is is sell above those swings. And again, this for me is a half-size trade. It's a quarter-size trade. If you're not making money going with the trend or with momentum, that might be a trade to take on someone else's account.
Or I'm kidding with you, obviously. But that might be that might be a demo trade or a sim trade or a prop account trade for you tomorrow. So, we run up. We're getting in below those swings. As we take the highs out, we look for that crown reversal pattern. Again, lower lows, get that short above it. And then, where's the second breakout pullback? The second one now is off that range itself. Now, when I think about breakout pullbacks, I always think about a two-legged move.
I call these one, two, three moves. On our live stream, we'll talk more about this tomorrow morning in real time as things set up, but imagine now that two-legged pullback, one leg, two leg. Think about that 138.2, that 161.8, that 200% extension, right? The bigger the move, the better. All this is now is a breakout pullback off that range right in the middle. So, moving average comes over, we get those entries long, we get that cram reversal so we pull back with that one, two, three move, and now it feels very bearish.
Perfect. Let's now go out and trap those bears in, blow that 21 EMA, squeeze those stops, and run right back up to where? Back up to retest those highs here. So, again, a breakout pullback, I'm taking nibbles below swings on the way higher. I will consider, might not get it, consider that bull trap, that cram reversal short off the high, but I will not hesitate on that breakout pullback off that range, right? Breakout, pullback, use the range in the middle for the breakout pullback.
Now, couple things you want to be aware of here as we go higher here. Often times during these large range rotations, we often times will pop up and start grinding, grinding, grinding. If we grind higher, find a large channel, draw off those highs and off those lows, find those swings, and get in below those swings. I'll go more detailed on entries on this tomorrow, right? But the basic idea is if it grinds up like this, keep anchoring that channel off those highs, keep pinning that channel down around these lows, and then simply take that first test is the best test, could be a bear trap, could be an add-on.
Again, I can't teach all of this in these YouTube videos, but tomorrow morning though, on the live stream, I'll show you exactly the time these entries properly in real time tomorrow morning. And the final thing would be, what if we pop higher here and go into another trading range? In all reality, this is even easier to make money with because what does that range want to do? That range wants to rotate going higher the amount below, the amount above, right?
That range wants to rotate. What does that range below us want to do? That range below us wants to hold as a breakout pullback. So, if the trading gods are being nice to us tomorrow, it'll pop up into a range and I can use that range below us for a breakout pullback, bear trap, below that low, add more as it rotates. Remember, during range rotation, we always add more below swings during range rotation, the amount below the range, the amount above the range.
That creates that target for us up overhead. I love those types of trades. In fact, if there's a heaven for a day trader, right? That's we see every day. Every day is range rotations in the heaven for day traders, if you want my opinion. The only other uh kind of kind of trick on this would be if it pops higher here right now into a range and then goes higher first, right? That's where the curveballs happen. We got major resistance up overhead.
So, don't be surprised if they go range bound, go up first, crown reversal, remember bull trap off that high, lower low, above that high, the bull trap. And again, boy, this will feel like a reversal, won't it? That will feel very bearish, but it's not bearish. It's a range rotation. That's all that is, right? It's not a reversal. So, once that price comes lower, takes out that symmetry, right? The amount above, the amount below, we then know where the profit target is on that core reversal short, and we know exactly now where to look for those bear traps and run right back up again.
Now, obviously, this plan could change a bit tomorrow, but that's the basic stuff watching here for Wednesday morning's live stream. And again, tomorrow morning 8:30 news, we may see some shake-up tomorrow morning after that news comes out. So, come join us on the live stream. We'll trade this all together. Guys, you're wasting your time out there doing this all on your own. I'm giving you an 18-year veteran's worth of shortcuts every day on the live stream.
So, again, grab that link down below, get registered, and I'll see you tomorrow morning 8:30 Eastern time in real time on the live stream. In the meantime, guys, be well out there. Be nice to each other. Well, yeah. And I'll see you guys next time. Adios, amigos. Bye for now.
The words are the caption track's own and nothing is reworded or re-transcribed. Paragraph breaks are placed between sentences so the text reads as prose.
Free tools for your own script: paste a draft and see where it stands before you record it.
Paste your draft and see where viewers are likely to drop off, with a rewrite for each weak line.
Paste the first 30 seconds of your own draft for a hook score and rewrites.
Check your draft against YouTube's advertiser-friendly guidelines before you record it.
Read this channel's public videos and transcripts, and download a writing brief for it.