Getting the transcript
Reading the captions from YouTube. A video nobody has opened here before takes 10 to 30 seconds; this page fills in on its own.
Getting the transcript
Reading the captions from YouTube. A video nobody has opened here before takes 10 to 30 seconds; this page fills in on its own.
AI Engineer · @aiDotEngineer
This video has no Most replayed graph yet: YouTube shows one only once a video has enough views. These are the moments viewers replayed most in AI Engineer's most watched videos.
Most replayed moment at 11:58
4.6x that video's typical replay level
issues. Uh I also invented OS certification. I just close the tracker whenever I want, so I have my life back. So, does this work? Yes, sort of. >> [laughter] >> Which leads me to act three, slow the down. Everything's broken.
Said at 11:52
Most replayed moment at 18:45
4.8x that video's typical replay level
that they're they're changing they're changing things in the database not yet. You want to run them through the ontology first and make sure that works. Okay. I only got an I've got I've got another I've just a short time. I'm going to try to show you some of the things that um that you can
Said at 18:37
Most replayed moment at 16:13
3.6x that video's typical replay level
method signatures, the program layout and the call stacks. So here's some examples. I don't think you'll be able to read this one, but this is like the level of abstraction we're at. It's how we're actually going to lay this stuff out and how these systems are going to interact. Dylan Mulroy from Cloudflare talks a
Said at 16:06
The graph counts replays. It does not show where viewers stopped watching.
Words
3,781
Runtime
19:09
Speaking pace
197wpm
Reading time
16min
197 words per minute, between the 181 median and the 201 75th percentile of 349 measured videos. That distribution comes from the 349-video hook study.
Opening (first 30 seconds)
Uh I'm Justin Rio. I'm the deputy CTO at DX. I get to do a lot of our research around uh developer experience and its relation to developer productivity. And certainly over the last year, a lot of that research has focused on AI's impact on the developer experience and basic aspects of productivity uh within an organization. Uh so we produce these quarterly reports, our our state of AI and AI impact reports which looks at really a lot of raw data that we're able to get from our platform. Our platform is a researchback platform uh built
99 words, the words spoken in the first 30 seconds at 197 words per minute.
Free, no signup. See how the first 30 seconds hold attention, with rewrites.
Sentence shape
| Measure | This transcript |
|---|---|
| Sentences | 228 |
| Average words per sentence | 16.6 |
| Longest sentence | 123 words |
| Questions asked | 32 |
| Sentences containing a number | 28 |
Most used terms
Filler phrases
151 in total: uh 47 · like 29 · right? 16 · actually 14 · um 14 · you know 13 · kind of 8 · sort of 7 · I mean 2 · literally 1.
A literal whole-word count of the same phrase list the Prepublish browser extension uses, so a phrase inside another word is not counted and a phrase used in its ordinary sense still is. It is a count and not a judgement.
Run the check on the words above: where attention is likely to drop, with a rewrite for each weak line. The free check shows the scores and the one issue costing the most.
What this transcript is
Every word below is the caption track YouTube publishes for this video, pulled from the video itself and reproduced unchanged. It is not Prepublish's writing, not a summary, and not a re-transcription: it is the video's own published captions. English captions, generated automatically by YouTube, in the video’s original language. Source: the video on YouTube. A channel that would rather this page did not exist can ask for its removal through the contact page, and it is removed.
Uh I'm Justin Rio. I'm the deputy CTO at DX. I get to do a lot of our research around uh developer experience and its relation to developer productivity. And certainly over the last year, a lot of that research has focused on AI's impact on the developer experience and basic aspects of productivity uh within an organization. Uh so we produce these quarterly reports, our our state of AI and AI impact reports which looks at really a lot of raw data that we're able to get from our platform.
Our platform is a researchback platform uh built from the same folks who worked on Dora metrics and the space framework and the DevX framework. Uh and really at the end of the day it's a data gathering platform that can look at a lot of different trends across an organization with you know how are we focusing on developer experience are we seeing outcomes and improvements with developer experience and certainly are we seeing outcomes with the way that we're using AI in our workflows.
This session is going to be a little bit different than the 345 session I think that's up in the leadership room later today which just looks at the raw data from our newest report. It's a little bit of a preview. This is looking at more like organizational trends and how our workflow is changing and and things like that based on the data that we're seeing. Uh so first things first, let's kind of look at what we're seeing in terms of the velocity impact.
Now if anybody's familiar with looking at various velocity metrics like PR throughput and deployment frequency like hopefully you understand the caveat that these metrics are not perfect. They are proxy metrics for understanding the way that work flows through an organization. They're not fully representative of the value generation. We're going to look at some metrics that are closer to that as well. But let's just try to understand what this technology is doing in terms of just the raw velocity metrics in the organization.
So here's our Dora metric for deployment frequency. Who's familiar with Dora metrics? All right, most of you. Great. Um, so this is one of the, you know, four key metrics that tries to understand directionally, you know, the speed of shipping work within an environment. And we're seeing it steadily increase. um it's tapering off a little bit. I think there's reasons for that. Uh some of the surge that we saw early on was due to people shipping, you know, PRs more frequently and and things like that.
Um so we're seeing increases in this. This is one small part of the SDLC PDLC, right? This is like the creation uh of the PR to actually trying to deploy this into production. It doesn't tell us about revert rates. It doesn't tell us about defect ratios. It doesn't tell us about change failure rate. It just tells us about how much stuff are we now kind of pushing out into production. But you know the data is showing us that this number is steadily increasing.
Okay. Um the trends vary a little bit across regions. Um we are seeing North America just sort of like trending up. We've seen Europe actually pull back a little bit just in the last quarter. Um I think you know there's there's a number of reasons for that. I mean obviously the way work is done in these regions are differently. the way that we can spend money on this technology and think about token spend is different, the regulation is different.
Um, but if we just look at the through line in general, you know, we still see improvements uh in in this one metric of deploy frequency even across various regions. We do just see some variance in those regions. Here's one that's kind of interesting though. Uh, the perceived rate of delivery. How much faster do engineers feel in terms of what they're delivering? It's gone up a little bit. This number shows an increase of about four and a halfish percent.
Um, but given that that's a full year and given all the investment and cost and new spend on AI, it's interesting that this perceived rate has not stayed has not kind of crept up a little bit more. especially when you look at some studies like obviously infamous flawed MER study if you're familiar with that study uh back in February they actually released a follow-up to that study saying that some of the signals they gathered were sort of imperfect and they needed to rethink some of that but what was interesting was that in these 16 engineers that were part of that study small study flawed study uh the productivity went down by about 19% but the perception went up by about 20% so there was like a 40% spread in perception of productivity versus actual ual productivity.
But here when we look at this on more of an aggregate things interestingly stay uh sort of flat. All right. What about impact on quality and and delivery? Right? So those are just kind of our speed our velocity metrics. But what is this actually doing to our software quality? Um the first metric we'll look at here is the Dora change failure rate metric. And uh let me prepare you. Most of you are sitting down. It's very volatile the impact that we've seen on quality over this period of time.
Each line on this graph represents a single company that was part of this particular part of this study. And that line shows whether you've moved up in terms of your change failure rate or moved down in terms of your change failure rate. You want to go down. You want to be on the bottom side of this graph. Uh but what's interesting is if you look at some of these top lines, you see people increasing as much as 2%. Which doesn't sound like much until you realize that the industry benchmark is about 4%.
So that means shipping potentially 50% more defects than we were shipping before. So you really just want to understand what side of this graph you're on. You want to start measuring this stuff, right? Um this pattern exists without AI, by the way. This has a lot to do, it's not purely causal with AI. A lot of this has to do with like your release pipeline, your automated testing, everything that's surrounding the way that you're releasing the code.
The pattern remains the same. The amplitude has changed as a result of AI. We always see this type of shift in volatility, but not usually to these extremes. And that's the AI effect that we're seeing right there. Here's a really interesting one. These are two qualitative quant uh uh quality metrics uh that normally are sort of in sync with one another. Code maintainability, how how maintainable dovel developers perceive the code to be in terms of making changes to it.
That number has gone up almost 4% according to our data. By the way, we're looking at about 200,000 engineers in this study to gather this data. The uh co the change confidence though, which traditionally we've seen closely associated with code maintainability. Hey, this code is maintainable. It's modular. It's easy to modify. I feel good about the changes that I'm pushing into production. Nope. Our change confidence number has gone down 6%.
This is really an interesting tension because it means like, okay, agents and assistants are making it easier for me to understand and modify the code that's in front of me, but I trust the outputs less. I'm more afraid now of breaking things than I was a year ago. So, it's an interesting psychological effect that we see here. And a lot of this is because PR size is measurably increasing. This is going to be one of the most important metrics that we look at this year.
Hasn't quite doubled, but look at that trajectory, right? This is over the same period of study about a year and we've seen PRs go from uh around 44 lines on average per PR up to 72. Now there's there's a number of reasons for this. It's not just, you know, the likelihood that the way that these models work is that they're be being trained to output relatively mediocre code. I've been writing code professionally since the late 90s.
I remember when it was a great mark of a developer to be able to implement the same use case with as little code as possible. Now, it's like, well, no, let's get the thing out. And, you know, the code that's being generated is going to be essentially mediocre because it's law of averages. But on top of that, too, think about if you've got a build pipeline that takes 45 minutes or an hour to complete and now I've got AI generating functions for me instantly.
Am I going to push four different PRs with four different functions and wait 45 minutes or an hour or whatever that is per build or I'm just going to cram all that code into a single PR? Right? So there's multiple reasons for this, but it really bears mentioning that like every extra line of code is a potential bug, a potential vulnerability. It's more to review. It makes the code less portable. So we need to pay attention to this metric as well because we're also seeing this associated with perception of incremental delivery.
I get to work on small incremental changes and this is actually one of the lowest qualitative developer experience drivers that we've seen impacted over the last year. This number and this sentiment has gone down 10%. And incremental delivery is awful is is as we've learned also very important for uh for the way that we try to deliver in a way that's easy to roll back uh and where we can understand and review the changes that are being pushed through.
Okay. Uh what about demographic differences? Uh what is different about AI impacts across like you know junior devs and stuff like that? Junior engineers are using AI the most. This really should surprise nobody. anytime we have sort of a new leap again writing code professionally since the late 90s I'm a bit of an OG I'm on this journey too but there's less to unlearn when you're coming into the industry right in many many cases you've already been working with this kind of stuff like right out of school and so you're more likely to implement it uh when you actually start working now we've seen some other trends there too uh we have interesting ways of looking per use case at efficiency uh which I'll get into in the second talk later today and one of those is looking at agent experience like literally we're we're asking agents about their experience working with humans.
We're trying to figure out what use cases uh are they working on and how many tokens did they spend. And definitely we also see a trend where the more junior developers for the same use case will spend more tokens than a more senior developer on the same use case. And that's just a learning curve, right? Again, that should surprise nobody. But in terms of who's using it the most, we do see juniors using it the most. However, despite that additional use, we see staff plus or more senior engineers saving about the same amount of time, right?
And and burning less tokens. I want to make sure that that's kind of clear too. So in terms of like raw time savings in the aggregate output of this, it's pretty flat between junior engineers who are using the tech more and staff engineers who have an easier time spotting hallucinations, understanding the architecture around the changes they're making and things like that. Smaller companies lead in time savings. Sure, you know, the release pipelines are going to be less complicated.
You know, there's less overall complexity in the organization. uh that's going to uh lead to more time savings for a company that already has less friction and has a little bit more agility to it than a larger company. What about measurement? How should we be even be thinking about measuring this stuff? I mean, it bears mentioning that that measuring developer productivity and measuring developer experience was a challenge before AI and we we never completed that conversation before kind of throwing accelerant on this.
Right? So, this is still a difficult thing and I'd argue even more difficult to do now because it's confounded by several different aspects of of AI, but we're all going to have to answer this question this year, right? Spent 10 million or way more if you come to my talk later today on tokens. Uh where's our 10x productivity? When we're thinking about this stuff, it's important to bear in mind that we don't throw away what we're measuring, right? our foundational developer experience and developer productivity metrics are still what matter the most, right?
We want to understand how a AI is impacting these trusted metrics that we've already been looking at. Like we want to maybe look at cohorts of users. We maybe want to take data from the API telemetry and things that come out of the tools and use that to understand who's using what and where. But we would only want to use those cohorts and look at them comparatively across our foundational metrics. What is this actually doing to quality?
What is this actually doing to speed? What is this doing to impact to the organization and value generation? And so this is where our AI measurement framework comes from. I won't spend too much time on this. We have a big white paper available. Uh my colleague Anton who's standing in the back of the room in the the white shirt will be able to hand out some hard copies of reports that we have after the talk that go into the way that we derive this methodology and how to use it and think about it.
Um it focuses on three key dimensions of measurement. So looking at utilization, our daily active users, weekly active users, that sort of thing. Uh it looks at impact. So which metric should we be, you know, looking for moving the needle based on utilization? Uh as our utilization goes up, what do we hope to see in terms of impact to the business? And then cost. It's a fair joke that we're 15 years after the last major hype cycle and we're still trying to figure out cloud cost, but the stuff is getting pretty expensive.
We're going to have to measure it. Um so you can think about this as a bit of a maturity curve as well. Most people start with utilization on the left. Just figuring out what's happening in the organization with the tech, who's using it, what are they using, how often, and for what use cases. And then how do we then cross reference those to the impact metrics, the value generation, what we really want to understand to know whether these investments are actually working, which is what we really want to figure out.
This is just an example of how we might correlate such a thing. So you could look at two separate cohorts of users and you could compare them across metrics like PR cycle time or PR size or push back and review. Right? So lots of uh the way to think about this again is to right now separate cohorts and then look at how that plays out across these foundational productivity metrics that we've learned to trust. We also need to able be able to understand our platform's readiness.
I like to say that in 2024 we gave everybody a coding assistant. In 2025 we started building agents. Now, we're realizing that our infrastructure wasn't ready for any of this. A lot of the vendors that are here are are are selling solutions that help you with this problem. Um, I think if you can measure your platform's AI readiness, you're going to have a much better handle on how efficient you're going to be spending tokens and providing context to these agents.
So, these are things like clear and accurate, well structured documentation, data structures with straightforward relations, manageable modular code, reliable local CI and non-flaky test suites. If by the way any of this sounds familiar to you, it's because we used to just call this good developer experience, right? But it turns out that what's good for humans is also good for agents. So we may finally paradoxically be making those investments that we should have been making over the last couple of decades.
We also want to understand the effectiveness of the way that we work with AI. And this is one way of doing that. What you're actually seeing here is feedback, qualitative feedback coming back from agents telling us where they ran into issues with steering with the human. the the context that was provided for them, the the feedback cycles that they had to go through. So, we're actually getting that data from the agents to try to figure out how effective our teams are at working with AI.
And we can break this down into use cases, which is very important, too. We want to understand which use cases are giving us the most efficient token spend. And again, moving the needle for value creation and productivity within the business. Finally, the fifth trend, integrating across the SDLC and PDLC. Why would we want to do this? Because code generation was never the bottleneck in the first place, right? Even if engineers are getting like 100% accurate instant code coming from the models, which they are not, you would still only be attacking anywhere from maybe 14 to 16% of the overall value stream.
So we need to think beyond that. Uh especially because right now the productivity gains that we are actually seeing are more modest than expected. Despite additional PR throughput uh increases, our median increase in the study that we did from November to to 2024 to February this year only found about a median 7.7% increase in this velocity metric, a 13% average, but even our top performers were in the 70% range. Nobody hit 2x, nobody hit 5x, nobody hit 10x.
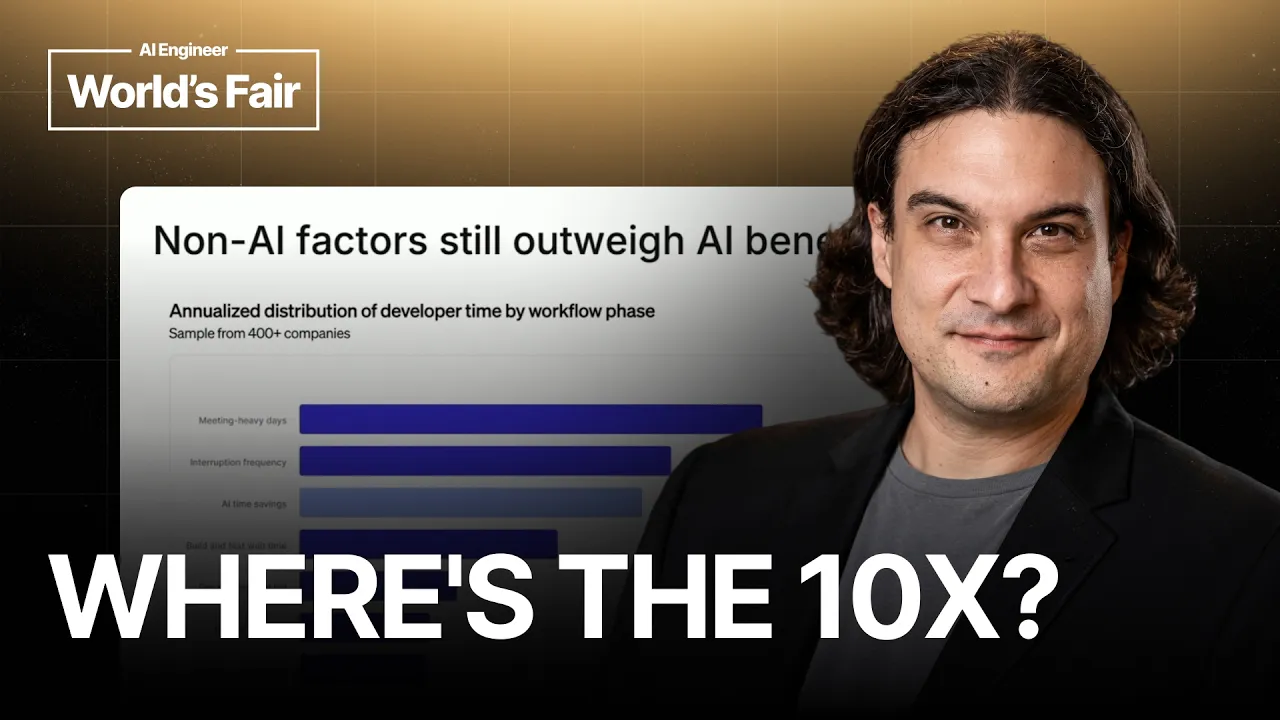
And that's because our time savings that come out of AI are still being outweighed by other nonAI factors within our organization, right? Right? We might be saving a lot of time with AI and that's great. But if we're still eclipsing those time savings because of meeting heavy days and context switching and other sources of interruption, the cumulative effects of the dev environment and friction in the way that we create software around the code, then we're not attacking the bottleneck.
And as Ellie Goldroat from the theory of constraints and the goal and uh inspire inspiration for the Phoenix project would tell us that an hour saved on something that isn't the bottleneck is worthless. And so we need to find the bottleneck and fix the bottleneck. And that's what a lot of organizations are doing. Morgan Stanley has been really public about their creation of the DevGen AI agent, which is an agent for interpreting legacy code like uh mainframe natural and cobalt.
And I hate to admit Pearl. I've written a lot of Pearl in my career, but it's legacy now. The agent actually creates PRDS to hand to engineers to get rid of that reverse engineering step. And it's saving Morgan Stanley about 300,000 hours a year right now. Zapier is one of my favorite stories in AI right now. They have a whole agent ecosystem that they're using to deal with a lot of administrative tasks and overhead like daily standups and things like that.
They've reduced their standups by using a agent summaries and things like that in this ecosystem that they've built to two times a week as opposed to five times a week. They're successfully onboarding engineers within about a twoe period which is really fast. Our industry benchmark for that is over a month usually. But my favorite part about this story is that they're seeing about a 15% additional value creation per engineer.
So they are hiring more than they have in the history of their entire company because they realize the truth here that they're getting more capacity per single engineer. They're getting a better return on investment per single engineer and hiring more engineers will improve their competitive edge. This is the right attitude. This is a throughput story. This is an increased innovative capacity story. This is not a headcount replacement story.
Fair. uh they're automating about 3,000 of their code reviews a week triggered off of a pull request and um they look at superficial stuff. They still need humans in the loop, but the initial superficial uh uh review that comes from the agent is all part of the system of record. It stays in the PR comments and so the next engineer to actually perform the review will have an idea of what the agents already looked at. So it can save some time.
Finally, Spotify, if anybody remembers the Spotify model from DevOps, they were sort of the northstar for DevOps. uh they built an agent for S SRRES that will gather remediation steps from runbooks and information and context about the incident and put all that together into SR communication channels so that when an incident occurs the S sur has uh immediate context and doesn't have to go through multiple minutes of discovery uh to figure out how to solve the issue.
So, if you want to dive deeper into this data, our Q2 report is coming out in just a few weeks. Uh, but the Q1 report still has a lot of tidbits from this session in it. And if you subscribe to our newsletter or you come back to the website, by midish end of July, we'll have our Q2 report. And if you want to see a preview of that report, that's the talk that I'm giving later this afternoon. Thanks everybody for your time.
I appreciate it.
The words are the caption track's own and nothing is reworded or re-transcribed. Paragraph breaks are placed between sentences so the text reads as prose.
Free tools for your own script: paste a draft and see where it stands before you record it.
Paste your draft and see where viewers are likely to drop off, with a rewrite for each weak line.
Paste the first 30 seconds of your own draft for a hook score and rewrites.
Check your draft against YouTube's advertiser-friendly guidelines before you record it.
Read this channel's public videos and transcripts, and download a writing brief for it.